
Scattered thunderstorms with severe gusts, hail and a tornado risk are possible near a cold front from the Ohio Valley to the Mid-Atlantic tonight. Tropical Storm Bertha is expected to bring tropical storm conditions to portions of the Gulf Coast from the panhandle of Florida into Louisiana through Wednesday. Read More >
Frequently Used Terms:
ASOS: Abbreviation for Automated Surface Observing System. This is the main type of automated weather station that is utilized to take weather observations at major airports across the country.
CLI: This refers to the Daily Climate Report text products that are issued each day by the National Weather Service to summarize the weather that was observed at a designated weather observation site during a calendar day.
METAR: Short for Meteorological Aerodrome Report. This refers to the weather report that is publicly transmitted by ASOS stations on a regular basis to summarize the observed weather conditions at the time of the report.
NWS: Abbreviation for the National Weather Service.
General Weather Observation Information and NWS Climate Products
Jump to Question:
How are official weather observations taken?
Most official NWS weather observations are taken at airports 24/7 by high-quality automated weather stations that are equipped with multiple weather sensors. At most major airports, the type of automated station that is used is known as an Automated Surface Observing System (ASOS).
Many major airports also staff FAA-contracted weather observers. Their primary role is to augment the observations taken by the ASOS and ensure that those automated observations are accurate. At some airports (including at O’Hare Airport and Rockford Airport), these observers also take snowfall and snow depth observations every 6 hours.
How are weather observations publicly reported in real time?
Weather observations are formally transmitted via Meteorological Aerodrome Reports, or METARs. Each ASOS station will disseminate a complete METAR observation once each hour a few minutes before the top of an hour. Once every 5 minutes, most ASOS stations will also send out shortened METAR observations that include less information and have less precision than the standard hourly METARs.
Additionally, in situations when there is a notable and/or rapid change in the observed weather conditions, a Special Meteorological Report (known as a SPECI) will be issued. These special METARs will contain the same full level of detail that hourly METARs have.
The time that a METAR was issued at is reported in the METAR using Zulu time (equivalent to UTC and GMT) following a formatting of “DDHHMMZ”, where “DD” is the date of issuance, “HH” is the hour of issuance, and “MM” is the minute of issuance. To convert this time to Central Time, subtract 6 hours for CST and 5 hours for CDT. For instance, if a METAR has “241351Z” listed as its time, that means that it was issued on the 24th day of the month at 1351Z (or 1:51 PM UTC/GMT), which converts to an issuance time of 7:51 AM CST or 8:51 AM CDT on the same date.
The hourly METARs for 00Z, 06Z, 12Z, and 18Z will also include the maximum and minimum temperature from the past 6 hours, the measured amount of liquid precipitation from the past 6 hours, and possibly the current snow depth (if 1” or more of snow is on the ground and a weather observer is present to take a snow depth observation and include it in the METAR), in addition to all of the other information that is typically included in all other hourly METARs.
More information on how to decode METARs can be found here.
Where can I find official daily weather observation information, such as what the high and low temperatures were at O’Hare Airport yesterday?
Daily weather observation information from officially designated weather observation sites is officially reported in the National Weather Service’s Daily Climate Report (CLI) text products. These products are published twice a day: intermediate summaries are issued shortly after 4:30 PM CST/CDT, while full day summaries are issued shortly after 12:30 AM CST/1:30 AM CDT. These products can be found on our Climate web page under the “Observed Weather” tab – just select “Daily Climate Report (CLI)” as the product, then select the location that you are interested in from the adjacent dropdown menu.
It is worth noting that the information in these CLI products is preliminary and subject to revision. Daily weather observations don’t truly become “official” until they undergo a final quality control process that is conducted by the National Centers for Environmental Information (NCEI) 3+ months after the observations are taken. After this process takes place, final and certified climate/weather observation data can be accessed on the NCEI website.
Where are official weather observations taken in the Chicago area?
In NWS Chicago’s area of responsibility, there are two official long term climate sites where weather observations have routinely been taken for over a century: Chicago and Rockford. Official observations for Chicago are taken at O’Hare Airport, while official observations for Rockford are taken at Rockford Airport, though historically, the exact location of where these official observations have been taken for each city has changed several times (more on that can be found here).
In addition, official NWS climate products are also issued for the following supplemental observation sites: Aurora Airport, DuPage Airport, Midway Airport, Chicago Executive (Palwaukee) Airport, the NWS office in Romeoville, Waukegan Airport, and Porter County Airport (Valparaiso).
What kinds of climate/weather observation products does the NWS issue?
The NWS issues several of these kinds of products. The Chicago NWS office, specifically, regularly issues the following climate products in text format:
Why does the daily high/low temperature or precipitation total reported in a CLI product for a certain observation site differ from the daily high/low temperature or precipitation total as derived from the midnight to midnight 5-minute, hourly, or 6-hourly observations from that site?
There can be multiple reasons why the daily temperature or precipitation observations reported in a CLI product don’t match what an ASOS station's 5-minute, hourly, or 6-hourly observations from the same observation site would suggest those numbers should be. These are most common causes of these discrepancies:
On rare occasions, ASOS stations can malfunction and report inaccurate data or no data at all. This can occasionally have some effect on what the high or low temperature or precipitation total are for a calendar day at an observation site. In these cases, erroneous or missing ASOS data is often addressed by internal quality control checks within the ASOS itself or by an FAA-contracted weather observer at the observation site so that it doesn’t get included in the ASOS station’s Daily Summary Message (DSM) product that is used to generate the CLI product for that site. Otherwise, NWS meteorologists will address any bad data included in these DSMs when generating and quality controlling our CLI products prior to disseminating them. This may also be a reason why the values reported in a CLI product don’t match what may have been reported elsewhere.
That said, ASOS observations are accurate the vast majority of the time and typically do not need to be corrected or changed for the corresponding CLI products. Users of this information should be aware that almost all of the perceived discrepancies between the daily temperature and precipitation values in a CLI product and an ASOS station’s observations simply result from the various quirks and nuances of recording and reporting weather observations that are listed above and are not actual errors in the disseminated CLI products.
Temperature Observations
Jump to Question:
How are temperature observations taken by ASOS stations?
An ASOS’s temperature sensor will record an air temperature reading approximately every 10 seconds in tenths of a degree Fahrenheit. These readings are averaged and stored internally by the ASOS in whole degrees Fahrenheit every minute. To reduce noise and simulate the typical response of a mercury thermometer, these 1-minute observations are then aggregated into a rolling 5-minute average temperature that is updated and stored by the ASOS each minute (once again in whole degrees Fahrenheit).
These 1-minute rolling average temperatures are the temperature readings that are included in the METARs transmitted by the ASOS. They are also used to determine the high and low temperature for a calendar day. The international standard for METARs is to include temperature (and dew point) readings in both whole degrees Celsius (in the standalone temperature/dew point group) and in tenths of a degree Celsius (in the METAR’s “T” group), so the ASOS’s stored Fahrenheit temperatures are converted to Celsius before they are disseminated in METARs.
Why does the daily high/low temperature reported in a CLI product not match the daily high/low temperature based on the 5-minute weather observations at that observation site?
In any location where an ASOS’s 5-minute observations are displayed in degrees Fahrenheit (such as on this web page), the displayed 5-minute temperatures may differ from the actual temperatures recorded by the ASOS by one or two degrees due to how the ASOS’s recorded temperatures are converted between Fahrenheit and Celsius and then rounded prior to being disseminated in 5-minute METARs.
As discussed in the answer to the question above this one, an ASOS will internally store a rolling 5-minute average temperature once each minute in whole degrees Fahrenheit. These temperatures will be converted to degrees Celsius and will then be rounded prior to being publicly transmitted in a METAR.
For 5-minute METAR observations specifically, these converted temperatures will be rounded to the nearest whole degree Celsius before being disseminated in a 5-minute METAR. Various websites that display decoded 5-minute METAR data then convert this rounded Celsius temperature back to Fahrenheit and round that value to the nearest whole degree Fahrenheit. This conversion and rounding process often leads to discrepancies between the 5-minute Fahrenheit temperatures that are displayed online and the actual Fahrenheit temperatures that are recorded and stored by the ASOS.
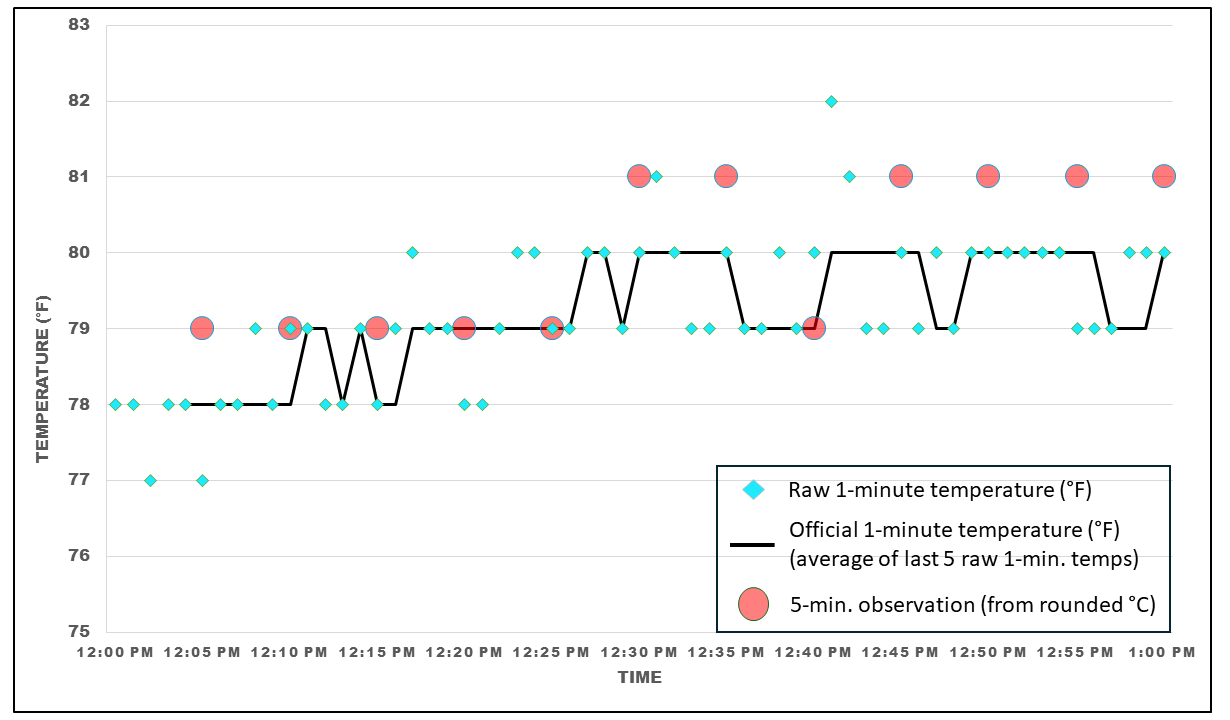
For instance, let's say that the actual air temperature recorded and stored by an ASOS is 80°F. That reading converts to 26.7°C, which is then rounded to 27°C for the 5-minute METAR observation that the ASOS disseminates. The disseminated 27°C reading converts back to 80.6°F, which rounds to 81°F. Thus, many websites will display 81°F as the observed temperature for the 5-minute observation even though the actual temperature recorded by the ASOS at that time was 80°F. The graph below illustrates how these 5-minute METAR temperatures that are converted back to Fahrenheit from a rounded whole Celsius value (red circles) can differ from the actual rolling average Fahrenheit temperatures stored by the ASOS (black line).
 |
This is not an issue with the temperatures that are reported in hourly and special METARs as an ASOS station’s recorded temperatures will be rounded to the nearest tenth of a degree Celsius prior to being disseminated in those types of METARs. This level of precision helps retain an ASOS station’s original Fahrenheit temperature observations when the corresponding Celsius temperature readings are converted back to Fahrenheit.
It is also worth mentioning that the high or low temperature for a day can be observed in between observation times and thus never reported in any 5-minute, hourly, or special METARs.
The key points here are that the temperatures reported in an ASOS station’s 5-minute METARs won't always be reflective of the actual temperatures observed by the ASOS at those times, and that looking at the temperatures in individual METAR observations won’t always tell you what the high and low temperatures were for the day at an observation site. Always refer to our CLI products if you need to know what the actual high and low temperatures were for a calendar day at a certain location.
Why does the daily high/low temperature reported in a CLI product not match the daily high/low temperature based on the 1-minute weather observations at that observation site?
The high and low temperatures for a calendar day are based on the values that come from taking a rolling 5-minute average of an ASOS station’s raw 1-minute temperature observations every minute. Many 1-minute ASOS temperature observation archives that are available online display the raw 1-minute temperature observations from ASOS stations, which won’t match their averaged 1-minute temperatures and, therefore, will not always be reflective of the actual high and low temperatures for a calendar day that are reported in our CLI products.
Below is an example that highlights the difference between an ASOS’s raw 1-minute temperatures and its averaged 1-minute temperatures. The values in this table are the same values from between 12:30 PM and 12:45 PM in the graph from the above question, so that graph can be referenced to visualize this difference as well. Raw 1-minute temperatures are represented by cyan diamonds in that graph, while the 5-minute average temperatures are represented by a black line.
| Time | Raw 1-Minute Temperature (°F) | 5-Minute Average Temperature (°F) |
| 12:30 PM | 80 | Dependent on data prior to 12:30 PM |
| 12:31 PM | 81 | Dependent on data prior to 12:30 PM |
| 12:32 PM | 80 | Dependent on data prior to 12:30 PM |
| 12:33 PM | 79 | Dependent on data prior to 12:30 PM |
| 12:34 PM | 79 | 80 |
| 12:35 PM | 80 | 80 |
| 12:36 PM | 79 | 79 |
| 12:37 PM | 79 | 79 |
| 12:38 PM | 80 | 79 |
| 12:39 PM | 79 | 79 |
| 12:40 PM | 80 | 79 |
| 12:41 PM | 82 | 80 |
| 12:42 PM | 81 | 80 |
| 12:43 PM | 79 | 80 |
| 12:44 PM | 79 | 80 |
| 12:45 PM | 80 | 80 |
In this example, the lowest raw 1-minute temperature and 5-minute average temperature happen to both be 79°F. The same can't be said for the highest temperatures, though, as the highest raw 1-minute temperature recorded by the ASOS during this time period was 82°F, while in the averaged 1-minute data, the highest temperature was 80°F. If this was the warmest that temperatures got during this calendar day, then even though an 82°F reading was recorded in the raw 1-minute data, the official high temperature for the day would be reported as 80°F because the daily high and low temperatures are based upon the 5-minute rolling average temperature readings.
Precipitation and Snowfall Observations
Jump to Question:
How are precipitation observations taken by ASOS stations?
An ASOS station is equipped with one of two types of components that take liquid precipitation observations. The Heated Tipping Bucket (HTB) rain gauge is the original component that all ASOS stations were equipped with, but at many ASOS sites (including at O’Hare and Rockford airports in the NWS Chicago area of responsibility), they have since been replaced with an All Weather Precipitation Accumulation Gauge (AWPAG).
HTBs collect precipitation using a heated 12-inch diameter funnel. Beneath the funnel, there is a pivoting (or see-saw) dual-chamber tipping bucket that tips over every time it collects 0.01” of liquid precipitation. The number of tips is recorded electronically once per minute and is used to determine how much liquid precipitation was measured over the past minute. To account for the tipping bucket not being able to keep up during periods of high precipitation rates, the measured precipitation total over the past minute is then run through an algorithm. In cases of very high instantaneous rainfall rates, the algorithm may adjust this total slightly, but in most cases, the 1-minute precipitation accumulation will remain unchanged. The output of this algorithm, rounded to the nearest hundredth of an inch, will be stored by the ASOS as the accumulated liquid precipitation total for the past minute.
The HTB includes heating elements that help prevent freeze-ups during cold conditions and also melt frozen precipitation into liquid so that the precipitation’s liquid water equivalent can be measured. However, it has several limitations that can cause it to under-report liquid precipitation during extremely heavy rainfall and when the type of precipitation is something other than rain.
The AWPAG was introduced in an effort to address the HTB’s limitations. It continuously weighs the precipitation that it captures and then converts the weight into a liquid equivalent accumulation. Once each minute, its current accumulated precipitation reading is compared against its previous accumulated precipitation reading to determine the accumulation that occurred over the past minute. That accumulation is then run through the same adjustment algorithm for high instantaneous rainfall rates that is used with the HTB, with the output then getting stored by the ASOS as the accumulated liquid precipitation total for the past minute.
Between its more robust precipitation measurement method and some additional internal firmware algorithms that it utilizes to account for a variety of factors that may influence the measured precipitation total (such as evaporation and wind turbulence), AWPAGs tend to provide more reliable liquid precipitation measurements compared to HTBs – particularly during periods of wintry precipitation.
Note that ASOS stations cannot measure snowfall accumulation or snow depth – that has to be done manually by human observers.
How are snowfall and snow depth observations taken?
Snowfall and snow depth observations are taken manually by human observers using a measuring stick and a snow measurement board. FAA-contracted weather observers are responsible for the snowfall and snow depth measurements at O’Hare Airport and Rockford Airport, while NWS Chicago meteorologists take the snowfall and snow depth measurements for Romeoville. At Midway Airport, FAA-contracted weather observers only take snow depth observations, while an NWS Cooperative Observer takes unofficial snowfall measurements for the Midway Airport area 3 miles southwest of the airport.
Official snowfall measurements for designated climate sites are taken and reported every 6 hours at the standard 6-hourly observation reporting times of 00Z, 06Z, 12Z, and 18Z (6:00 PM CST/7:00 PM CDT, 12:00 AM CST/1:00 AM CDT, 6:00 AM CST/7:00 AM CDT, and 12:00 PM CST/1:00 PM CDT, respectively). The latest 6-hourly snowfall observations for Chicago, Rockford, and Romeoville can be found here. Measurements are also taken shortly after snowfall has ended to ensure an accurate snowfall measurement as any melting, compaction, or blowing of the fallen snow in the time between the end of the snowfall and the next standard snowfall observation time could otherwise result in an erroneously lower snowfall measurement. Snow depth measurements are also taken every 6 hours at the standard 6-hourly observation times.
To take a snowfall measurement, an observer simply inserts their measuring stick vertically into the snow that has accumulated on their snow measurement board and makes note of the new snowfall accumulation depth. The snow is then cleared from the board so that each 6-hour snowfall observation period starts with no snow on the board.
Snow depth measurements are taken in a similar manner, except the snow board for snow depth measurements is NOT cleared after a measurement is taken.
How do snowfall measurements account for blowing and drifting snow?
Ideally, snowfall and snow depth measurements are taken in a location where the potential for blowing and drifting is minimized. Many observation sites actually utilize snow fences that surround the designated snowfall observation area to limit the wind’s influence in that area.
However, even with good siting and the usage of a snow fence, it is practically impossible to completely negate the influence of wind on snowfall measurements in all cases. In cases where significant blowing and drifting causes an uneven snowfall distribution on the ground, observers will take multiple snowfall/snow depth measurements in the vicinity of the designated snowfall observation area and average those observations out to obtain an approximate measurement that is representative of the new snow accumulation or snow depth.

