St. Louis, MO
Weather Forecast Office
US Dept of Commerce
National Oceanic and Atmospheric Administration
National Weather Service
St. Louis, MO
12 Missouri Research Park Drive
St. Charles, MO 63304-5685
636-441-8467
Comments? Questions? Please Contact Us.


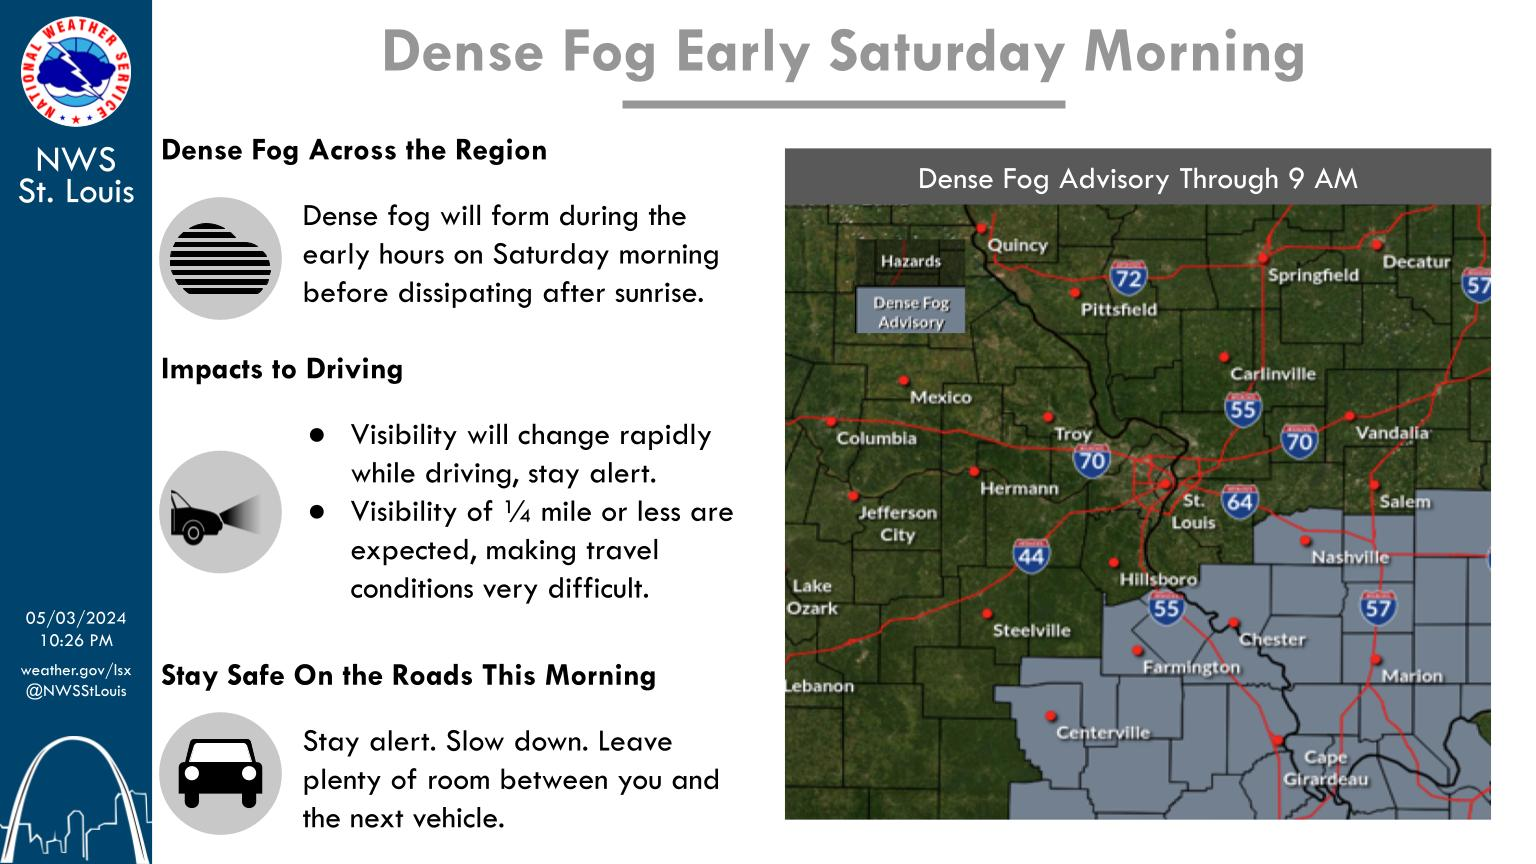 Weather Story
 Weather Map
 Local Radar