Dangerous heat will expand from the Gulf Coast into the Southern Plains and Desert Southwest through week's end. Additional extreme heat impacting the Pacific Northwest will shift to the northern Plains by the weekend. Tropical Storm Bertha is expected to continue to impact portions of the northern Gulf Coast from the western Florida Panhandle to southeastern Louisiana through tonight.
Read More >
The main weather story of 2014 was the above average precipitation which fell across much of the South Plains area. This was most welcome after three very dry years (the driest 3-year period in the record at Lubbock). The precipitation eased the drought conditions across much of the area, although we still ended 2014 with a serious ongoing drought across portions of the Rolling Plains. The early months of 2014 brought a series of dust storms, and this was a very dry period, before rain started falling in late May. Severe thunderstorms were not as numerous as we often see during the spring and summer, but a few storms still wrought havoc with large hail and high winds. Mid to late summer was a pretty quiet period, aside from a severe thunderstorm over Lubbock on August 28th, and it was beginning to look like much of the area was going to come up short on rainfall again in 2014. Then, decaying tropical Storm Odile moved up the Gulf of California and hooked east. The tropical moisture brought in by this system turned into heavy rainfall for much of the South Plains area. The heavy rain caused some flooding, but overall it provided a positive impact as area lakes and reservoirs filled up. 2014 closed out with a chilly November and a mild December, and finally some icy conditions on New Year's Eve. Below you will find more detailed information about the weather of 2014 and we hope you find the report interesting and useful. A video summary of 2014 can also be viewed HERE.
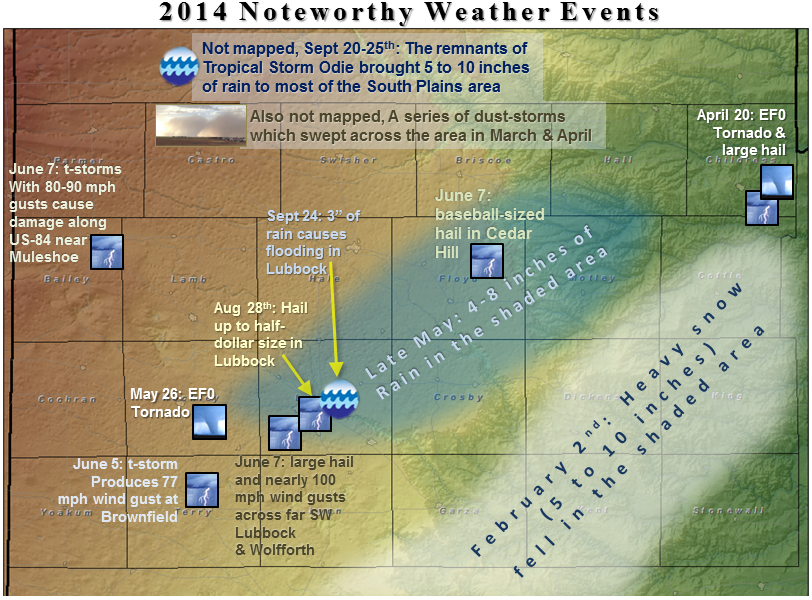
2014 Map of Significant Weather Events
The map below highlights some of the more significant weather events that occurred across the area in 2014. The year was a relatively quiet one for severe weather and only two weak tornados were confirmed in our service area. The most widespread severe weather event occurred on June 7th. Memorial Day weekend brought the most rain some areas across the South Plains had seen in quite some time. Despite the shortage of severe weather associated with thunderstorms, the area saw numerous dust storms, a few snow storms, and a tropical storm which drenched the region with heavy rain.
Map displaying many of the more notable weather impacts to the region in 2014. Click on the image to view a larger map.
Precipitation Summary
This map displays the 2014 year precipitation totals. The map was created with data gathered from the NWS Cooperative observers and the West Texas Mesonet. Click on the map to view a full-sized version.
The 2014 precipitation totals were a mixed bag. The map above shows the yearly totals that we’ve collected across the area. In an average year, precipitation ranges from about 16 inches near the New Mexico border to about 22 inches the Low Rolling Plains. In 2014, many locations on the Caprock welcomed above average rainfall of about 100 to 130 percent of the long-term average. However, surrounding this region, precipitation fell short once again at many observing stations. Much of the Rolling Plains were drier than average, along with portions of our counties that border New Mexico. The 2014 extremes for the Lubbock NWS area of responsibility ranged from 13.15 inches at the West Texas Mesonet site near Friona, to 28.51 inches in Olton.
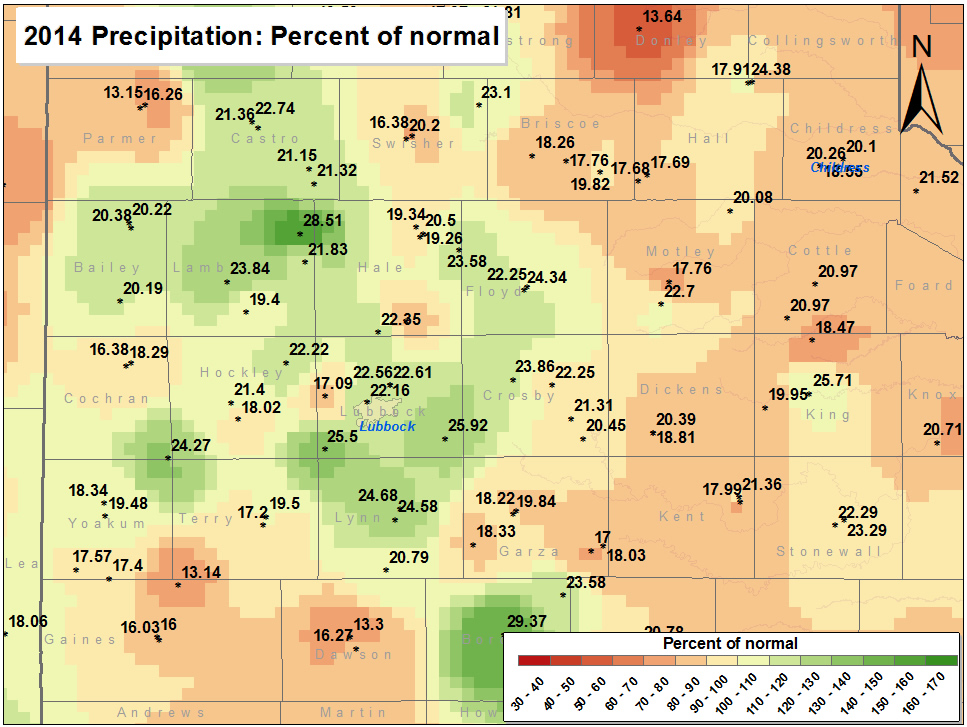
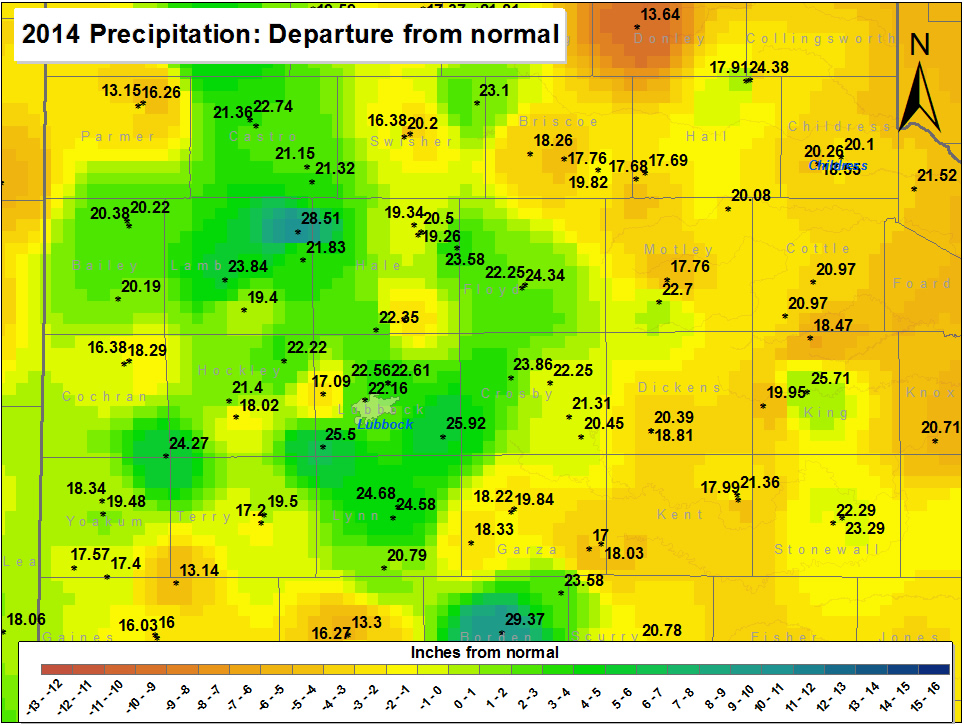
The map below shows the 2014 precipitation as a percent of the long-term average, or "normal". This image shows that much of the region east of the Caprock received somewhat below normal precipitation, in contrast to areas on the Caprock.
This map shows the 2014 rainfall as a percent of the 30-year normal rainfall (1971-2000). Also plotted is the rainfall observed, in inches, at each collection site. Please click on the map to view a full-sized version. If you would like to see the precipitation as a departure from normal please CLICK HERE.
Drought Update
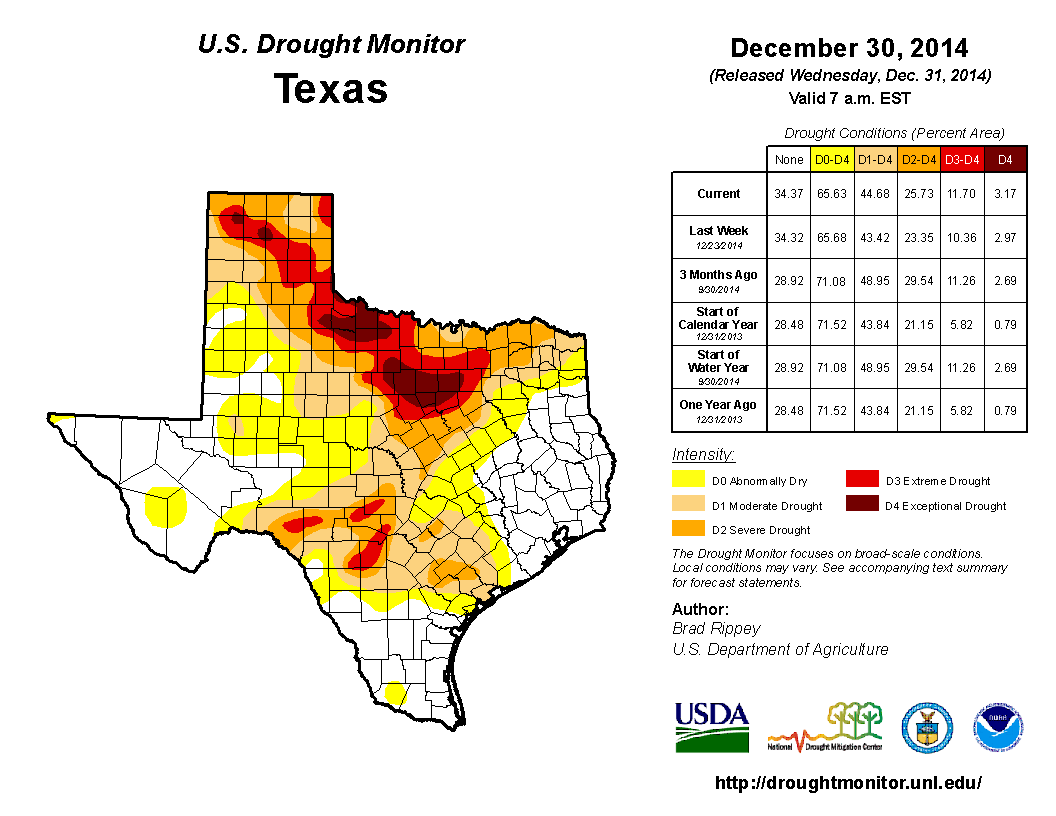
2014 started dry, with very little rain falling through the first four months of the year. The dry conditions further exacerbated the ongoing drought that has been afflicting the region since 2011. The dry weather persisted into the middle of May, when showers and thunderstorms typically become more prevalent over West Texas. This catapulted most of the Texas Panhandle, South Plains, and Rolling Plains into exceptional drought. Just when things were looking dire, a weak cold front, slow moving upper level storm system and plentiful amounts of moisture conspired to bring several rounds of much needed rain to the region over the extended Memorial Day weekend. Many locations recorded 2-4+ inches of rain over a 6 day stretch in late May, and the drought began to ease, if ever so slightly. More regular rains through the summer and fall helped the drought to further relax its grip, particularly up on the Caprock. By the end of 2014, most locations on the Caprock had no drought or were in the abnormally dry category of the drought monitor, a vast improvement from spring. This was thanks to above average yearly rainfall and a few big rains during the fall months. Off the Caprock, yearly rainfall totals were above the previous three years, but still fell a few inches short of average in many locations, so drought improvements were not as significant. Still, all but a portion of Cottle County did see improvements from the exceptional drought that was in place earlier in the year.
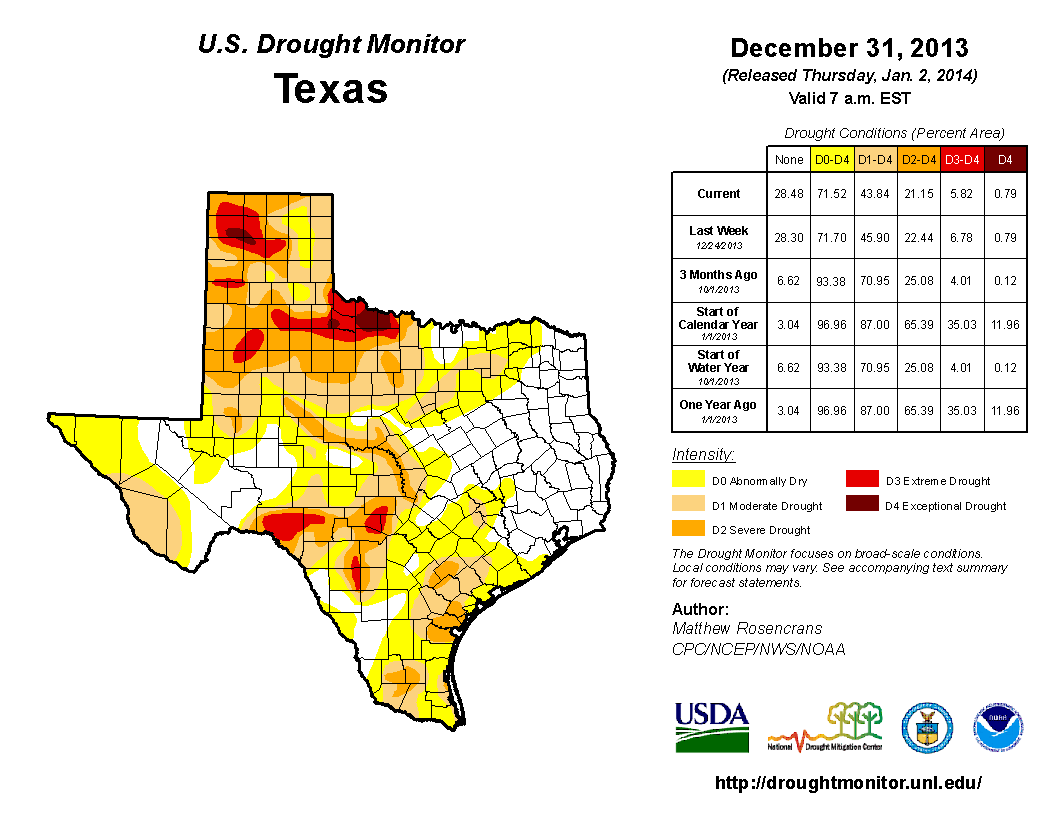
This map shows the drought conditions on December 31, 2013. Click on the map to view a full-sized version.
This map shows the drought conditions on December 30th, 2014. Click on the map to view a full-sized version.
Lubbock Statistics
2014 will go down in the books as the 40th warmest and 25th wettest on record (records began in 1911). Overall, the year appeared rather cool and wet in comparison to the last few years, which included the two hottest years on record (2011 and 2012) and the driest (2011), 9th driest (2012) and 15th driest (2013) years on record. In fact, Lubbock tallied 22.56 inches, which isn’t much under the previous three-year total of 29.90 inches. Even with this relatively wet year, the last four years (2011-2014) are still the driest consecutive four-year stretch in the record books, about an inch and a half drier than the previous record of 1953-1956.
The year didn’t start on the wet side though, with only 0.90 inches falling over the course of the first four months. The dry beginning of the year further intensified the drought with exceptional drought enveloping most of the region by the end of April. The trends were not good into the first half of May, with moisture very difficult to come by. Thankfully, this changed late in the month as several rounds of showers and thunderstorms brought much needed rain to the South Plains region over the Memorial Day weekend. Many spots recorded 2-4 inches, with localized 6+ inch totals from May 21st through the 26th. This wet period helped put a dent in the ongoing drought and fell at a critical time for farmers. The rainfall then continued thereafter at a more regular interval, helping the annual rainfall keep pace with the 30-year normal. A very wet late September and early November then ensured the year would end with above average rainfall for the first time since 2010.
The hottest temperature of 2014 was 104 degrees, recorded on September 4th. Lubbock reached or exceeded the 100 degree mark on 11 occasions, which was near the long-term average of 10 days. One the other side of the pendulum, the coldest temperature of the year was 6 degrees, experienced on 6th of January. Five record highs were tied or set in 2014: 87 degrees on February 15th; 100 degrees on August 31st; 104 degrees on September 1st; 91 degrees on October 26th; and 80 degrees on November 29th. Three record lows were also tied or set in 2014: 6 degrees on January 28th; 25 degrees on April 15th; and 19 degrees on November 12th.
LUBBOCK
Average High
Average Low
Precip (inches)
January
57.5
22.3
0.00
February
57.4
27.6
0.16
March
68.3
33.0
0.17
April
77.0
44.7
0.57
May
85.1
55.4
5.23
June
90.7
66.0
2.59
July
90.1
67.9
2.64
August
94.6
67.1
0.54
September
80.4
62.6
6.94
October
78.2
48.7
0.38
November
60.8
32.2
2.95
December
54.8
32.3
0.39
Annual
74.7 (38th warmest)
46.8 (40th warmest)
22.56 (25th wettest)
Normal
74.3
47.0
19.12
Departure
+0.4
-0.2
+3.44
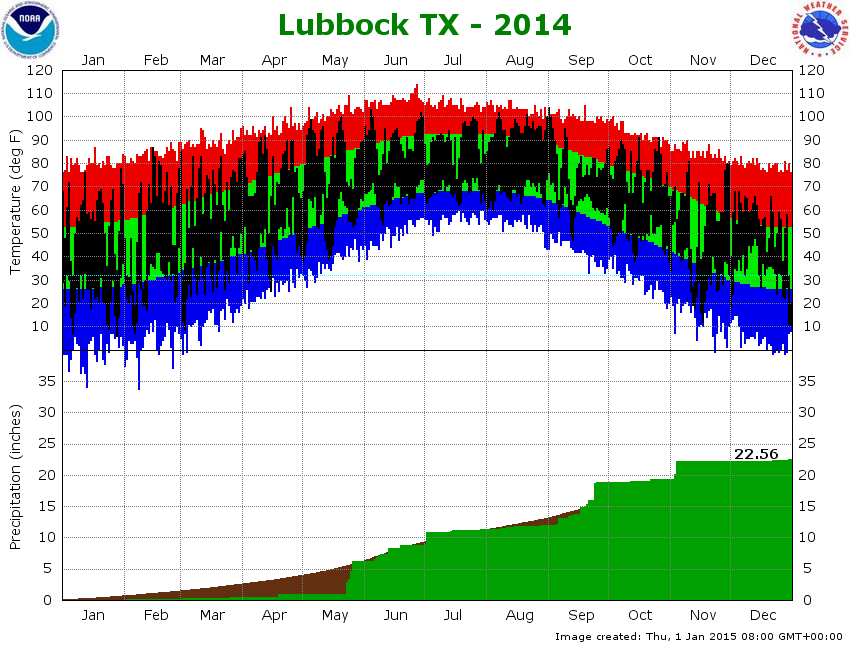
The top portion of the below graph shows the daily high and low temperature distribution for 2014 at Lubbock Preston Smith International Airport. A large portion of the year saw temperature near to above average, with a few pockets of below average temperatures. The hottest temperatures, as is typical, occurred during May, June, July and August.
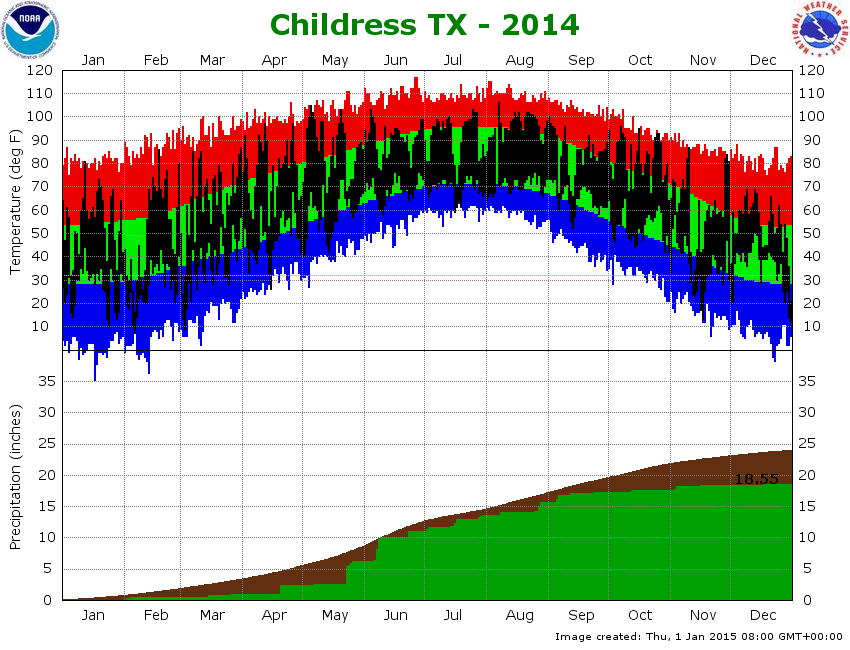
(Top) Plot of the maximum and minimum temperatures (connected by a black line) observed at the Lubbock Preston Smith International Airport in 2014. Also plotted are the respective normals (green - range of average highs and lows) and record highs (red) and record lows (blue) for each date. Units are in degrees Fahrenheit. (Bottom) Plot of the rain accumulation (green), in inches, observed at the Lubbock Preston Smith International Airport in 2014. Also plotted is the distribution of the average rainfall (brown). Click on the graph for a larger view. Click HERE to view the graph for Childress.
The lower portion of the above graph shows that after an extremely dry start to 2014 several rounds of late May rains boosted rain totals to near average. Rainfall was then more regular through the remainder of the spring and into early summer before becoming spotty and generally lighter through late summer. The Lubbock rain totals fell below the long-term average during August, but an extremely wet second half of September righted the ship, boosting the annual rainfall back above average for the remainder of the year. The final rain tally was further bolstered by a heavy rain event in early November and a few light wintry events to close out December. The wettest day of the year was September 24th when 2.72 inches fell. Then next wettest day was November 4th when 2.01 inches fell. A total of 7 days saw an inch or more of rain, including May 23rd (1.89 inches), May 25th (1.22 inches) and May 26th (1.60 inches). The final rain total of 22.56 inches finished as the wettest year on record in Lubbock since 2010 (26.46 inches) and the 24th wettest year on record. 2014 was also sixth time the Lubbock airport has recorded 20 inches or more in a year since the turn of the century.
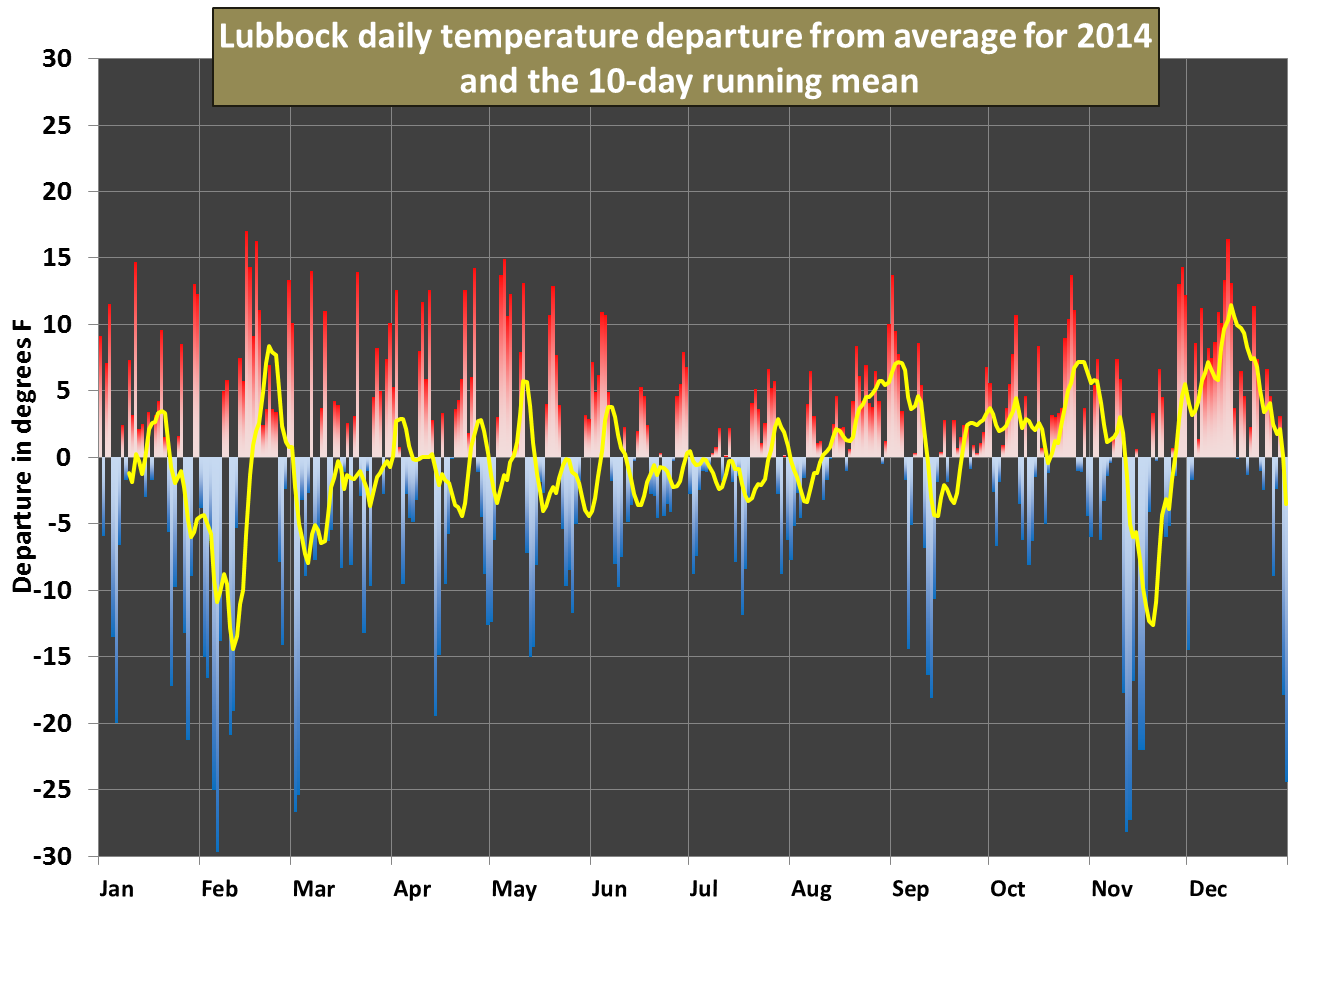
The graph above shows the 2014 average daily temperature and 10-day running mean (black line) at Lubbock as a departure from the 1981-2010 normals. Click on the graph for a larger view.
The above graph displays the daily (and 10-day running mean) temperature departure from normal. Lubbock saw a pronounced cold snap in early February, and another in the middle of November. The coldest temperature at Lubbock in 2014 was 6 degrees on the morning of January 6th. The second coldest reading was 7 degrees, reported on the morning of February 7th. Another brief, but severe cold snap occurred on March 2nd and 3rd; the temperature on the morning of the 3rd dipped to 9 degrees. Warm spells included mid to late February and much of December. Lubbock reached 104 degrees on September 1st, which shattered the old record for the date and was the warmest temperature Lubbock saw in 2014. Otherwise, temperatures went up and down at fairly regular intervals with not many extremes. Overall, the average temperature at Lubbock for the entire year ended up just slightly above the long-term average
2014 Monthly Highlights
JANUARY:
1-31st: The drought continued with little to no precipitation falling all month over the entire region. Temperatures averaged below normal for the month.
FEBRUARY:
1-2nd: A winter storm brought widespread snow to West Texas. Locations from Post to Spur to Paducah experienced the most intense band of snow, accompanied by thunder and lightning too! Many locations received between a dusting and 3 inches of snow, but those in the heaviest band had a quick 6-10+ inches. To read a more complete summary CLICK HERE. 5-6th: A swath of snow fell across the southern Texas Panhandle, with many locations picking up 1-2 inches. The big winner was Friona tallying 2.7 inches. 28th:A quick moving storm system brought strong winds and blowing dust. Winds generally peaked at 40-50 mph, though the Graham West Texas Mesonet site did record a gust to 59 mph. To read a more on the windy/dusty day CLICK HERE.
MARCH:
2nd: After a warm start to the month, a strong cold front combine with an upper level storm system to bring very cold temperatures and a light wintry mix to the region. Littlefield recorded 1/2 inch of sleet and Muleshoe had 1.5 inches of snow, though most spots saw much less. Temperatures by the following morning fell into the single digits. Read more about this cold and wintry start to March HERE. 11th: A passing upper level storm system brought a couple of bouts of strong winds and blowing dust. Gusty westerly winds visited the South Plains region during the day. After a brief lull in the winds, a cold front blasted through with strong north winds and a haboob. Read more about the rounds of wind and dust HERE. 18th: A week to the day brought another couple of rounds of wind and blowing dust to the South Plains. A detailed summary of this wind and event can be FOUND HERE.
APRIL:
3rd: Another round of wind and blowing dust visited West Texas. A detailed summary can be READ HERE. 19-20th: A slow moving upper level storm system helped produced scattered thunderstorms over the weekend, a few of which were severe. One particularly strong storm did generate a brief tornado over open land in eastern Childress County on the evening of the 20th, while golf ball to baseball sized hail was reported in and around the town of Childress with a couple of subsequent storms. Learn more about this severe thunderstorm event HERE. 27-29th: A powerful and slow moving storm system brought three days of strong winds and blowing dust, punctuating the frustratingly dry start to 2014. A summary of this dark stretch of weather is AVAILABLE HERE. The dry winter and spring allowed the exceptional drought to expand to encompass much of the South Plains, Rolling Plains and southern Texas Panhandle by the end of the month.
MAY:
14th:A strong cold front led to a late-season light freeze over the far southwest Texas Panhandle and northwest South Plains. No widespread damage to crops was reported. 21-26th: Several rounds of thunderstorms dropped much needed rainfall in the region. A few of these storms did become severe and produce generally minor flooding issues, but the overall outcome was very positive. Most locations recorded from 2-6+ inches over the 6-day stretch that spanned the Memorial Day weekend. The rains help ease the short-term drought, though reservoirs only saw slight improvements. Read more about these welcome rains HERE.
JUNE:
5-8th: More typical spring-like weather impacted the South Plains, with several rounds of severe thunderstorms. The severe weather peaked on the evening of the 7th, when widespread strong to severe thunderstorms roamed the South Plains region. Baseball size hail fell near Sundown causing significant property damage. In addition, a wind gust to 96 mph was measured with one storm as it moved by to the southwest of Wolfforth during the late evening hours. To read more on this active stretch of weather CLICK HERE. 13th: A squall line raced across the region supplying gusty winds, frequent lightning, pockets of small hail and widespread rain during the evening hours of Friday the 13th. Although generally below severe limits, the squall line did produce a wind gust of 58 mph near Friona early, with a gust to 62 mph measured late in the night when the line moved through Aspermont. Read more about this active night HERE. 17-25th: A number of rounds of thunderstorms affected West Texas. The most widespread activity moved through late on 22nd into early on the 23rd as a complex of thunderstorms sagged southeastward out of the Texas Panhandle and brought strong to severe winds, but welcome rains. Over the course of week plus, rain totals of 1-2+ inches were common. To learn more about this active stretch of weather CLICK HERE.
JULY:
16-17th: Thunderstorms congealed into a complex across the northern Texas Panhandle on the evening of the 16th before rolling southeast across much of the southern Texas Panhandle and Rolling Plains into early on the 17th. Many locations east of a Friona to Lubbock to Jayton line received a quick 1-2+ inches of rain. In addition, a cold front dropped temperatures down into the 60s and 70s on the 17th. Read more about this mid-summer round of rain HERE.
AUGUST:
28th: Scattered severe thunderstorms erupted over the South Plains and eastern Texas Panhandle during the afternoon before moving eastward through the evening. One storm developed directly over Lubbock, producing heavy rain and street flooding, while wind and hail shredded trees and caused minor damage on the south side of the city. A full write-up on this event can be accessed HERE.
SEPTEMBER:
5-7th: A strong early September cold front brought cool temperatures and widespread rainfall. Much of the region saw 1-2+ inches over the three day weekend, while highs on the 6th only made it into the 60s. Learn more about this cool and damp weekend HERE. 11-12th: A couple of rounds of showers and thunderstorms brought locally heavy rain. Locations along and south of a Sudan to Lubbock to Guthrie line recorded rain totals of 1-2+ inches. In addition, another strong cold front dropped afternoon temperatures into the 40s and 50s on the 12th. A detailed summary can be FOUND HERE. 14-24th: The remnants of Tropical Storm Odile contributed to many rounds of heavy rainfall for West Texas and southeast New Mexico through the middle of September. The heaviest rain visited different locations on different days, but when all was said and done many spots had tallied 2.5 to over 6 inches of new rainfall. The heavy rain did cause some flooding, but also helped put much needed water in reservoirs. Read more about this very wet fall stretch HERE.
OCTOBER:
1-31st: After the wet September, October was on the dry side with temperatures averaging 2-4+ degrees above normal. Monthly rainfall totals were mostly under an inch, with many locations recording a half inch or less.
NOVEMBER:
3-4th: A large shield of rain and embedded thunderstorms developed on the evening of the 3rd and moved slowly eastward across the South Plains and Rolling Plains through the morning of the 4th. This made for a cool and raw Election Day as temperatures held steady in the 40s through the day of the 4th. Rain totals of 1-2 inches were common. A complete summary of this cool and wet start to November can be FOUND HERE. 10-13th: A very strong cold front moved through during the evening of the 10th bringing the first widespread hard freeze of the season. Temperatures dropped from the upper 70s and 80s during the afternoon of the 10th to the 20s by the next morning. The cold temperatures persisted and for a few days, with a few flurries even mixing on the Caprock early on the 13th. More on cold snap can be READ HERE. 16th: Another shot of cold air, this time accompanied by an upper level disturbance, brought the first accumulating snow of the season. Snow totals around an inch were common, but when coupled a little freezing drizzle and temperatures only in the teens and 20s, it did create some travel problems. A thorough summary of this event can be FOUND HERE.
DECEMBER:
23rd: A storm system dropped out of the southern Rockies and across West Texas two days before Christmas. Fortunately, temperatures remained near or just above freezing and limited snowfall to just some isolated areas near the Texas and New Mexico state line. Some of the rainfall amounts reported from this storm include: .25 inches at Aspermont, .19 at Denver City, .15 in south Lubbock, and .10 in Jayton.
27th: A cold front and upper-level storm system passed through the area and brought spotty snowfall of one to two inches to parts of the South Plains and Rolling Plains. Details on this event can be ACCESSED HERE.
30-31st: The end of 2014 into the beginning of 2015 brought a prolonged period of cold temperatures, several rounds of freezing drizzle and freezing rain, and a couple of bouts of snow. The wintry weather did make for nice holiday pictures, but also created hazardous travel. Read more on this extended cold and wintry stretch HERE.


 The main weather story of 2014 was the above average precipitation which fell across much of the South Plains area. This was most welcome after three very dry years (the driest 3-year period in the record at Lubbock). The precipitation eased the drought conditions across much of the area, although we still ended 2014 with a serious ongoing drought across portions of the Rolling Plains. The early months of 2014 brought a series of dust storms, and this was a very dry period, before rain started falling in late May. Severe thunderstorms were not as numerous as we often see during the spring and summer, but a few storms still wrought havoc with large hail and high winds. Mid to late summer was a pretty quiet period, aside from a severe thunderstorm over Lubbock on August 28th, and it was beginning to look like much of the area was going to come up short on rainfall again in 2014. Then, decaying tropical Storm Odile moved up the Gulf of California and hooked east. The tropical moisture brought in by this system turned into heavy rainfall for much of the South Plains area. The heavy rain caused some flooding, but overall it provided a positive impact as area lakes and reservoirs filled up. 2014 closed out with a chilly November and a mild December, and finally some icy conditions on New Year's Eve. Below you will find more detailed information about the weather of 2014 and we hope you find the report interesting and useful. A video summary of 2014 can also be viewed
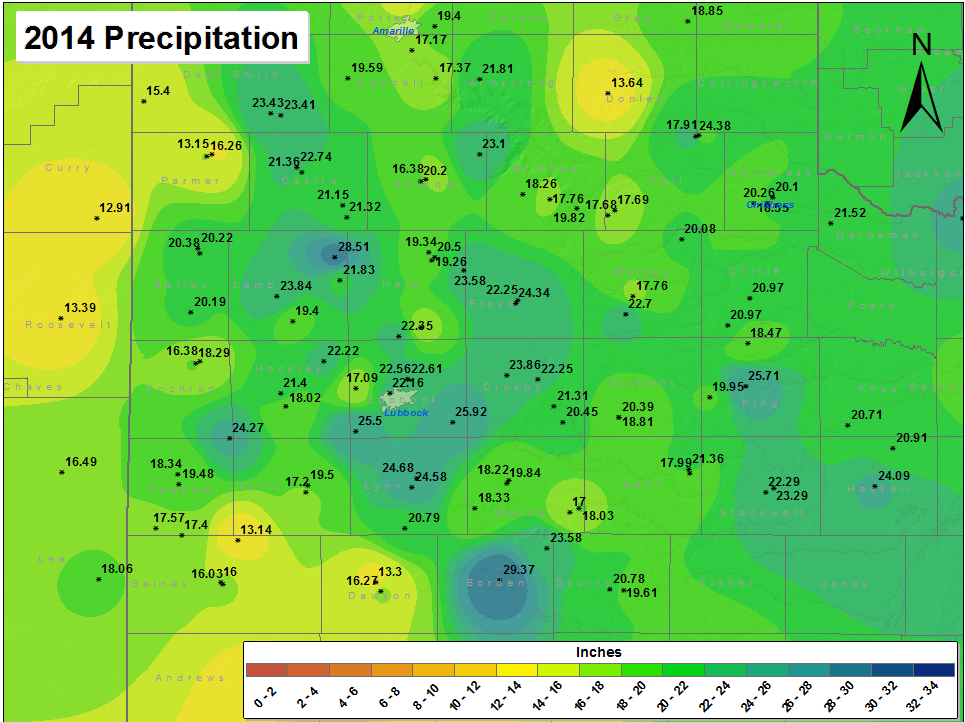