
 The main weather themes of 2023 were the exceptionally hot and dry summer, widespread and heavy rainfall from mid-May to early June, and return of periodic significant rainfall in the fall and early winter. The most impactful event of the year was an intense tornado that struck the west side of Matador the evening of June 21st, killing 4 people and injuring 15 others. The year ended as the warmest on record at Lubbock (and globally), finishing with an average yearly temperature of 63.6°F, 0.1°F above the previous record set in 2012 and a full 1.2°F above the 1991-2020 30-year average of 61.4°F. Precipitation was difficult to come by the first four and a half months, was plentiful from mid-May to early June, then returned in the fall after a very hot and dry mid-late summer. The year ended with most of West Texas free of drought. In total, 17.61 inches of precipitation fell at Lubbock during 2023, which finishes exactly in the middle of the historical records (57th wettest and 57th driest). The main weather themes of 2023 were the exceptionally hot and dry summer, widespread and heavy rainfall from mid-May to early June, and return of periodic significant rainfall in the fall and early winter. The most impactful event of the year was an intense tornado that struck the west side of Matador the evening of June 21st, killing 4 people and injuring 15 others. The year ended as the warmest on record at Lubbock (and globally), finishing with an average yearly temperature of 63.6°F, 0.1°F above the previous record set in 2012 and a full 1.2°F above the 1991-2020 30-year average of 61.4°F. Precipitation was difficult to come by the first four and a half months, was plentiful from mid-May to early June, then returned in the fall after a very hot and dry mid-late summer. The year ended with most of West Texas free of drought. In total, 17.61 inches of precipitation fell at Lubbock during 2023, which finishes exactly in the middle of the historical records (57th wettest and 57th driest).The graphic below highlights some of the more significant weather events that occurred across the area in 2023. The year started on the mild and quiet side for the first half of January. A powerful storm system ended that, bringing colder and a quick shot of snow to the region January 24th. Lubbock recorded its only measurable snow of the year, officially tallying an impressive 7.2 inches. Matador and Plainview were hit even harder, reporting 11 and 9 inches, respectively. The rest of the winter and early spring didn't bring much precipitation, but it did provide several rounds of wind and blowing dust. The most extreme of the dust storms occurred on February 26, when widespread wind gusts of 60 to 80 mph caused brownout conditions. A peak wind gust of 114 mph was measured near Memphis as a squall line moved through and locally enhanced the wind. A couple of supercell thunderstorms brought huge hail, bigger than baseballs, to Dickens, as well as a 90 mph wind gust near McAdoo on April 25th. Mid-late May into early June brought rounds of widespread heavy rain to West Texas. O'Donnell was particularly hard hit, measuring over 7 inches of rain, most of which fell in a 2-hour period the morning of June 1st. The torrential rain inundated US Highway 87, which remained closed for around a week before the water could be pumped of the roadway sufficiently. The weather turned hot by mid-June, and this energy fueled intense thunderstorms late in the month, including one storm that generated a devasting tornado that tore through the west side of Matador on June 21st. A couple of days later, additional rotating storms generated grapefruit size hail on the southwest side of Lubbock. The main theme the remainder of the summer into early fall was the heat and intensifying drought. Numerous afternoons reached the triple digits, with several days hitting 105-110+ degrees. Mid-September finally provided welcome relief from the heat, accompanied by several rounds of thunderstorms and heavy rain. The intense rain caused flooding over parts of Lubbock, Ransom Canyon and Slaton in mid-September, then again in early October. Late October brought more rain to the region, concentrated over the central and southern Rolling Plains, as well as a powerful cold front. November was fairly tranquil and dry, while 2024 closed out the year with a couple of impressive rounds of cold rain. Rainfall amounts of two to five inches fell off the Caprock between December 12th and 14th. A round of thunderstorms to kick off Christmas Weekend on December 23rd, followed by dry and mild conditions to conclude 2023.
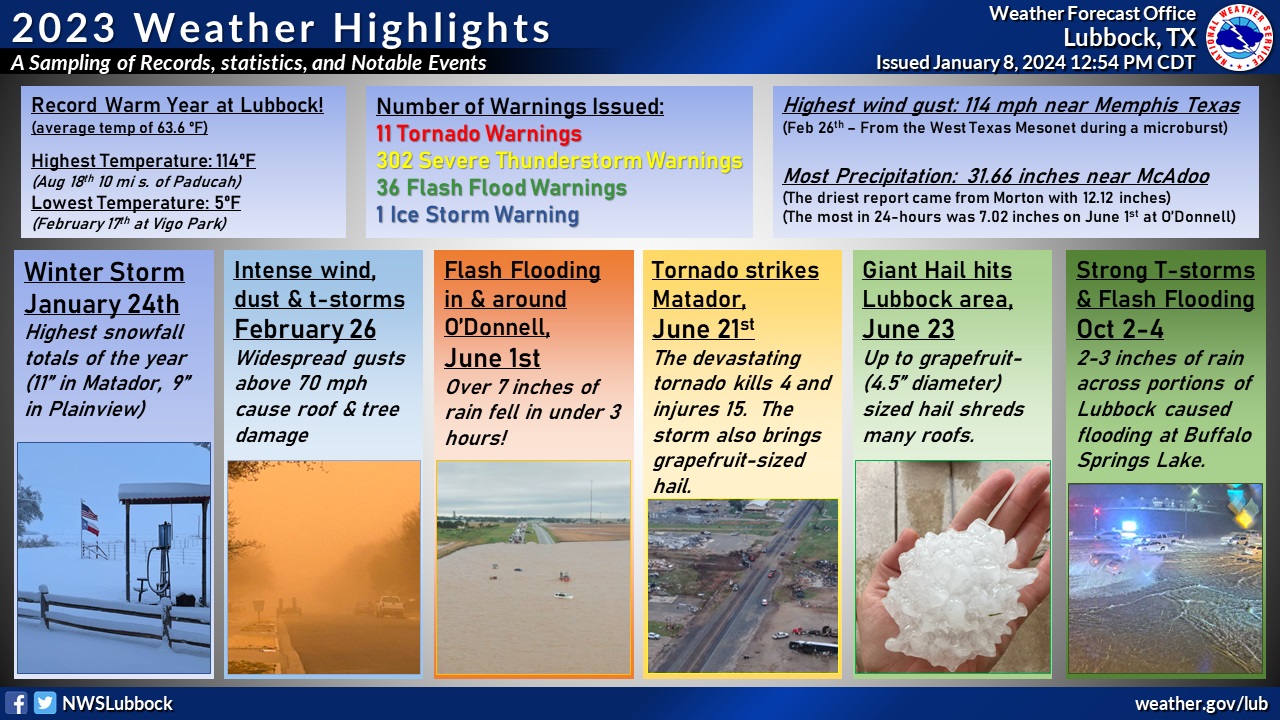 Notable weather impacts to the region in 2023. Note that this is just a sampling of events, many more have been omitted due to space constraints.
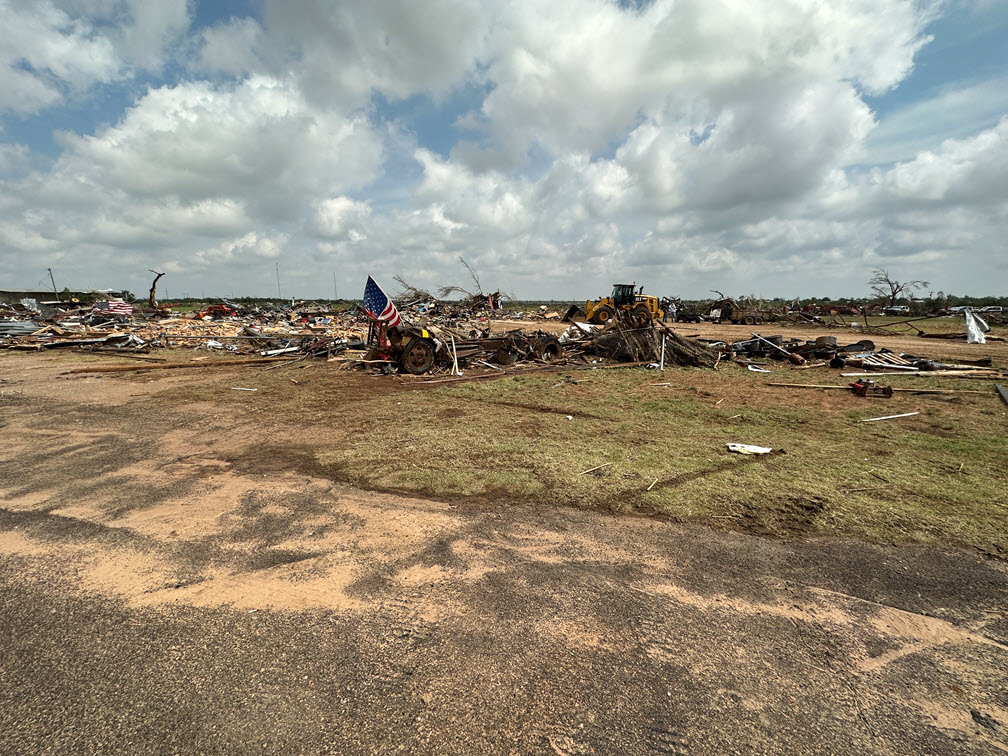
A total of 9 supercell tornadoes were observed in the Lubbock 24-county service area in 2023, half of the long-term average of 18. Five of the 9 tornadoes occurred on June 21st, when a supercell tracked south-southeast through the western Rolling Plains. The most intense and long-lived of the tornadoes formed 2.2 miles northeast of White Flat, tracked southward near Highway 70, cut a path across western Matador, before dissipating 2.1 miles south of Matador. The tornado was on the ground over 9 miles, lasted for 18 minutes, and was as wide as 600 yards at its peak. Tragically, the tornado killed 4 people, injured 15 more, and inflicted severe damage to numerous structures on the west edge of Matador. The tornado destroyed three homes, a steel framed retail store, a restaurant, a 500 foot radio tower, and several vehicles, and damaged numerous other homes and property. The four people that lost their life from this tornado included a tractor-trailer driver and two people in a RV located immediately west of the intersection of State Highway 70 and US Highway 62. The fourth death occurred farther to the south where a home was completely destroyed. The tornado was given a rating of EF3, with damage consistent with peak wind gusts of 145 mph to 166 mph. Thankfully, the other 4 tornadoes on June 21st were short-lived and over open land and inflicted no documented damage. The other tornadoes observed in 2023 were brief an caused no known damage. They include a brief touchdown west of Dougherty on April 25th; a short-lived tornado northwest of Plains on May 27th; a brief tornado southwest of Vigo Park on May 28th; and a small tornado south of Aspermont on June 17th. In addition to the supercell tornadoes, a landspout tornado was observed near Lariat on May April 13th. As is typical with landspout tornadoes, this tornado was short-lived, moved very little and did no known damage.
|
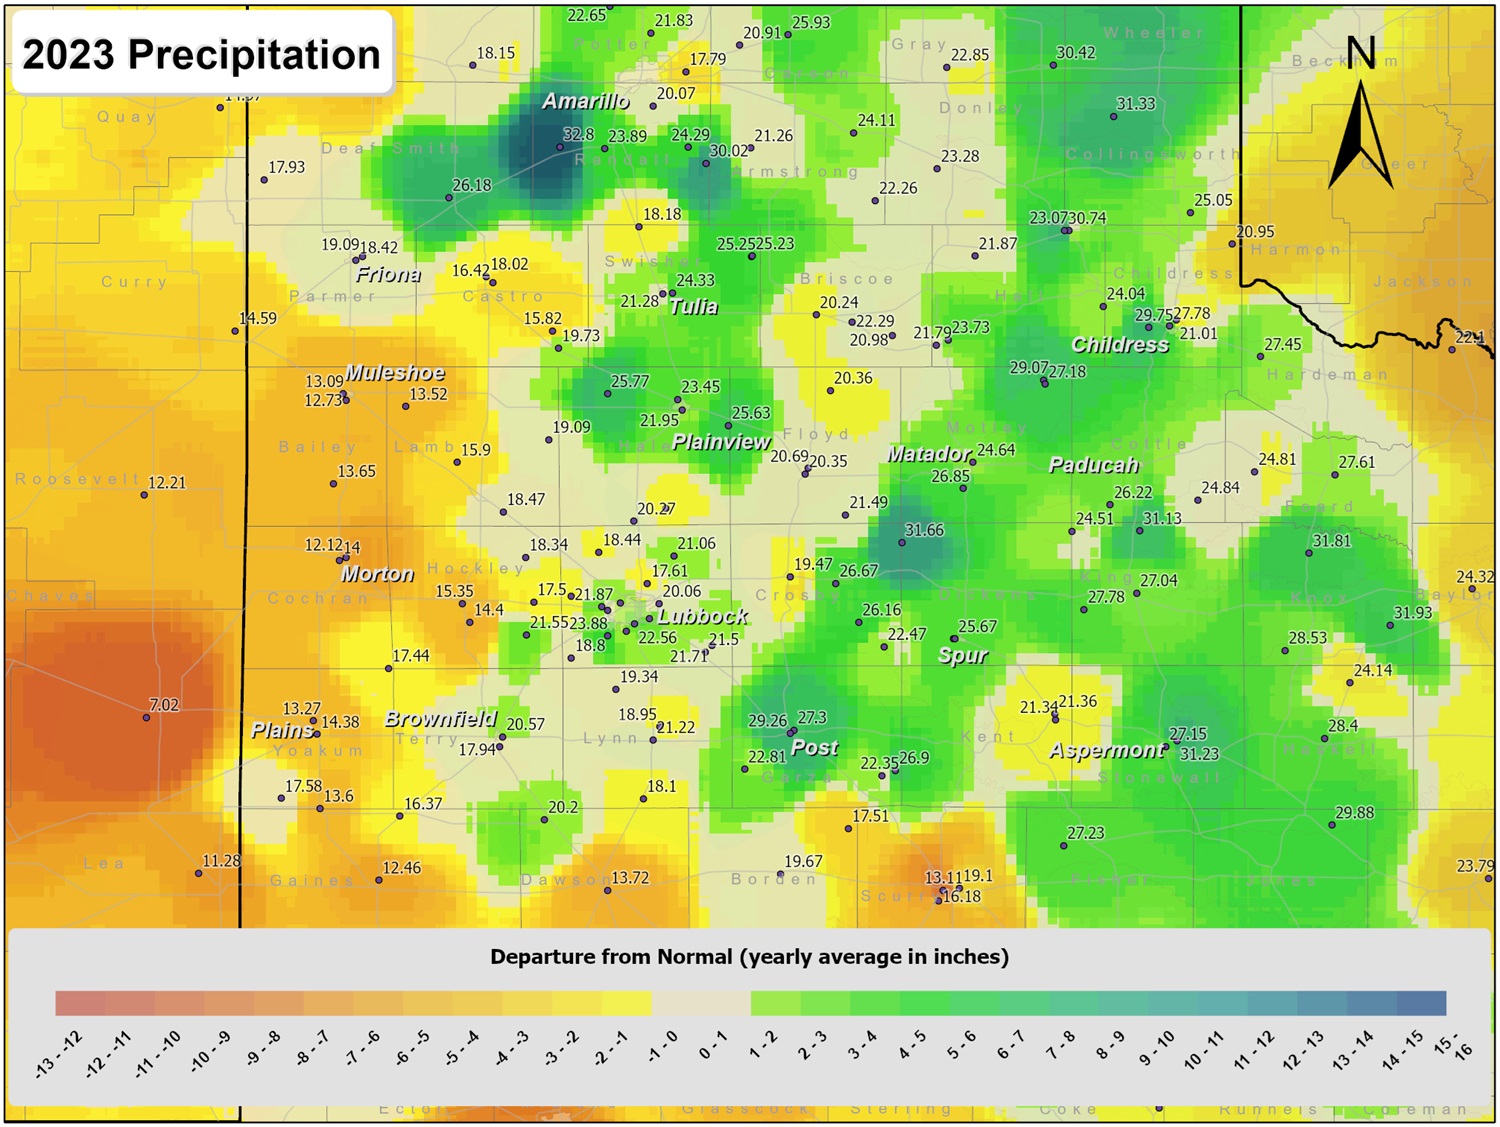
Precipitation in 2023 came in fits and starts, with the bulk of the precipitation falling in late May and early June and then again in the fall. Many locations from the central South Plains then to the north and east recorded annual totals near or in excess of 20 inches. The driest conditions, from 12 to 15 inches, were common over the western South Plains, including in and around Muleshoe, Morton, Plains and Denver City. A little further west, near Dora, NM, the West Texas Mesonet (WTM) recorded a meager 7.02 inches for the entire year. The heaviest rainfall, in excess of 30 inches, was measured in several locations scattered across the southern Texas Panhandle into the Rolling Plains. The WTM site near Umbarger measured an impressive 32.80 inches, with nearly 20 of those inches falling in May in June. The intense rain filled Buffalo Lake, within the National Wildlife Refuge, for the first time in many years. A few other locations that topped the 30 inch mark in 2023 including the WTM sites near McAdoo, Grow and Canyon.
Lubbock International Airport officially recorded 17.61 inches of precipitation, 0.72 inches below the long-term average of 18.33 inches, or about 96% of average. This was a little lower than many locations within the city of Lubbock, where 20 to 24 inches of rain was common. The map below shows the 2023 precipitation as a percent of the long-term average or "normal". This image shows the driest region (60-80% of average) favored much of the western South Plains and portions of the southwest Texas Panhandle. Much of the remainder of the South Plains into the Rolling Plains had annual totals near or above normal.
|
|
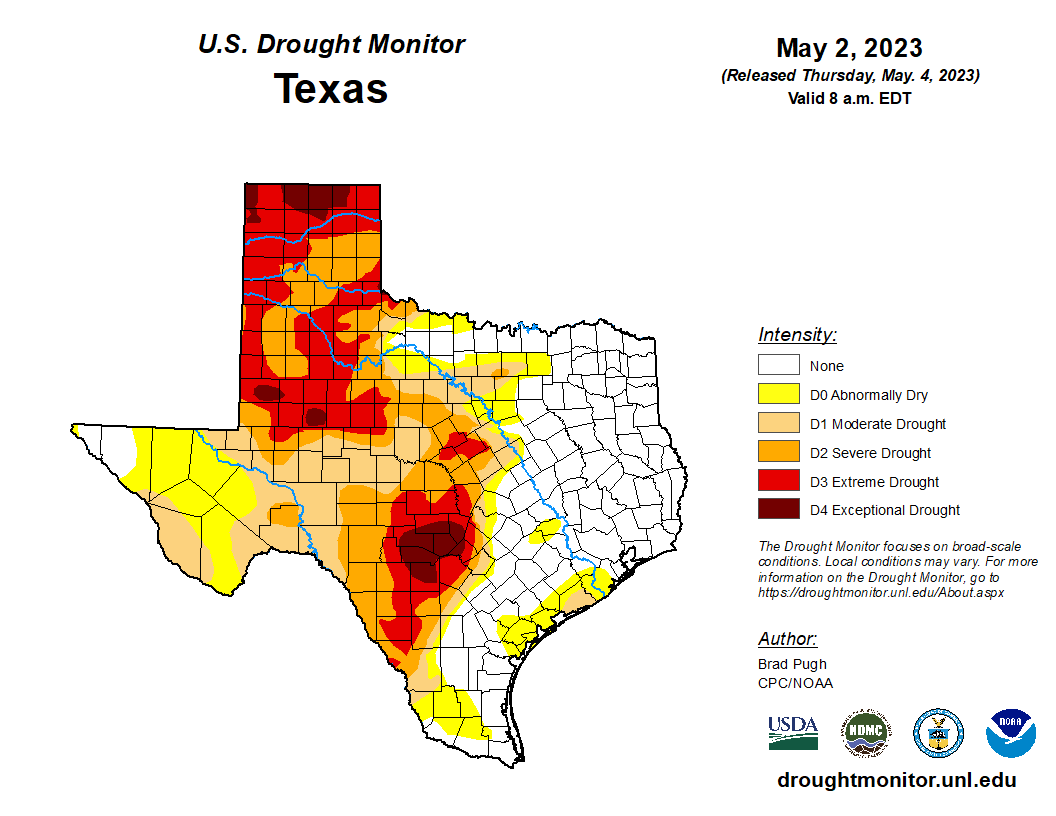
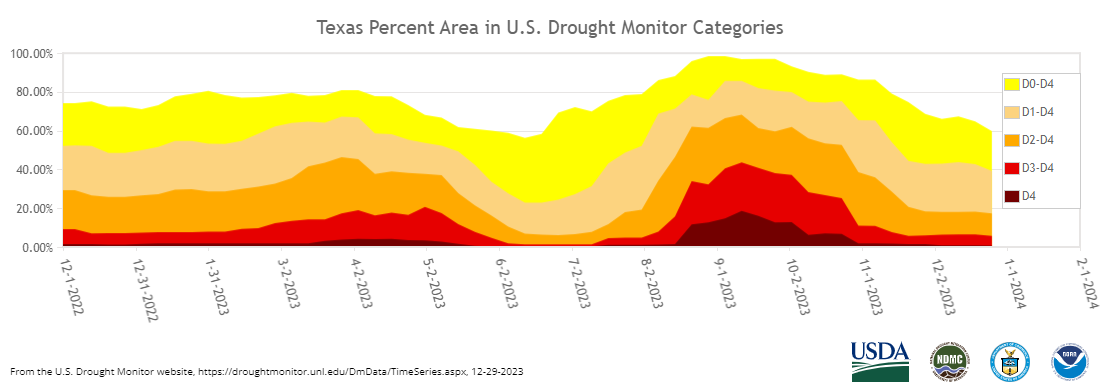
The year began with moderate to severe drought in place over much of the region, even pockets of extreme drought over portions of the southwest Texas Panhandle and the Rolling Plains. The drought intensified through early May as precipitation deficits climbed. Widespread rain, in the form of numerous rounds of showers and thunderstorms, provided significant drought relief through early summer. In fact, the drought was almost entirely extinguished by mid-June. However, that is when the widespread and regular precipitation ceased and temperatures shot up. The result was the return of moderate to severe drought for a good chunk of the South Plains region late summer into early fall. conditions. Improvement followed for all but the southwest Texas Panhandle to close out the year as several rain events targeted much of the South and Rolling Plains.
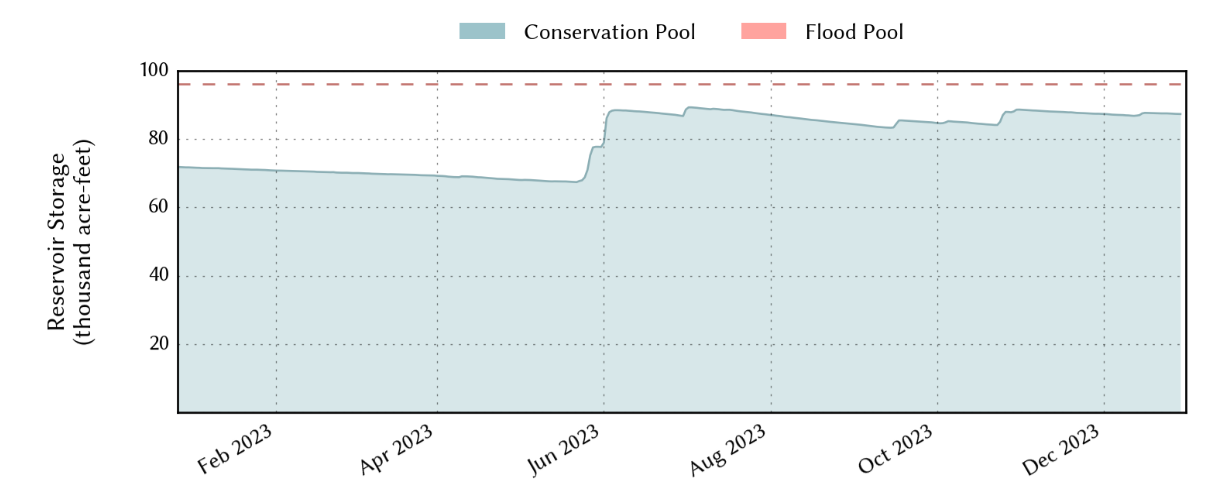
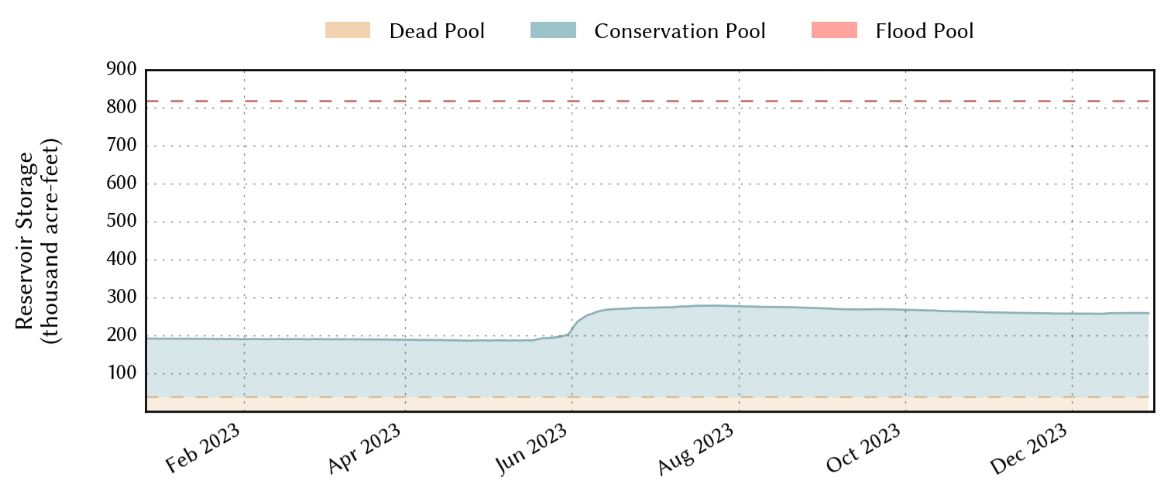
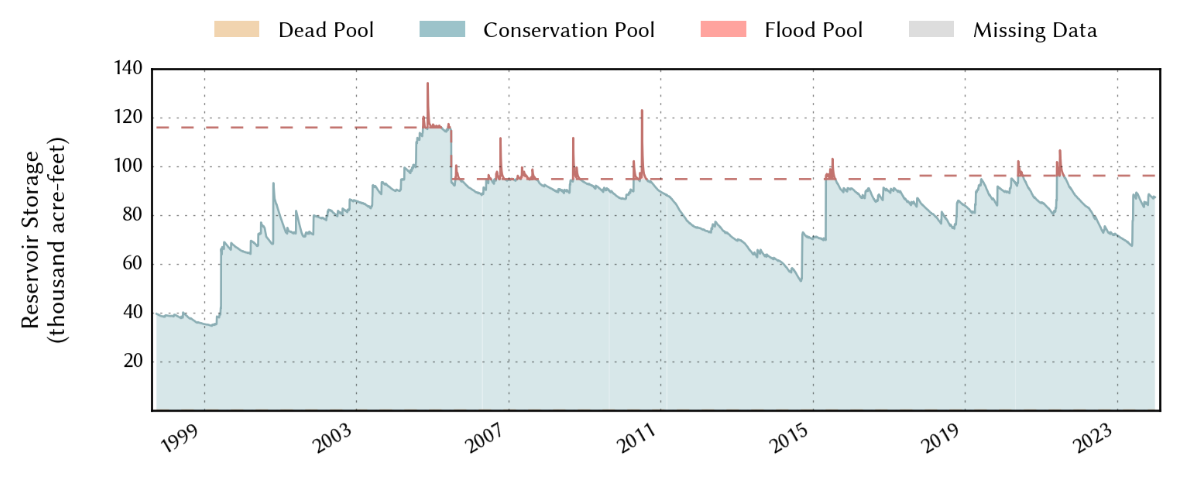
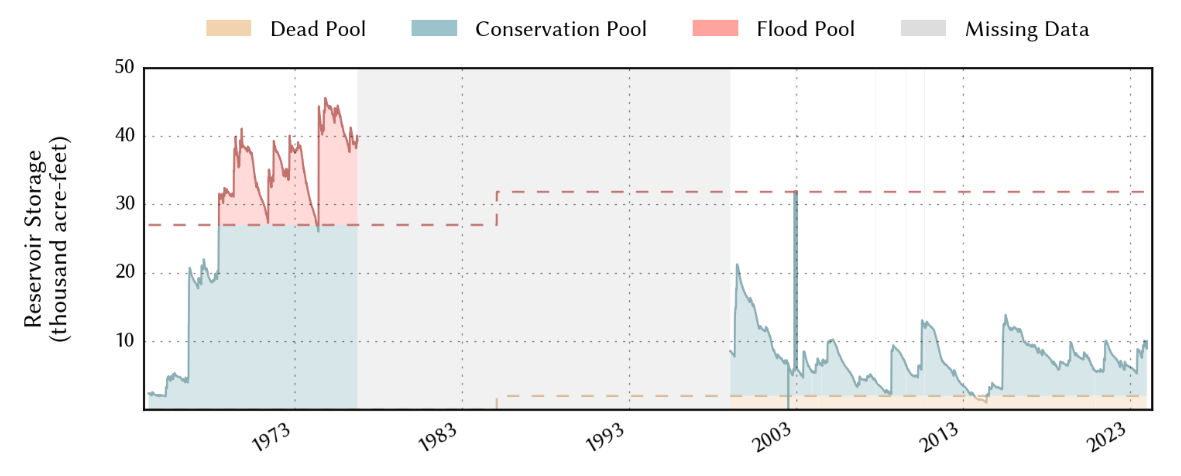
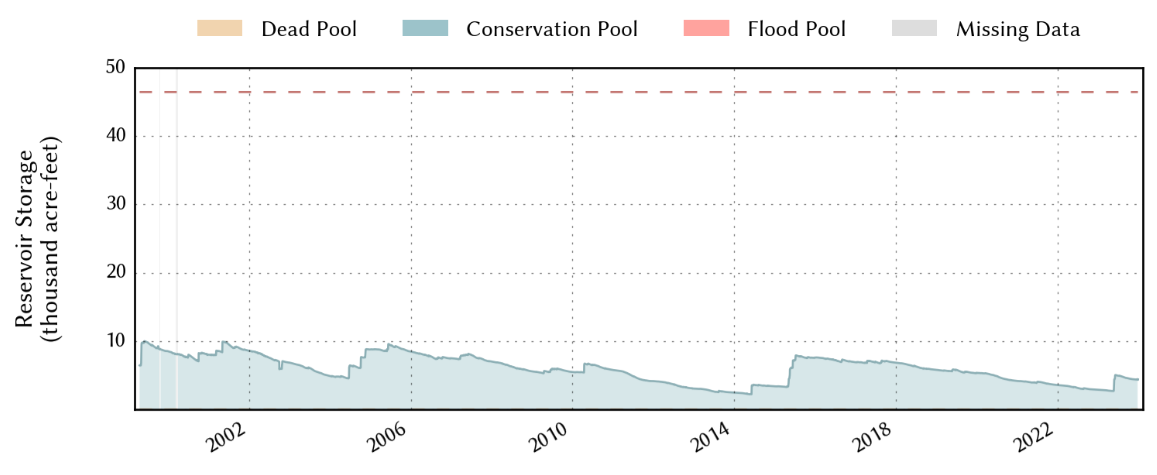
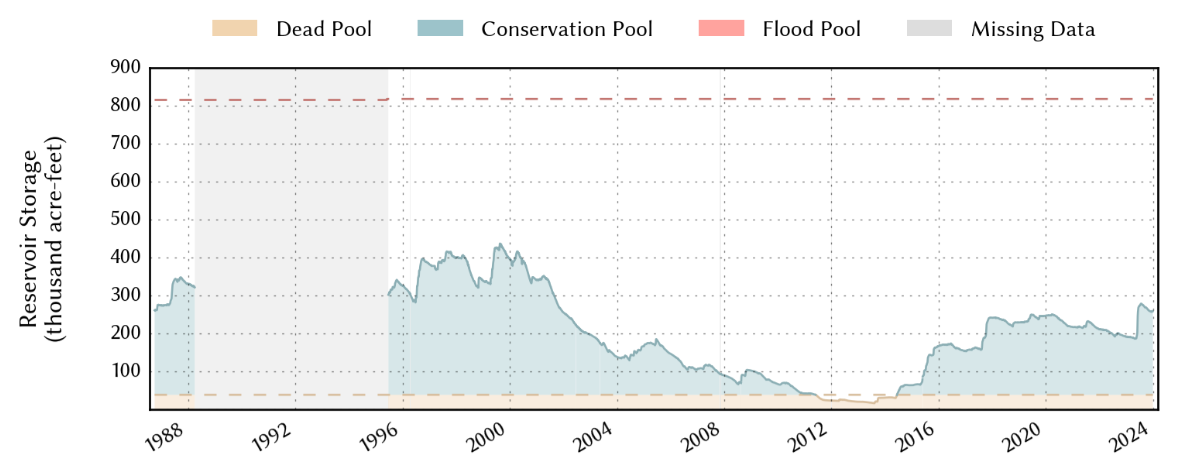
Area reservoir levels fell through the late winter and early spring, as precipitation was fleeting. A brief, but robust shot of convective rainfall in late May and early June lifted lake levels significantly. Thereafter, a general downward trend, with periodic small improvements, were the theme from the sporadic, but occasionally heavy downpours through the fall. Over the course of 2023 Lake Meredith (from 31% to 44%), Lake Alan Henry (from 75% to 91%), White River Lake (from 14% to 27%) and Lake Mackenzie (from 6% to 9%) all measured net increases in their conservation levels.
|
||||||||||||||||||||
|
2023 will go down in the books as the warmest and 57th wettest (also 57th driest, depending on your perspective) year since records began in 1911 at Lubbock. The mean monthly temperatures were warmer than average for 10 of the 12 months, which isn't surprising for a record warm year. The only two months that were cooler than average were April (-0.9°F) and May (-0.1°F). The warmest months, with respect to average, were September (+6.3°F) and August (+5.6°F).
Precipitation was close to average over the course of the entire year, but was not distributed evenly. Outside of one widespread snow event in late January, the first four months of the year were quite dry. Early May brought sporadic rainfall, in advance of multiple rounds of showers and thunderstorm during the middle to later part of the month. The wet pattern continued into early June, but abruptly halted and turned hotter. The heat and dearth of regular precipitation took hold through much of the summer, from mid-June through early September, when the mercury regularly reached the triple digits. Rain and cooler temperatures finally return in mid-September. The wettest month of the year, by a long shot, was May when 5.32 inches fell, while September came in second with 3.71 inches. Unfortunately, the intense heat and dry conditions that dominated the summer proved detrimental to crops and plant growth in general. November was very dry, but October and December fared well.
The year brought only a single day with measurable snow, January 24th, when 7.2" of snow was measured at the Lubbock Airport. The Lubbock Airport recorded a total of 17.61 inches of precipitation for 2023, finishing 0.72 inches below average. A single daily rainfall record was set in 2023: 0.57" on January 24th (previous record was 0.39" in 1961).
The hottest temperature in 2023 was 110°F, reached on July 12th. The high reached or exceeded 105°F on 14 other occasions. In all, temperatures reached the triple digits on 46 occasions, the second most on record (2011 recorded 48 100-degree days) and well above the long-term average of 10. On the other side of the pendulum, the coldest temperature of the year was 12°F, experienced February 17th. Only 7 nights fell below 20°F for the entire year. Sixteen record highs were tied or set in 2023: 77°F on January 10th; 108°F on June 21st; 110°F on July 12th; 106°F on July 18th; 104°F on August 5th; 107°F on August 11th, 12th and 17th; 105°F on August 18th; 102°F on September 4th and 5th; 103°F on September 7th; 107°F on September 8th; 99°F on September 23rd; 80°F on October 21st; and 87°F on November 6th. In addition, 14 record high minimum temperatures were set or tied in 2023, including three days that didn't drop below 80°F (81°F on August 5th and 80°F on July 18th and August 4th). No record lows or record low maximum temperatures were set in 2023.
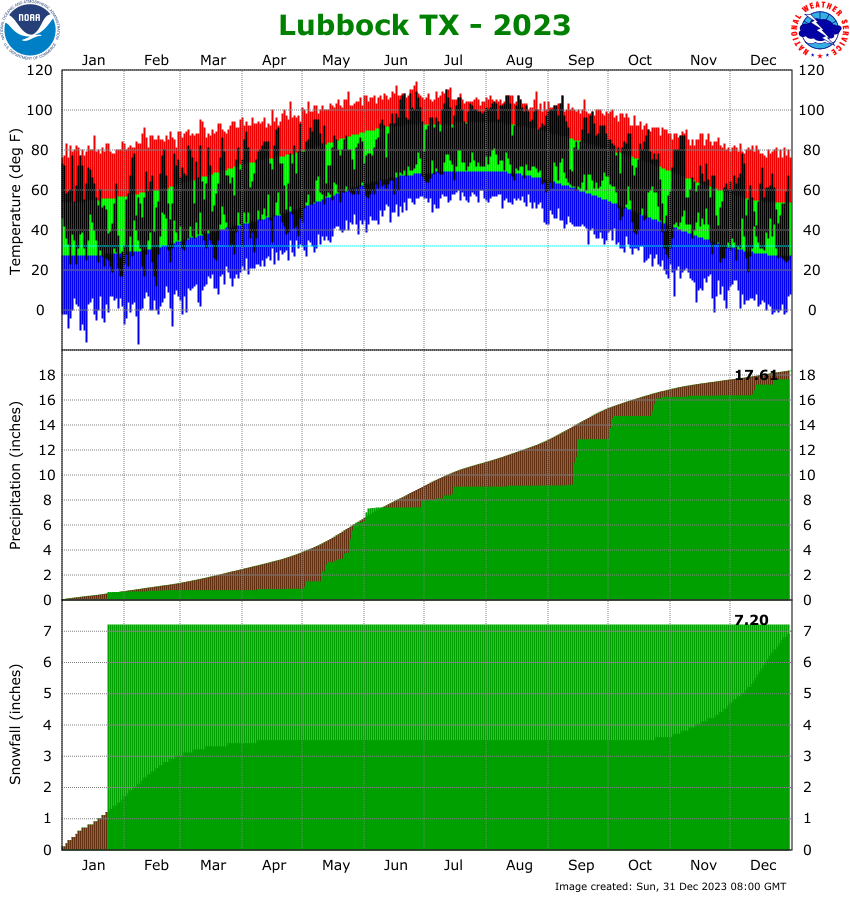
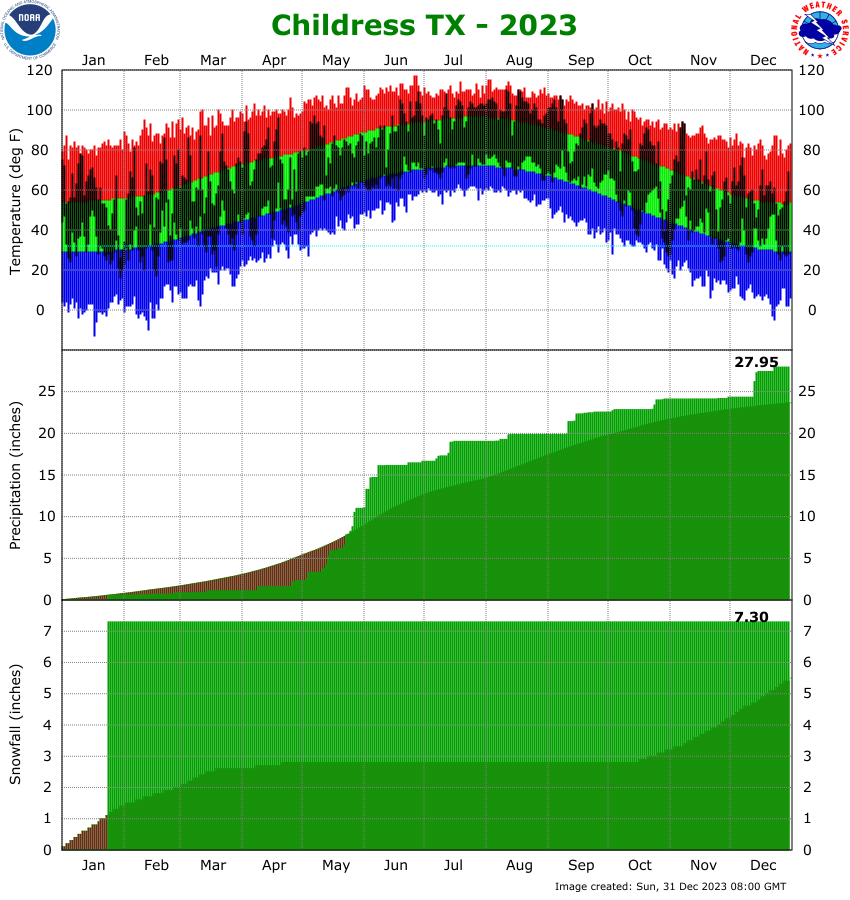
The upper section of the below graph shows the daily high and low temperature distribution for 2023 at Lubbock Preston Smith International Airport. A majority of the year yielded temperatures at or above average, with 10 of the 12 months finishing warmer than average. Unfortunately, the warmest months, with respect to average, occurred during the middle of the year (July through August), when even average temperatures are warm/hot, which made for a scorcher of a summer. September finished as the warmest month, with respect to average, ending +6.3°F above normal. December did also finished well above average (+3.9°F), which helped ease West Texas into the winter. The only two months to finish below average were April (-0.9°F) and May (-0.1°F).
The middle section of the chart above shows how much rain accumulated through 2023. Lubbock finished with a grand total of 17.61 inches, just under the 30-year average. Outside of a brief shot of moisture in late January, the first third of the year was very dry. Periodic showers and thunderstorms finally returned to the South Plains in May, becoming widespread and heavy from late May into early June. After recording a mere 0.86 inches of rain (and melted snow) from January through April, Lubbock received 5.32 inches in May, primarily during the middle and latter part of the month. The rainfall effectively shut off after the first week of June with only a few sporadic shots of rain from late June to mid-July. The lack of rain and the intense heat through the summer of 2023 severely impacted crops across the region after a promising start to the growing season. Rain did eventually return to Lubbock in mid-September, with a few decent rounds of rain between mid-September and late October. Following a dry November, a couple of December rain events finished the year on a moist note.
Similar to 2022, snow was tough to come by in 2023. The year brought only a single day with measurable snow to Lubbock when 7.2" of snow fell on January 24th. Interestingly, even with this heavy snow, temperatures were so mild that very few impacts were experience in and around Lubbock.
The graph above displays the daily temperature as the departure from the "normal", or 30-year average temperature. The yellow line represents the 10-day running mean of the daily temperature departure and is used to smooth out the day-to-day extremes so that longer trends are easier to see. It is clear that above average temperatures dominated the first half of January, most of the summer, from mid-June through September, and much of the end of the year. Several notable cooler than average periods occurred in 2023, including much of the second half of January, the latter part of May, a good chuck of the second half of May into early June (when much of the rain came to the region) as well as a relatively short but chilly stretch of weather in late October. The cool season saw more variability, as is typical, but generally leaned to the warm side of average. Overall, the average temperature of 63.6°F degrees for the entire year was 1.2°F above the 30-year average, and made for the warmest year in the historical record for Lubbock.
|
|
|
| JANUARY through DECEMBER |


