
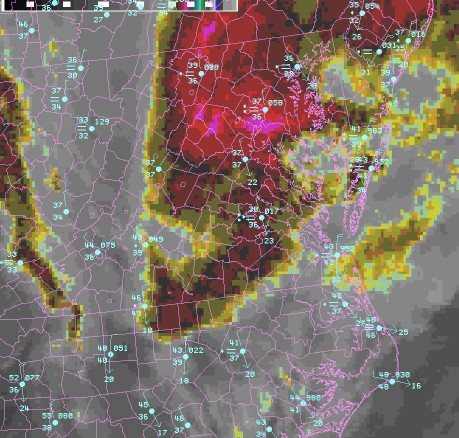
Widespread life-threatening flash and urban flooding will continue to pose a significant threat to life and property in south-central Texas. Catastrophic fiver flooding, with rapid rises on small streams, arroyos, and typically dry washes, is expected. Monsoonal showers persist across the Great Basin and Southwest with greatest flash flooding in southern Arizona. Read More >
|
FORECAST FLOOR 2
|
FORECAST PROCESS
Step 1: Data Analysis and Model Interrogation
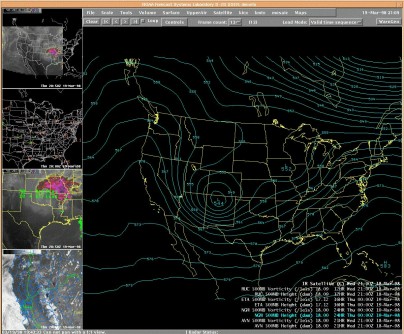
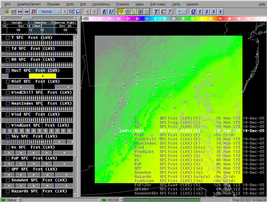
All the data that a forecaster requires is available on the Advanced Weather Interactive Processing System (AWIPS)– our mainframe computer system. On AWIPS, current observations, satellite, radar, upper air profiles, and computer models (numerical simulations of atmospheric variables) are stored for analysis and interrogation. The system is highly flexible, allowing forecasters to create and store personalized procedures, so that data can be readily recalled in a familiar format. Although a planar view is most popular, it is also possible to view data in cross section or time vs. height as well. AWIPS also provides forecasters the ability to overlay various fields on one image, which greatly facilitates in analysis and comparison.
 |
 |
 |
 |
Step 2: Grid Construction
 |
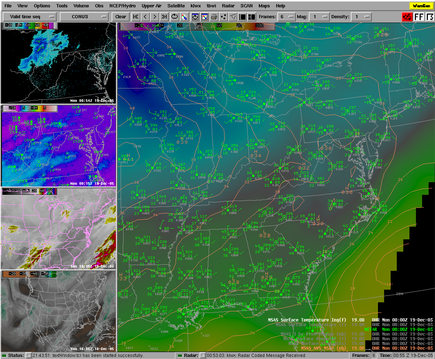
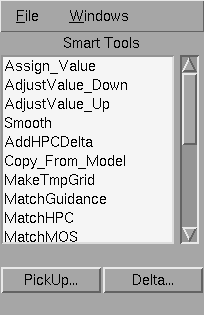
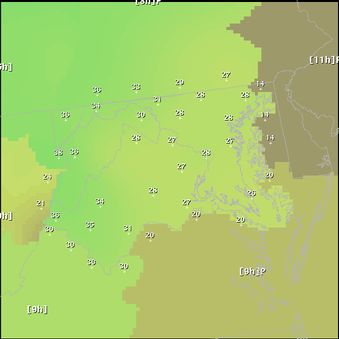
Forecast grids are created and edited using the Graphical Forecast Editor [GFE]. A typical GFE interface window can be seen to the left.
Each grey rectangle on the left side of the frame represents a gridded weather element. The rectangle in yellow is the “active” grid; that is, it’s the grid seen on the right half of the screen. |
|
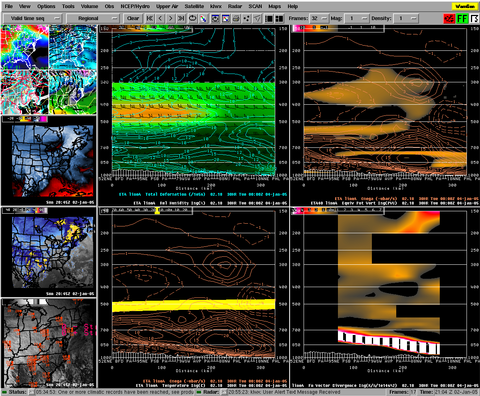
Changes can be made to this field using numerous techniques. It can be contoured, adjusted up/down, or assigned a specific value, to name just a few possible actions. The entire grid can be adjusted at once, or an edit area can first be selected. An enlarged view of the top section of the GFE window can be found below. Most of the controls can be found there or in the Edit Actions box to the right. |
 |
 |
|
Rarely do forecasters start from scratch. Often adjustments are made from the current set of grids. However, if there is a computer model of choice, that data is available to import into the database. Typically, the method used to construct a grid depends upon the field being edited and forecaster preference. There are tools and procedures designed to handle some elements. For instance, once the maximum and minimum temperatures have been drawn, there is a procedure to create hourly temperatures. Then, once the dewpoint fields have been finalized, there is a tool to run to ensure that the dewpoints aren’t higher than the temperatures. Finally, there’s another procedure available to create the hourly relative humidity grids. In this manner, we can facilitate grid creation while ensuring that the grids are internally consistent.
|
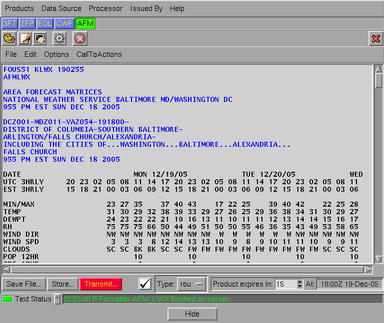
Throughout this process, forecasters must collaborate with surrounding offices to ensure a seamless suite of products.There are two methods to assist us. Offices are connected to each other using Instant Messaging software. This allows forecasters from several offices to discuss the meteorological setup and problems of the day, and arrive at a solution. Also, there is an Intersite Coordination Mode in GFE, which allows forecasters to view the most current grids of surrounding offices, as seen to the right. Thus, any lingering discrepancies can be spotted and resolved prior to product issuance. There are even grids available to handle watches, warnings, and advisories. The software within GFE has the ability to create the appropriate text products, and insert the correct headlines and coding into the remainder of the product suite. |
 |
|
|
|


 Coastal Flood
 FAQ
FAQ