Meteorologists use barometric pressure as one way to rank the intensity of a low pressure system. Simply put: the lower the atmospheric pressure, the more powerful a storm is. Most of Wilmington's strongest storms have been tropical systems -- 12 of the top 20 in fact. Official barometric pressure readings in Wilmington began in 1871 and continue through the present day. Since the late 1940s readings have been taken at the Wilmington International Airport; prior to that observations were taken from a variety of locations downtown. Sorted by lowest barometric pressure, here is the list of the 20 strongest storms in Wilmington's history:
|
rank |
event name |
date |
pres. mb |
pres. in. Hg. |
|
1 |
Sep 16, 1999 |
959.7 |
28.34 |
|
|
2 |
Sep 5, 1996 |
961.4 |
28.39 |
|
|
3 |
Sep 11, 1960 |
962.1 |
28.41 |
|
| 4 | Hurricane Florence | Sep 14, 2018 | 965.5 | 28.51 |
|
5 |
Aug 26, 1998 |
969.9 |
28.64 |
|
|
6 |
Mar 6, 1932 |
970.2 |
28.65 |
|
|
7 |
Oct 15, 1954 |
971.2 |
28.68 |
|
|
8 |
Mar 13, 1993 |
974.6 |
28.78 |
|
|
9 |
Sep 27, 1958 |
975.3 |
28.80 |
|
|
10 |
Nov 17, 1873 |
978.0 |
28.88 |
|
|
11 |
Jul 12, 1996 |
978.7 |
28.90 |
|
|
12 |
Aug 27, 2011 |
979.3 |
28.92 |
|
|
13 |
Mar 28, 1984 |
980.4 |
28.95 |
|
|
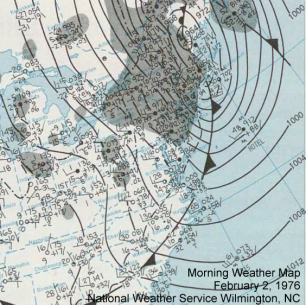
14t |
Feb 1, 1976 |
983.4 |
29.04 |
|
|
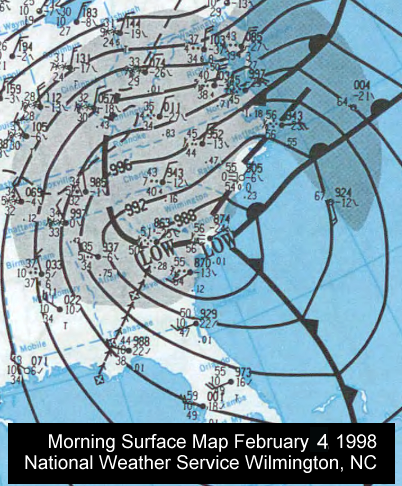
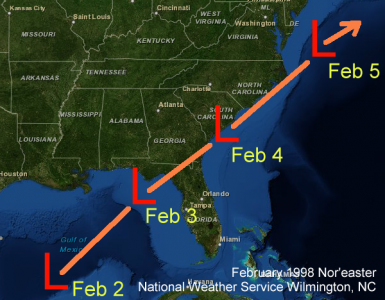
14t |
Feb 4, 1998 |
983.4 |
29.04 |
|
|
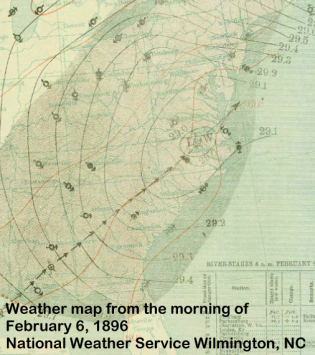
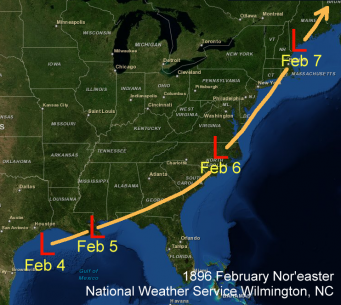
16 |
Feb 6, 1896 |
984.4 |
29.07 |
|
|
17 |
Oct 22, 1878 |
985.1 |
29.09 |
|
|
18t |
Aug 12, 1955 |
985.4 |
29.10 |
|
|
18t |
Sep 1, 2006 |
985.4 |
29.10 |
|
|
20 |
Oct 13, 1893 |
986.1 |
29.12 |
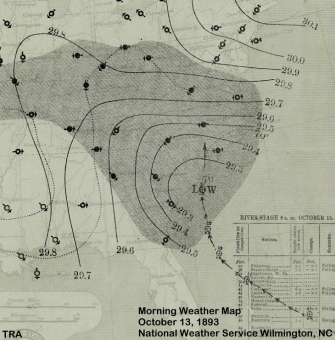
Storm #20: 1893 "Charleston Hurricane" Pressure: 29.12"The ninth storm of the 1893 Hurricane Season |
|
|
|
Date: October 13, 1893Lowest Pressure: 29.12 inches of Mercury, 986.1 millibars
The Charleston Hurricane of 1893 was a long-tracked, classic Cape Verde hurricane that developed from a tropical wave that moved off Africa in late September. The wave organized into a tropical storm on September 25th, strengthened into a hurricane during the evening of September 27th, then became a major hurricane early in the morning on October 2nd while nearly 800 miles east of the Windward Islands. After making a glancing strike on Abaco Island in the Bahamas during the evening of October 12th, the hurricane turned north and came ashore near McClellanville, SC as a powerful category 3 hurricane with maximum sustained winds near 120 mph. As the hurricane moved north through the eastern Carolinas it only slowly lost strength as the center passed near the towns of Georgetown, Conway, Tabor City and Bladenboro. Hurricane force winds were still occurring across portions of Eastern Virginia, Maryland and Delaware as the circulation center moved across eastern West Virginia and into southern Pennsylvania. NWS Meteorologist James Hudgins found the following information about this storm: "The highest reported wind in North Carolina was 94 mph at Southport. In the Wilmington area, the tide and overflow of water were reported as the highest known to date, being 16 inches above the high water mark of 1853. Damage to the Wilmington waterfront was estimated at $150,000. Great destruction was reported to forests, crops and property, and to shipping. Two children were crushed when a tree fell on a house in Sampson County. A total of 22 lives were lost in North Carolina from this storm" In Wilmington, 1.54 inches of rain fell and the 20th lowest barometric pressure on record was measured. Note: this hurricane is sometimes confused with the 1893 Sea Islands Hurricane which occurred nearly two months earlier. That hurricane, also a category 3 at landfall, made landfall just south of Savannah, Georgia on August 27, 1893 and devastated much of the Georgia coastline. |
|
|
|
|
Hudgins, James E.: Tropical Cyclones Affecting North Carolina Since 1586, an Historical Perspective |
|
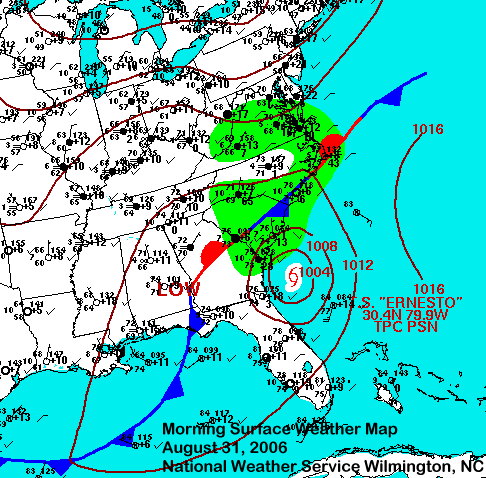
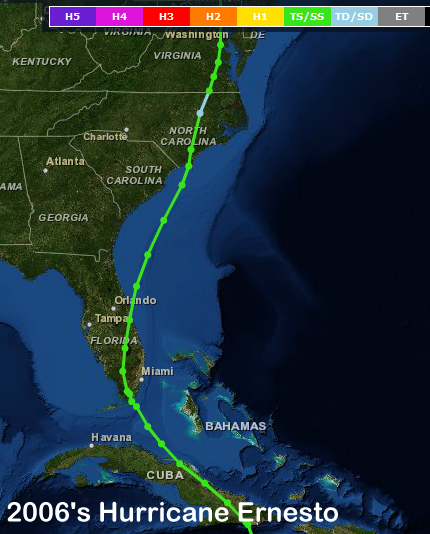
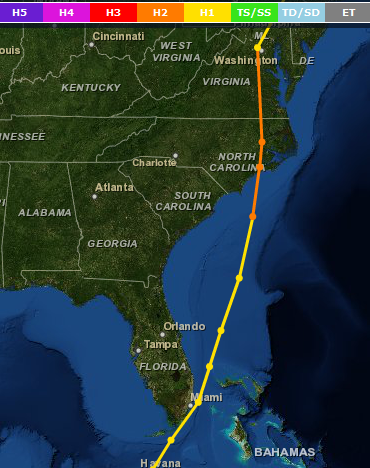
Storm #18 (tie): 2006 Hurricane Ernesto Pressure: 29.10"The sixth storm of the 2006 Hurricane Season |
|
|
|
Date: September 1, 2006Lowest Pressure: 29.10 inches of Mercury, 985.4 millibars
A tropical wave moving west across the Atlantic was first classified as a tropical depression in the southern Windward Islands on August 24. It strengthened into a tropical storm on August 25th while about 400 miles south of Puerto Rico. Ernesto moved northwestward, briefly attaining hurricane strength while south of Haiti August 27th. The storm then weakened slightly and moved northwestward toward a landfall near Segua, Cuba during the morning of August 28th. After exiting Cuba, Ernesto crossed southern Florida on August 30th and moved north toward a landfall on the eastern end of Oak Island late in the evening on August 31st as a tropical storm with 70 mph winds. The center of Ernesto almost crossed over the city of Wilmington, moving directly across Winnabow, Leland, and Watha before continuing north between Kinston and Goldsboro. In Wilmington, Ernesto produced wind gusts to 62 mph and 9.84 inches of rain. At the beaches the storm surge was as high as 3 feet, but flooding from heavy rainfall and minor power outages were the biggest problems. Ernesto made this list mainly due to the fact the center of the circulation moved so close to the city of Wilmington, allowing the lowest pressure to be measured locally. Also of note: a tropical storm (Tropical Storm "Two") was classified during post-season analysis, making Ernesto the sixth storm of the 2006 season, not the fifth as its name would suggest.
|
|
|
|
|
Read more about Hurricane Ernesto at https://weather.gov/ilm/2006-Aug-31tropicalstorm |
|
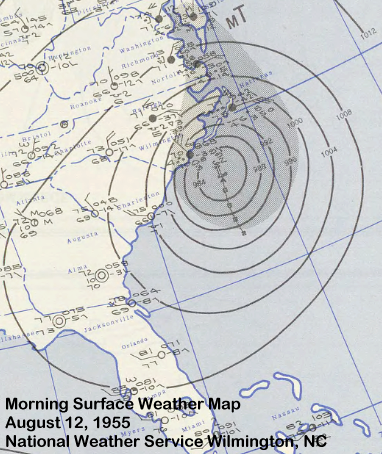
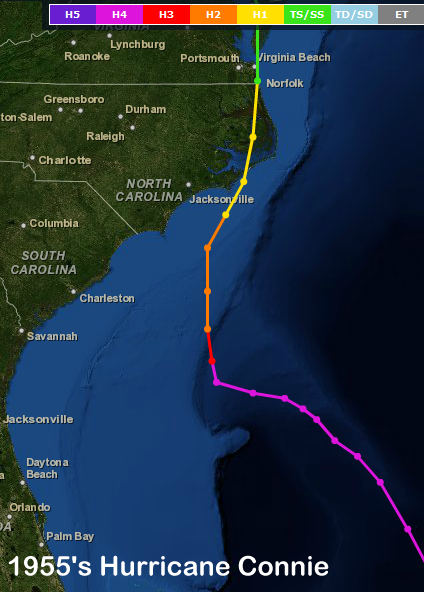
Storm #18 (tie): 1955 Hurricane Connie Pressure: 29.10"The third storm of the 1955 Hurricane Season |
|
|
|
Date: August 12, 1955Lowest Pressure: 29.10 inches of Mercury, 985.4 millibars
Hurricane Connie was a classic long-tracked Cape Verde hurricane that began one of the most intense periods of hurricane activity ever recorded along the North Carolina coast. There were three damaging hurricane strikes locally during a 38 day period which included Hurricane Diane and Hurricane Ione. Connie was born from a tropical wave that exited the African coast during late September. By August 3rd it had achieved enough organization to be declared a tropical storm while almost 1000 miles west of the Cape Verde Islands. Connie went through an explosive deepening phase on August 5th that saw the storm strengthen from a tropical storm to a category 4 hurricane in less than 24 hours. Connie maintained category 4 intensity as it approached the Southeast U.S. coast over the next six days. Connie was about 350 miles east of Savannah on August 11th when it made a sharp right-hand turn. The hurricane weakened to category 2 intensity but now was aiming directly at Southeastern North Carolina. Another turn to the right during the evening of August 12th turned Connie's path east of Wilmington toward its eventual landfall on Core Banks southwest of Ocracoke Island. Despite missing the Cape Fear area to the east, Hurricane Connie still produced wind gusts to 83 mph and 4.77 inches of rain in Wilmington. Considerable damage from wind and storm-surge flooding occurred from Myrtle Beach northward across the entire North Carolina coastline. Newspaper reports said five tornadoes from Connie hit eastern South Carolina with one tornado touchdown in North Carolina. Heavy rainfall from Connie saturated the soil across the Mid-Atlantic and Northeast, setting the stage for significant flooding Hurricane Diane just one week later. Hurricane Diane, it is said, was the nation's first billion dollar weather disaster. |
|
|
|
|
Monthly Weather Review: Article about the 1955 Hurricane Season Robesonian Newspaper: August 8, 1955 St. Petersburg Times: 1955 Hurricanes Were History's Greatest (Feb 5, 1956) |
|
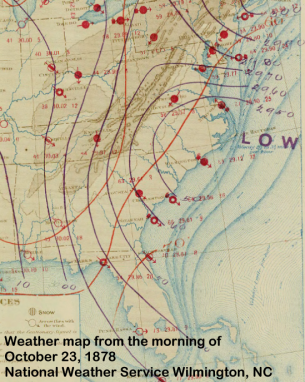
Storm #17: "The Gale of 1878" Pressure: 29.09"The eleventh storm of the 1878 Hurricane Season |
|
|
|
Date: October 22, 1878Lowest Pressure: 29.09 inches of Mercury, 985.1 millibars
A tropical storm formed in the western Caribbean Sea about 150 miles southwest of Jamaica during the evening of October 17. The storm strengthened to a category 1 hurricane on the evening of October 19 while about 200 miles south of Cuba, then made landfall in western Cuba early in the morning of October 21st as a category 2 hurricane with 105 mph winds. After weakening to a category 1 storm, the hurricane moved northeastward between southeastern Florida and the Bahamas on October 21st, then hooked back to the north and strengthened as it approached North Carolina -- possibly due to non-tropical influences. Landfall was near Swansboro, North Carolina late in the evening on October 23rd as a category 2 hurricane with 105 mph winds. Compared to today, coastal North Carolina was lightly populated at the time and there are few reports of significant damage on land. The City of Houston, an iron-hulled steamship, was sunk on Frying Pan Shoals during this storm. The wreck, lying at about 90 feet depth, is a popular diving spot today. Wilmington measured 3.18 inches of rain from the storm and established what was at the time the lowest pressure measured. (That has obviously been superseded many times since) After impacting Eastern North Carolina, the Gale of 1878 earned its historic name by pounding the Mid-Atlantic and Northeastern United States, producing hurricane force gusts and substantial tidal flooding through Virginia into New Jersey. Winds as far north as Portland, Maine reached 70 mph. James Hudgins reports from his research that the Outer Banks received a significant impact from this storm including reports of 100 mph winds at Cape Lookout. |
|
|
|
|
Research by David Roth and Hugh Cobb: Reanalysis of the Gale of '78 Hudgins, James E.: Tropical Cyclones Affecting North Carolina Since 1586, an Historical Perspective |
|
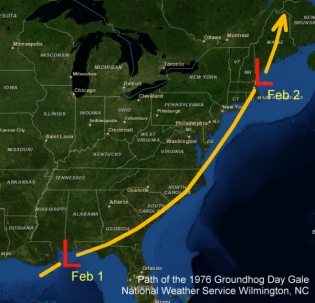
Storm #14 (tie): 1976 Groundhog Day Gale Pressure: 29.04"Non-tropical Winter Storm |
|
|
|
Date: February 1, 1976Lowest Pressure: 29.04 inches of Mercury, 983.4 millibars
Low pressure developed the morning of Sunday, February 1st near Mobile, Alabama and moved northeast toward the Carolinas during the day. Another area of low pressure along an arctic cold front over the northern Great Lakes moved eastward as well. The two storms combined into one monster storm system along the North Carolina, Mid-Atlantic, and Northeast U.S. coast during the evening of February 1st and the morning of February 2nd, establishing the thirteenth lowest pressure on record for Wilmington, NC. Only a small amount of rain was recorded in Wilmington on February 1st (0.39 inches) but wind gusts reached 48 mph just before midnight in the powerful pressure gradient surrounding the rapidly strengthening storm center. The worst effects from this storm locally were due to strong winds Sunday night. The Robesonian newspaper from Lumberton, NC reported the drowning of a 20-year old man on Lake Waccamaw. One person was hospitalized from an overturned mobile home in Chadbourn, and a 38-foot boat was blown ashore at Wrightsville Beach. As is true with most Nor'easters, the most significant impacts from this storm were well north of the Carolinas. Record low barometric pressure readings were established in Boston, MA and Caribou, ME along with significant snowfall totals in the interior Northeast. |
|
|
|
|
The Robesonian newspaper: Story about Storm's Impact from February 3, 1976 |
|
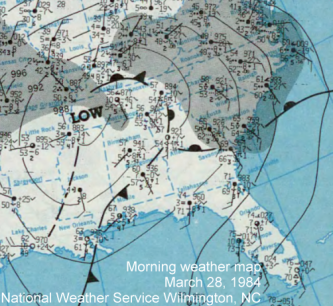
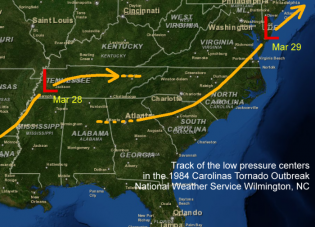
Storm #13: 1984 Carolinas Outbreak Pressure: 28.95"Non-tropical Spring Storm and Severe Weather Outbreak |
|
|
|
Date: March 28, 1984Lowest Pressure: 28.95 inches of Mercury, 980.4 millibars
One of the deadliest tornado outbreaks in the history of the two Carolinas occurred during the afternoon and evening of March 28, 1984. There were 24 individual tornado touchdowns: 11 in North Carolina, 11 in South Carolina, and 2 in Georgia. The human impact included 57 fatalities, (42 in North Carolina, 15 in South Carolina, none in Georgia) and 1248 injuries. (799 in North Carolina, 448 in South Carolina, and 1 in Georgia) The main surface low moved east across Tennessee during the day of March 28th. A new low formed across northern Alabama and northwest Georgia during the early afternoon hours and became the primary low, deepening as it accelerated northeastward across northern South Carolina and eastern North Carolina during the late afternoon and evening. Supercell thunderstorms developing near this low raced across the Sandhills and Coastal Plain, producing multiple long-tracked, powerful tornadoes. The pressure at Wilmington actually broke below 29.00 inches on the barometer, only the third time in 140 years this has occurred without a strong hurricane affecting the area. Rainfall for the event only totaled 0.64 inches in Wilmington, but winds reached 47 mph as the low pushed away from the area and colder air surged in from the north. |
|
|
|
|
Local Event Summary: March 28, 1984 Carolinas Tornado Outbreak The Robesonian newspaper: March 29, 1984 |
|
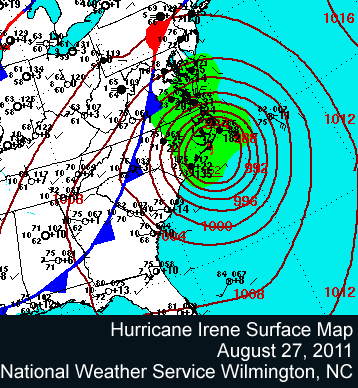
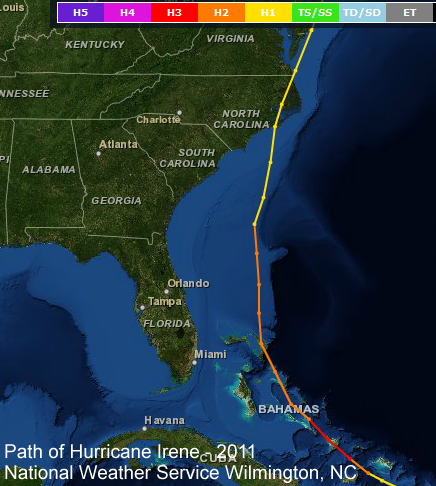
Storm #12: 2011 Hurricane Irene Pressure: 28.92"The ninth storm of the 2011 Hurricane Season |
|
|
|
Date: August 27, 2011Lowest Pressure: 28.92 inches of Mercury, 979.3 millibars
Irene became a tropical storm just east of the Leeward Islands during the evening of August 20th. The storm moved northwest and intensified into a category 1 hurricane just as it made landfall on Puerto Rico's east coast around midnight August 22nd. Continuing northwest across open water, Irene steadily strengthened over the next two days before undergoing a period of rapid deepening the evening of August 24th and early morning of August 25th while entering the southeastern Bahamas. Irene briefly became a category 3 hurricane before turning north and slowly weakening as it entrained dry air across the Southeastern United States. Irene made landfall on Shackleford Banks just west of Cape Lookout early in the morning of August 27th as a category 1 hurricane with 85 mph winds. In Wilmington Irene's peak wind gust was 66 mph with 6.56 inches of rain measured. At Wrightsville Beach wind gusts were measured at 74 mph and Irene's storm surge averaged 2 to 3 feet. The final report on Irene from the National Hurricane Center says the storm surge likely reached 8 to 11 feet in portions of the Pamlico Sound in extreme eastern North Carolina. Wind gusts at Hatteras reached 87 mph, 90 mph on Cedar Island, and 115 mph as measured onboard the Cedar Island ferry boat. Along the Outer Banks Irene severed NC Highway 12, the north-south lifeline of the barrier islands. After crossing extreme eastern North Carolina, Irene moved north along the heavily populated Mid-Atlantic and Northeast coastline. Insured losses from Hurricane Irene were $4.6 billion with an additional $7.2 billion in insured flooding damage. |
|
|
|
|
Local Event Summary: Hurricane Irene - August 27, 2011 National Hurricane Center: Tropical Cyclone Report on Hurricane Irene |
|
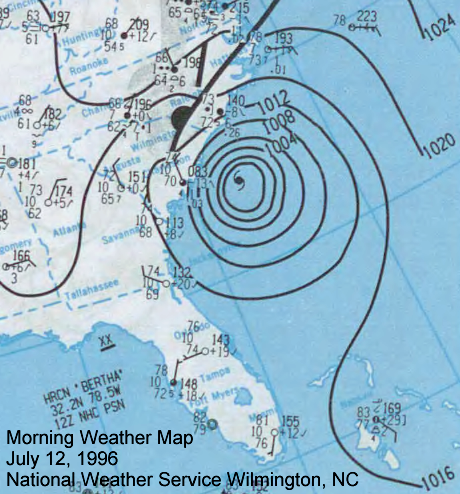
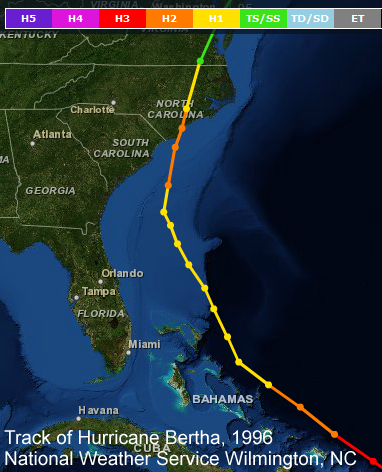
Storm #11: 1996 Hurricane Bertha Pressure: 28.90"The second storm of the 1996 Hurricane Season |
|
|
|
Date: July 12, 1996Lowest Pressure: 28.90 inches of Mercury, 978.7 millibars
Hurricane Bertha was the first of four strong hurricanes that affected Eastern North Carolina during the mid to late 1990s. Within the span of just four years Hurricanes Bertha, Fran, Bonnie, and Floyd struck the southeastern corner of the state. This period of extreme hurricane activity has a parallel in history to the period 1954-1955 when Hurricanes Hazel, Connie, Diane, and Ione hit the area. Bertha was a Cape Verde hurricane that formed in the tropical Atlantic about halfway between Africa and South America during the evening of July 4th. As a tropical depression, Bertha was immediately noteworthy for its early date of development (normally the Cape Verde hurricane season doesn't begin for over another month) and for its proximity to the equator, just 9.8 degrees north latitude. Bertha achieved hurricane strength while about 200 miles east of Guadeloupe Island on July 7th, and became a category 3 major hurricane early in the morning on July 9th about 200 miles northeast of San Juan, Puerto Rico. Bertha then moved northwest skirting by the eastern Bahama Islands July 9 and 10, then turned north toward the Carolinas. Landfall occurred on Bald Head Island, NC during the afternoon of July 12th with maximum sustained winds of 105 mph. Bertha's eye moved north across eastern New Hanover and Pender counties, and the storm weakened as it moved across Kinston and Greenville during the evening. In Wilmington winds gusted to 70 mph, but winds were measured as high as 92 mph at Wrightsville Beach and 95 mph on Figure Eight Island. Storm total rainfall was 5.56 inches at the ILM airport. According to reports from the Wilmington Star-News, Bertha heavily damaged or destroyed a number of piers along the Cape Fear coast including the Kure Beach Pier (destroyed), Johnnie Mercer Pier (50 feet washed away), and the Ocean City Fishing Pier at North Topsail Beach which lost 200 feet. Curfews were enacted to prevent looting after the storm, and Carolina Power & Light reported 84,000 customers without power at the height of the storm. Significant damage occurred to sand dunes at the beaches: On Wrightsville Beach about 50 feet of the sand dunes were lost, while Kure Beach and Surf City suffered significant sand losses too. |
|
|
|
|
National Hurricane Center Report: Hurricane Bertha 1996 National Weather Service: Hurricane Bertha Service Assessment Wilmington Star-News: Bertha Batters Cape Fear (July 13, 1996) Wilmington Star-News: Utility Crews Push to Plug People Back in (July 14, 1996) Wilmington Star-News: Bertha (July 15, 1996) |
|
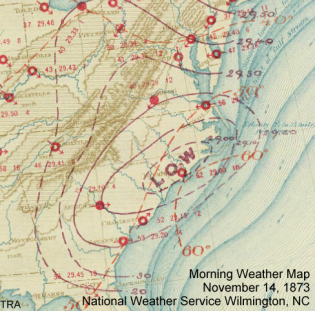
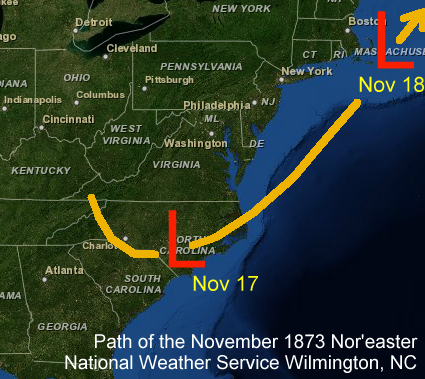
Storm #10: November 1873 Nor'easter Pressure: 28.88"Non-tropical Winter Storm |
|
|
|
Date: November 17, 1873Lowest Pressure: 28.88 inches of Mercury, 978.0 millibars
Very few reports exist locally from what was the third strongest non-tropical storm ever to affect Wilmington. Daily weather maps show unusually low pressures across the eastern half of the nation on November 16th. All U.S. stations north of Savannah, GA reported pressures below 30.00 inches during the morning. The evening weather map for November 16th showed the barometer falling rapidly near a low over West Virginia. By the morning of November 17th the low was analyzed just north of Wilmington with a central pressure below 29.00 inches. The low continued to strengthen as it moved northeast and off the NC Outer Banks during the day. Despite the amazing strength of this system, rainfall in Wilmington only totaled 0.15 inches. The NWS Sterling, VA office reports that this storm brought "high tides to [the] tidewater area, flooding wharves and the lower portion of Norfolk." The U.S. Coast Guard has a report that the Coast Guard Cutter Guthrie was grounded during a hurricane on this date -- almost certainly a reference to this nor'easter since no hurricanes were occurring elsewhere. The Reading Eagle newspaper reported on November 21, 1873, "The storm that raged here on Monday Night was severely felt along the coasts and along the Hudson River and many marine disasters are reported." |
|
|
|
|
U.S. Coast Guard: Cutter History (see item #56 on the page) Reading Eagle: November 21, 1873 (see top left of page 2 for the paragraph about the storm) |
|
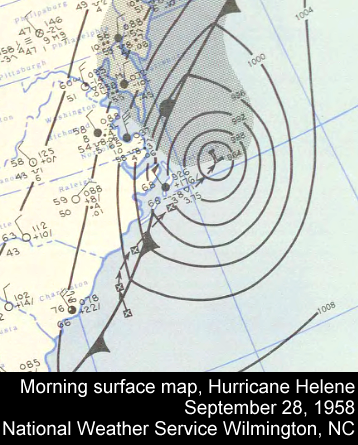
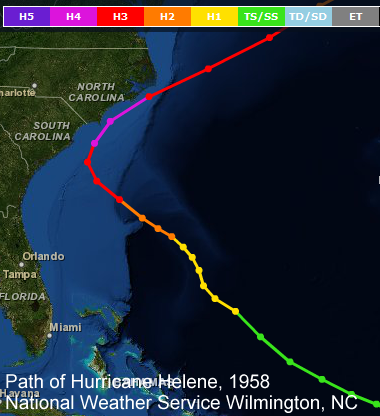
Storm #9: 1958 Hurricane Helene Pressure: 28.80"The eighth named storm of the 1958 Hurricane Season |
|
|
|
Date: September 27, 1958Lowest Pressure: 28.80 inches of Mercury, 975.3 millibars
The tropical depression that would be named Helene developed nearly 1000 miles east of Puerto Rico on September 21. The depression did not strengthen rapidly; it took two days to become a tropical storm and receive the name Helene. Over the next five days the storm moved northwestward gradually gaining strength. By early in the morning on September 27th Helene had become a powerful category 3 hurricane with maximum sustained winds near 125 mph only 100 miles east of Charleston, SC. Helene turned abruptly north, then northeast during the day, missing Southport and Cape Fear by just over 20 miles as an intense hurricane with winds estimated at 130 mph. The eye of Helene paralleled the coast of the southern Outer Banks as it moved out to sea, gradually weakening in advance of a cold front. As bad as Hurricane Helene was for southeastern North Carolina it could have been much, much worse. Helene never actually made landfall as the eye remained approximately 20 miles offshore. Even given this distance the all-time record wind gust for Wilmington occurred during Hurricane Helene: 135 mph as measured by the official airport anemometer. Reports of gusts of 150 to 160 mph on the beaches were received although there was no way to verify their accuracy. A report from the Associated Press appearing in newspapers on September 28th said the damage in Southport, NC exceeded that seen during Hazel. Every house was said to have sustained damage, and "a number of buildings were caved in, their roofs lifted and tossed about like paper." The report continues: "More than half of the [Southport] Municipal Pier was carried away." The Cape Fear area beaches were spared more substantial wave and surge impact by the fact Helene moved through near low tide. The tide has risen by the time the storm reached the southern Pamlico Sound, and more significant surge impacts were noted there. Rainfall in Wilmington totaled 8.29 inches. Had Helene actually made landfall we would likely make comparisons to Helene, not Hazel, when discussing worst-case hurricane scenarios for Wilmington. The period 1954 through 1960 was an exceptionally active period for hurricanes along the North and South Carolina coast. Less than two years after Helene, Hurricane Donna would strike the area dealing another significant blow. |
|
|
|
|
NWS Wilmington: Hurricane Helene Monthly Weather Review: The 1958 Hurricane Season Hudgins, James E.: Tropical Cyclones Affecting North Carolina Since 1586, an Historical Perspective |
|
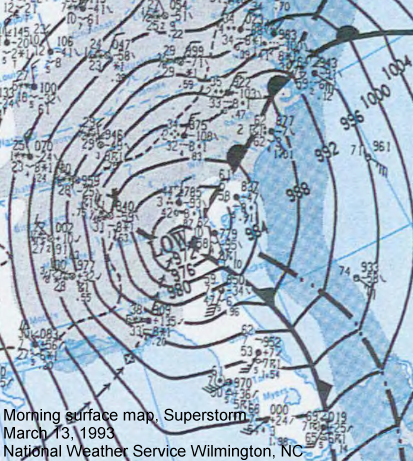
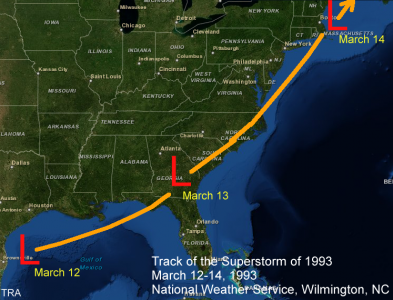
Storm #8: 1993 Superstorm Pressure: 28.78"Non-tropical Winter Storm |
|
|
|
Date: March 13, 1993Lowest Pressure: 28.78 inches of Mercury, 974.6 millibars
The Superstorm of 1993 was one of the most intense mid-latitude cyclones ever observed in the United States. This storm affected 40 percent of the population of the nation and impacted a geographic area larger than most hurricanes. The storm will be remembered for its tremendous snowfall totals from Alabama through Maine, high winds all along the East coast, extreme coastal flooding along the Florida west coast, incredibly low barometric pressures across the Southeast and Mid-Atlantic, and for the unseasonably cold air that followed behind the storm. In terms of human impact the Superstorm of 1993 was more significant than most landfalling hurricanes or tornado outbreaks and ranks among the deadliest and most costly weather events of the 20th century. Early on March 12th low pressure developed along a stalled front on the Texas gulf coast. The low rapidly deepened as it crossed the warm waters of the Gulf of Mexico and it made "landfall" along the Florida Panhandle just after midnight March 13th. The low encountered cold air inland and a large area of heavy snow and blizzard conditions developed across the interior Southeastern states. All-time low pressure records were established in Columbia, Charlotte and Greensboro, even beating out the pressures observed just a few years earlier during Hurricane Hugo's visit in September 1989. Winds in Wilmington reached 70 mph producing widespread power outages. Coastal flooding produced significant coastal flooding along the south-facing beaches of Brunswick County and destroyed a portion of the old Long Beach Pier; prior to the storm it was the longest pier in North Carolina. Rainfall in Wilmington totaled 1.81 inches, and rain actually changed to snow late in the evening on March 13th. Only a trace of snow accumulated in Wilmington. |
|
|
|
|
Local Event Review: The Superstorm of 1993 |
|
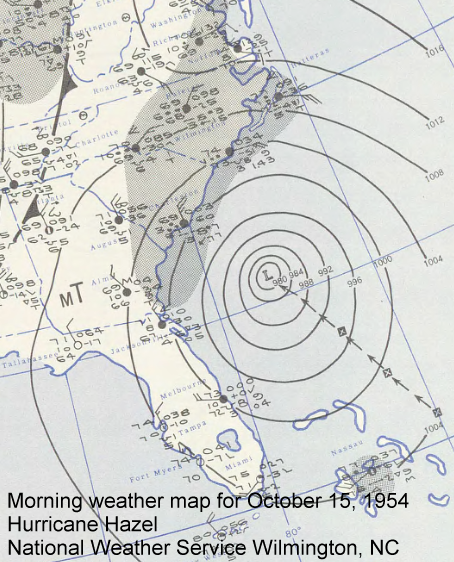
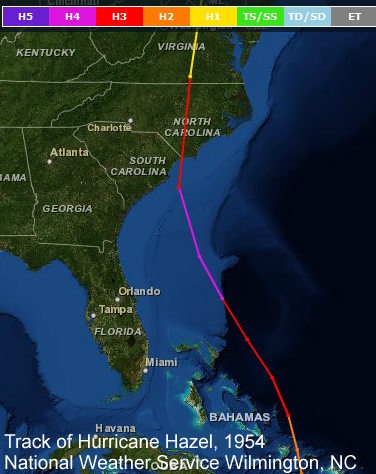
Storm #7: 1954 Hurricane Hazel Pressure: 28.68"The ninth storm of the 1954 Hurricane Season |
|
|
|
Date: October 15, 1954Lowest Pressure: 28.68 inches of Mercury, 971.2 millibars
In terms of destruction, it is hard to find a hurricane in the Carolina's history to match Hazel. On October 15, 1954 the center of this legendary hurricane slammed ashore near the NC/SC state line causing a level of devastation virtually unmatched in the local historic record. Hazel became a tropical storm just east of the southern Windward Islands on October 5th. It moved west and strengthened into a category 3 hurricane only 200 miles north of Caracas, Venezuela on October 7th, later moving across the central Caribbean Sea with 130 mph winds. Hazel abruptly turned north and crossed western Haiti on October 12th as a category 3 hurricane, then accelerated northward toward the Carolinas as a strong upper level trough developed across the eastern portion of North America. Hazel's rapid forward speed allowed to the storm to maintain very strong winds a great distance inland. Wind gusts in Fayetteville, NC reached 110 mph, with 90 mph gusts recorded in Raleigh. Hazel seamlessly transitioned from a hurricane into a powerful non-tropical low, maintaining much of its wind energy while transitioning its energy source from warm ocean water to horizontal temperature contrasts. Damaging winds occurred all the way into the Northeast where 90 mph gusts were still occurring in New York State. The storm surge just east of the eye along portions of the Brunswick County coast reached 18 feet, highest near Calabash and Holden Beach. In Myrtle Beach upwards of 80 percent of the first row of beach structures were destroyed and wind gusts were measured at 102 mph. In the Oak Island, NC community of Long Beach 98 percent of beach structures did not survive the storm, and the few that did survive were heaviliy damaged. Grass-covered sand dunes 10 to 20 feet high simply disappeared during the storm on Oak Island, a testament to the power of the storm surge. A newspaper report says in Wrightsville Beach "most of the cottages along the water front had been washed away." Near Wilmington the same newspaper report says "three freighters had broken loose from their moorings and were moving down the Cape Fear River." Hazel is responsible for the highest stage ever recorded on the Cape Fear River at downtown Wilmington: 8.15 feet above mean lower low water. (MLLW) Based on recent surveys near the Cape Fear River, Hazel likely flooded Water Street to a depth of nearly three feet. Wilmington received 3.85 inches of rain from Hurricane Hazel, and recorded its sixth lowest pressure in history: 28.68 inches. The Local Climatological Data publication for Wilmington states that a boat anchored near Little River, SC "in the eye" recorded a pressure of 27.70 inches. The maximum wind gust measured in Wilmington was 98 mph at 10:42 a.m. on October 15th, with a 5-minute average wind speed of 62 mph. In Myrtle Beach the barometric pressure bottomed out at 28.47 inches. Wind gust estimates of 125 to 150 mph were received from the Brunswick County coast. |
|
|
|
|
National Weather Service Wilmington: Hurricane Hazel 60th anniversary website Sarasota Journal: Hazel Roars Inland, October 15, 1954 National Weather Service Raleigh: Hurricane Hazel Event Summary Hudgins, James E.: Tropical Cyclones Affecting North Carolina Since 1586, an Historical Perspective |
|
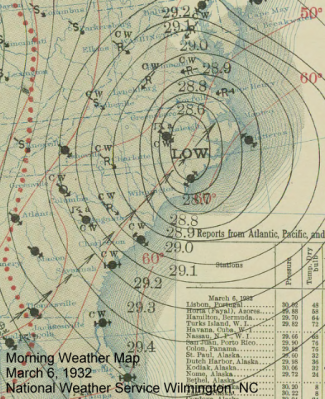
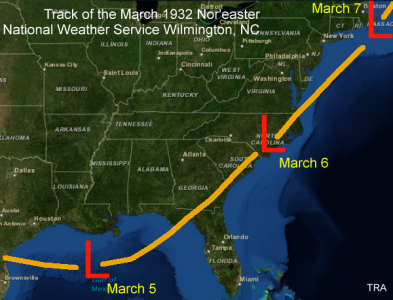
Storm #6: 1932 Nor'easter Pressure: 28.65"Non-tropical Winter Storm |
|
|
|
Date: March 6, 1932Lowest Pressure: 28.65 inches of Mercury, 970.2 millibars
The March 6, 1932 Nor'easter produced Wilmington's lowest pressure on record not associated with a hurricane. Taking a path similar to the Superstorm of '93 (March 13, 1993) that produced extremely low pressures across much of the Southeastern and Mid-Atlantic states, this storm also produced large amounts of snow inland (five foot drifts in the Virginia Blue Ridge mountains, and 14 foot drifts in the Pennsylvania mountains) with damaging winds reported near the coast. Fatalities were reported in Georgia, Alabama and Mississippi where newspaper reports said "destructive winds inflicted widespread damage." A significant tornado outbreak across the Deep South March 21 and 22, 1932 would cause even more damage across that same area. In Florida, nine people on a sponge boat were killed when high winds and rough seas capsized their vessel. In Wilmington 2.00 inches of rain fell during this storm. Cold air behind the low brought five consecutive days with low temperatures at or below freezing in Wilmington, including snow flurries on March 9th followed by a low temperature of 21 degrees the morning of March 10th. There are few reports of local damage or impacts other than the unseasonably cold weather which followed. |
|
|
|
|
Schenectady Gazette: March 7, 1932 article on the storm The Evening Independent: March 8, 1932 article on the storm St. Petersburg Times: Winter Storm Takes 8 Lives (March 8, 1932) |
|
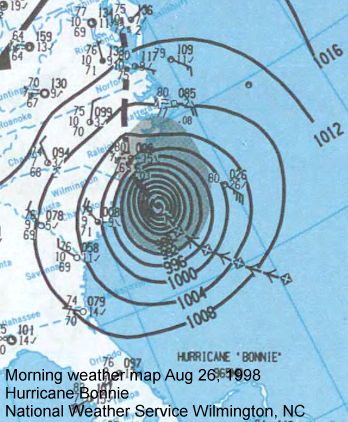
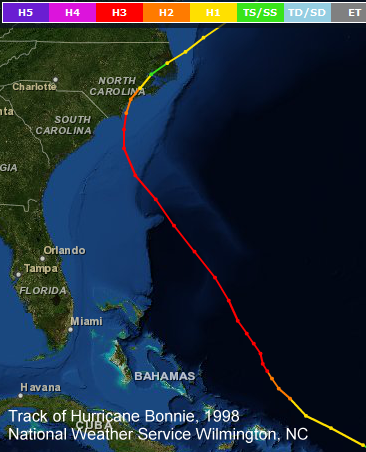
Storm #5: 1998 Hurricane Bonnie Pressure: 28.64"The second storm of the 1998 Hurricane Season |
|
|
|
Date: August 26, 1998Lowest Pressure: 28.64 inches of Mercury, 969.9 millibars
Bonnie became a tropical storm while about 300 miles east of the northern Windward Islands on August 20th. Bonnie strengthened into a hurricane while north of Puerto Rico during the evening of August 21st, then turned northwestward toward the Southeastern United States. Bonnie remained east of the Bahamas and attained category 3 intensity on August 23rd with maximum sustained winds around 115 mph. Once Bonnie was as far north as Charleston, SC the hurricane turned north-northeastward raking the coast of Brunswick, New Hanover and Pender counties with the western portion of the eyewall during the evening of August 26th. The center of the eye remained barely 10 miles off the coast from Bald Head Island north to Wrightsville Beach. Fortunately the storm was weakening and maximum sustained winds decreased to 110 mph as Bonnie approached, but was still a strong category 2 hurricane. Landfall was near Surf City at the Pender/Onslow county line around midnight on August 27th. In Wilmington winds gusted to 74 mph at the airport and 9.04 inches of rain fell. Winds were stronger at the beaches where a gust to 89 mph was measured in Kure Beach. With most southeastern North Carolina beaches remaining west of the landfall point, storm surge values were lower compared to what likely occurred east of the center. Tides along the New Hanover county coast reached 7 to 9 feet. Power was lost to 800,000 people across coastal North Carolina. There were also agricultural losses due to saltwater flooding of tobacco, corn, cotton and soybean fields. With three significant hurricane strikes in just three years, the Wilmington Star-News ran an interesting article discussing historical precedents to active periods of local hurricane activity. Bonnie was the weakest of the four significant hurricane strikes of the mid and late 1990s but still packed a wallop. Damage in New Hanover and Brunswick Counties was estimated at around $20 million each. In the North Topsail Beach approximately 600 homes suffered damage and ten structures were condemned due to significant damage. Inland, Columbus County officials estimated damage at $2.1 million not including crop damage and debris removal costs. |
|
|
|
|
National Weather Service Newport/Morehead City: Hurricane Bonnie event review National Hurricane Center: Hurricane Bonnie Preliminary Report Wilmington Star-News: Trees fall, 800,000 lose power, Officials Start to Assess Damage (August 28, 1998) Wilmington Star-News: Farmers Crop Losses Start Sinking In (August 29, 1998) Wilmington Star-News: 2 Deaths Repored as Region Picks Up (August 29, 1998) |
|
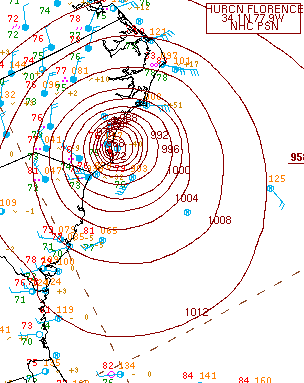
Storm #4: 2018 Hurricane Florence Pressure: 28.51"The sixth storm of the 2018 Hurricane Season |
|
|
Morning weather map Sept 14, 2018 |
Date: September 14, 2018Lowest Pressure: 28.51 inches of Mercury, 965.5 millibars
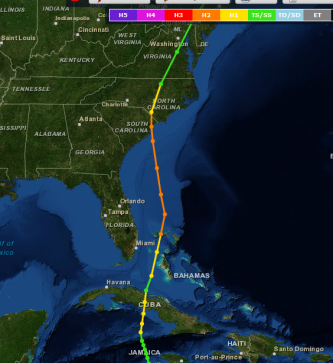
Maximum wind gusts reached 105 mph at the Wilmington International Airport, the second highest wind gust ever recorded in Wilmington and exceeded only by Hurricane Helene's 135 mph gust in 1958. Other significant wind gusts from Florence included 106 mph at Cape Lookout, 105 mph at Fort Macon, 99 mph at Federal Point (New Hanover County), 92 mph in Scotts Hill (Pender County), 86 mph at Wrightsville Beach, and 72 mph on Oak Island. At landfall the barometric pressure in Wrightsville Beach was measured at 959.0 to 959.5 millibars by multiple weather stations. As bad as surge and wind impacts were, Florence will be remembered for its unprecedented inland flooding. While most portions of southeastern North Carolina and northeastern South Carolina picked up between 12 and 25 inches of rain, local amounts up to 35 inches fell across parts of Bladen and Robeson counties. Catastrophic flash flooding resulted in property damage and fatalities in places where significant flooding had never been known to occur. Deep water isolated many communities including the towns of Atkinson and Kelly. As major highways flooded, Wilmington was cut off from the outside world for several days. All-time river crests were broken in the week to 10 days after the storm along the Cape Fear, Northeast Cape Fear, Lumber, and Waccamaw Rivers. Florence is now the wettest hurricane and wettest single weather event in Wilmington's history, dropping a storm total of 23.02 inches at the airport. Florence's rainfall helped make 2018 the wettest year by far in Wilmington with over 102 inches of rain. Florence was also responsible for 17 confirmed tornado touchdowns across northeastern South Carolina and southeastern North Carolina. One of the most damaging of these tornadoes hit the Sydney community in Columbus County producing winds estimated at 105 mph which damaged at least eight structures and a large area of trees. Early in its life on September 6th, Florence reached 25 degrees north latitude while still only halfway across the Atlantic Ocean. No other storm in history has ever moved so far north so quickly, yet still made landfall along the U.S. East Coast. The reason for Florence's bizarre track was an exceptionally strong and long-lived ridge of high pressure over the northern Atlantic Ocean which maintained a deep easterly steering pattern for the storm. Once Florence made landfall, the steering currents weakened significantly, leading to slow movement and torrential rainfall. |
|
Track of Hurricane Florence |
|
|
NWS Wilmington: Hurricane Florence detailed storm summary The News Reporter (Columbus County, NC): Lake Damage Worse Than Floyd Southeast Farm Press: Ag Losses Estimated at over $1 Billion in North Carolina NOAA Remote Sensing Division: Emergency Response Imagery from Hurricane Florence |
|
Storm #3: 1960 Hurricane Donna Pressure: 28.41"The fifth storm of the 1960 Hurricane Season |
|
|
|
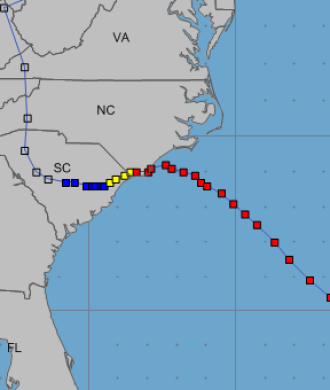
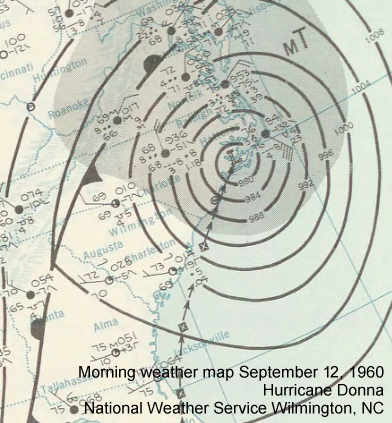
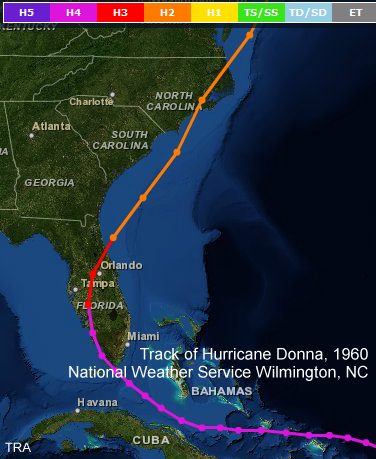
Date: September 11, 1960Lowest Pressure: 28.41 inches of Mercury, 962.1 millibars
Hurricane Donna was a classic, long-tracked Cape Verde storm that developed from a tropical wave that moved off the African coast in late August, 1960. Donna became a tropical depression on August 29th and a tropical storm on August 30th while less than 1000 miles west of the African coast. After becoming a hurricane during the morning of September 1st, Donna went through a period of rapid intensification culminating in a 155 mph wind speed on September 5th while about 500 miles east of the Windward Islands. Donna curved northwestward and crossed the northernmost Leeward Islands around midnight on September 5th dealing St. Martin, Anguilla, and St. Thomas a devastating blow. Donna passed through the southern Bahamas on September 7th, then turned northwest and hit the northern Florida Keys on September 10th with maximum sustained winds around 130 mph. Donna completed a clockwise turn across central Florida on September 11th and accelerated toward a North Carolina landfall during the morning of September 12th as a category 2 hurricane with 105 mph winds. In Wilmington Donna's highest wind gust was 97 mph at 11:55 p.m. on September 11th. Rainfall totaled 6.26 inches. A report from the Weather Bureau office in Wilmington said tides at Wrightsville Beach and Topsail Beach reached 7 to 8 feet above normal. The eye was said to be very large: 50 to 75 miles in diameter. (Note: this sounds very similar to the large eyes observed with Hurricane Isabel in 2003 and Hurricane Ophelia in 2005) People on "New" Topsail Beach observed 16 foot surf with a 20 second wave periods and wind gusts around 100 mph. In "Ocean Drive Beach" (now part of North Myrtle Beach) wind gusts were also reported near 100 mph with 11 inches of rain. Donna produced several tornadoes in the eastern Carolinas including a touchdown near Charleston and several across rural eastern North Carolina. |
|
|
|
|
Weather Bureau Wilmington office: Preliminary report on Hurricane Donna Weather Bureau Wilmington office: Report on Hurricane Donna Weather Bureau Charleston, SC office: Memorandum on Hurricane Donna The Miami News: Killer Hurricane Just Won't Give Up (September 12, 1960) |
|
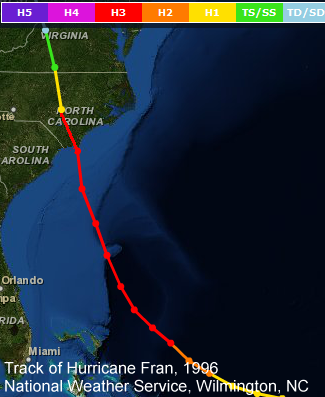
Storm #2: 1996 Hurricane Fran Pressure: 28.39"The sixth storm of the 1996 Hurricane Season |
|
|
|
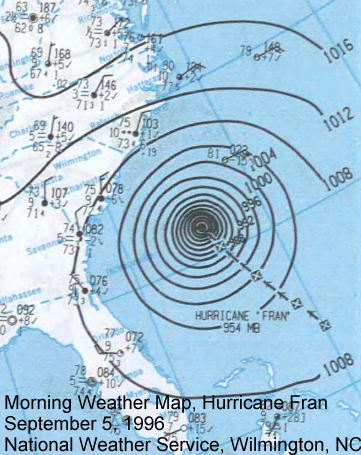
Date: September 5, 1996Lowest Pressure: 28.39 inches of Mercury, 961.4 millibars
Hurricane Fran was the second of four strong hurricanes to strike Southeastern North Carolina during the mid to late 1990s. In July 1996 Hurricane Bertha hit the area hard. Fran reopened Bertha's wounds and produced substantial wind damage well inland across Eastern North Carolina. In the same way that residents of Columbia and Charlotte will always remember Hurricane Hugo's devastating winds, Raleigh (and most inland eastern North Carolina) citizens think of Fran when discussing what impacts an inland hurricane can bring. Fran was a classic long-tracked Cape Verde hurricane that began its life as a strong tropical wave moving off the African coast on August 22nd. Within just one day of moving offshore Fran's thunderstorms organized sufficiently to become a tropical depression. Fran didn't strengthen into a tropical storm until halfway across the Atlantic on August 27th, and later became a hurricane while about 500 miles east of the Windward Islands on August 28th. Curving well north of the Caribbean Islands and the Bahamas, Fran moved northwestward toward the Southeastern U.S. coast while gradually strengthening into a category 3 hurricane with maximum sustained winds of 120 mph while about 400 miles off the Florida east coast. Fran then turned north and made landfall near Southport during the evening of September 5th with 115 mph winds and a total storm tide as high as 11 feet at Wrightsville Beach and 12 feet on Bald Head Island. A barometer in Southport measured a pressure of 954 millibars, or 28.17 inches. At the Wilmington airport winds gusted to 86 mph, but gusts to 105 mph were measured at the State Port office along the Cape Fear River. The National Hurricane Center received unofficial reports of gusts to 125 mph at Wrightsville Beach and 137 mph along Hewlett's Creek in Wilmington. These unofficial readings were from instruments mounted at non-standard heights very close to rooflines and were not deemed accurate. Multiple reports of gusts 73-77 mph were received from the coast of Horry County, SC. Storm total rainfall in Wilmington was 5.23 inches which includes 0.75 inches that fell on September 4th. Fran killed 22 people and produced over $1.6 billion in insured property damage in the United States, the vast majority of that in North Carolina. On North Topsail Beach, Hurricane Bertha had destroyed the police department building earlier in the summer, then Fran destroyed the temporary building. New Hanover County officials estimated Fran generated four times as much storm debris as Bertha did. Johnnie Mercer's pier on Wrightsville Beach was destroyed, and the Oceanic Restaurant's pier lost about one-third of its length. In Kure Beach, Bertha destroyed the fishing pier, then Fran damaged the tackle shop that remained. |
|
|
|
|
NWS Wilmington: Hurricane Fran detailed Storm Summary NWS Raleigh: Hurricane Fran Summary Wilmington-Star News: Massive Cleanup Begins, 12 Dead (September 7, 1996) Wilmington Star-News: Inland, Rain Piled Up to Flood Neighborhoods (September 7, 1996) Wilmington Star-News: Infographic of Damage Around the Area (September 7, 1996) |
|
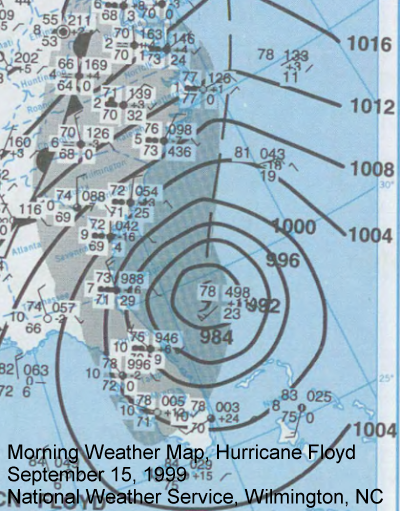
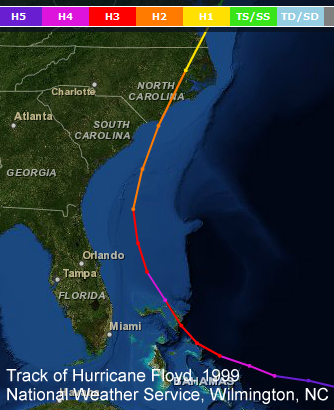
Storm #1: 1999 Hurricane Floyd Pressure: 28.34"The sixth named storm of the 1999 Hurricane Season |
|
|
|
Date: September 16, 1999Lowest Pressure: 28.34 inches of Mercury, 959.7 millibars
Hurricane Floyd is the most powerful storm ever to directly strike Wilmington as measured by barometric pressure. Floyd was the last of four strong Cape Fear hurricanes of the 1990s and dealt Eastern North Carolina an historic impact with deadly flooding that extended north into eastern Virginia and the Mid-Atlantic region. While Fran will be remembered for wind, Floyd went down in history for rain and flooding. Floyd developed from a tropical wave, first attaining tropical depression status on September 7th. After becoming a tropical storm on September 8th and a hurricane on September 10th, Floyd strengthened into a category 3 hurricane while about 400 miles north of Puerto Rico on September 12th. Floyd's winds reached 155 mph on September 13th while just north of the southeastern Bahamas, but fortunately the storm weakened as it moved through the northernmost Bahamas on September 14th and turned north toward the Carolinas. Landfall was near Bald Head Island early in the morning of September 16th as a category 2 storm with maximum sustained winds near 105 mph. Floyd was preceded earlier in the month by Hurricane Dennis. Dennis was a category 1 hurricane at landfall just north of Cape Lookout on September 4th with generally minor wind and surge, but it dropped 6 to 18 inches of rain across Eastern North Carolina. Floyd's 12 to 24 inches of rain therefore fell on saturated soil, producing flooding unprecedented both in its severity and scope. The Northeast Cape Fear River at Burgaw crested 12 feet above flood stage. The Tar River at Greenville rose 16 feet above flood stage, while upstream at Tarboro it crested 22 feet above flood stage. Huge swaths of land across Eastern North Carolina and Virginia well outside of established flood plains were inundated for days or weeks. Major highways including portions of Interstate 40 were flooded and impassible, delaying the anxious return of residents who had evacuated before the storm. In Wilmington winds gusted to 86 mph at the ILM airport, the same as in Hurricane Fran. An unofficial peak wind gust of 120 mph was measured at the City of Wilmington's Emergency Operations Center, and at Wrightsville Beach 138 mph winds were unofficially measured at an elevation of eight stories above ground level. Floyd killed 57 people, 35 in North Carolina alone. Insured losses from Hurricane Floyd totaled $1.32 billion dollars, with perhaps twice that total in uninsured flood-related damage. The USGS calculated Floyd's flooding to have an expected return interval of at least 500 years on some rivers in Eastern North Carolina. Truly one for the record books. |
|
|
|
|
NWS Wilmington: Detailed Hurricane Floyd Storm Summary National Hurricane Center: Hurricane Floyd Preliminary Report NWS Weather Prediction Center: Hurricane Floyd Rainfall Summary NWS Raleigh: Hurricane Floyd Summary USGS: Hydrologic Impact from Hurricanes Dennis and Floyd, Sep-Oct 1999 Wilmington Star-News: Heavy Flooding Clogs Roadways (September 17, 1999) Wilmington Star-News: Flooding Cuts Routes into Southeastern North Carolina (September 18, 1999) Wilmington Star-News: Small Towns Submerged After Storm (September 19, 1999) Wilmington Star-News: Floyd Takes Massive Toll on Tobacco, Livestock (September 19, 1999) Wilmington Star-News: Huge Swath Submerged; Rescuers Save Hundreds (September 20, 1999) Wilmington Star-News: Concern Mounts over Sewage, Carcasses (September 21, 1999) |
|
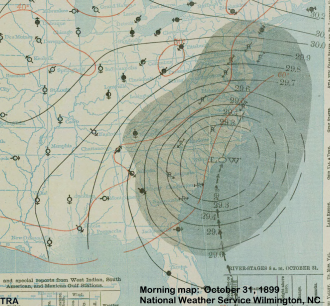
Honorable Mention: 1899 Hurricane “Nine” Pres: 29.13"The ninth storm of the 1899 Hurricane Season |
|
|
|
Date: October 31, 1899Lowest Pressure: 29.13 inches of Mercury, 986.5 millibars
A tropical storm formed on October 26, 1899 just south of Jamaica in the Caribbean Sea. The storm became a hurricane during the morning of October 28th less than 24 hours before crossing central Cuba. The Cuban landmass weakened the storm only temporarily, and “Nine” quickly regained hurricane status and became a category two storm while in the Bahamas the night of October 29th. Moving steadily northward, the hurricane made landfall in the morning on Halloween 1899 with maximum sustained winds near 110 mph. The landfall point of the storm is uncertain; the "official" track analysis shows a landfall along the South Carolina coast near Garden City Beach, SC. The operational weather maps produced by the U.S. Weather Bureau in real-time suggested a landfall position closer to Cape Fear, NC. Historical research by NWS meteorologist James Hudgins indicates the worst damage and highest storm surge occurred north of Cape Fear at Wrightsville Beach which supports the more eastern landfall position. "At Wrightsville Beach [water was] eight feet above normal high tide and two feet higher than in the August hurricane... Water came over the wharves in Wilmington and flooded some streets and there was much flooding and damage in New Bern, Morehead City, and Beaufort." In Wilmington, Hurricane “Nine” dropped 1.45 inches of rain, and produced the twenty-first lowest barometric pressure ever recorded. |
|
|
|
|
Hudgins, James E.: Tropical Cyclones Affecting North Carolina Since 1586, an Historical Perspective |
|
Page Author: Tim Armstrong
Document Created: September 9, 2013
Last Updated: January 10, 2019


 Coastal Flood
  Follow us on YouTube