Mouse over each site to display hydrograph.
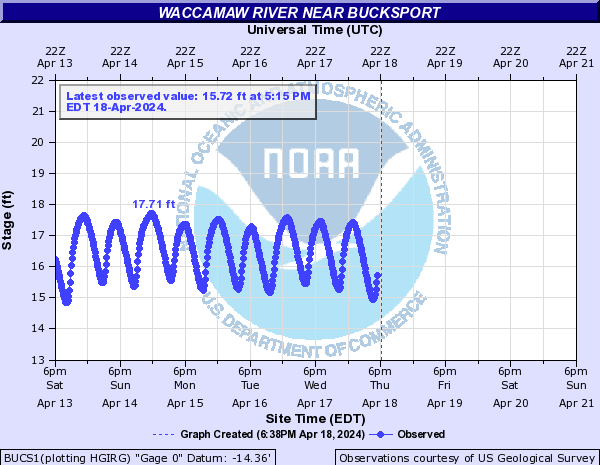
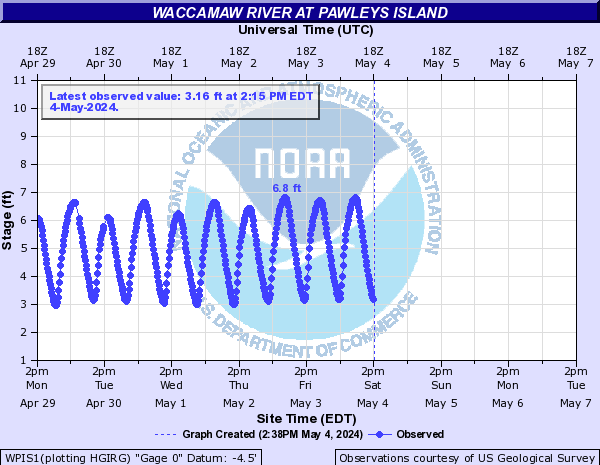
Hydrographs (showing stages and flows over time) are available through AHPS (Advanced Hydrologic Prediction Service) by clicking site names.
While this table is produced from quality controlled data, the table itself is not quality controlled. Please see the AHPS page for your gage(s) of interest for the latest water levels and trends.
| No Flood |
Near Flood |
Minor Flood |
Moderate Flood |
Major Flood |
|
|
​​ | River Conditions at: 4:30 PM 05/24/2024 |
Location | Flood
Stage (ft.) | Observed
(ft.) | 24-Hr
Change | Crest (ft.) | Forecast for 8AM | | Sat. | Sun. | Mon. | Tue. | | Cape Fear River | | 42 | 36.05 | -0.7 | - | - | - | - | - |
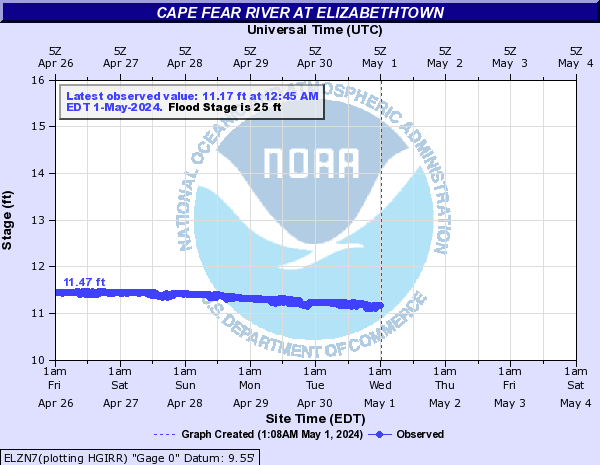
| 25 | 14.25 | -1.5 | - | - | - | - | - |
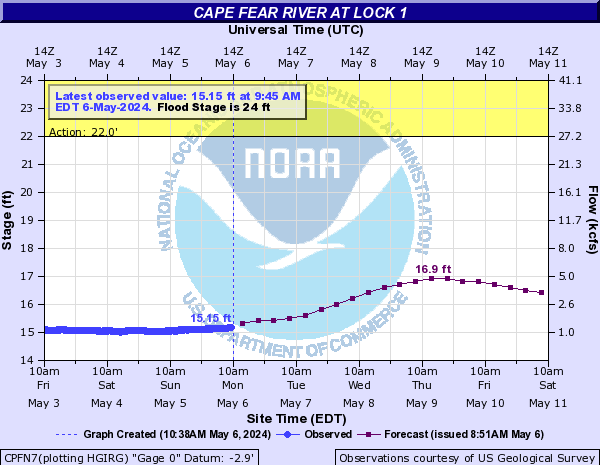
| 24 | 17.91 | -0.9 | 17.91 | 17.3 | 16.8 | 16.3 | 15.9 |
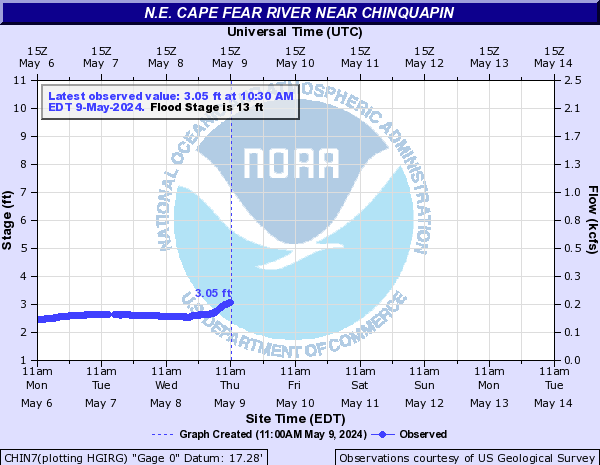
| Northeast Cape Fear River | | 13 | 3.43 | -0.4 | - | - | - | - | - |
| 10 | 3.01 | -0.3 | - | - | - | - | - |
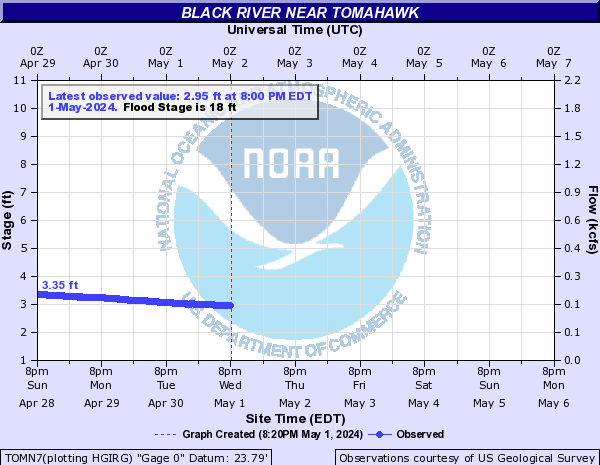
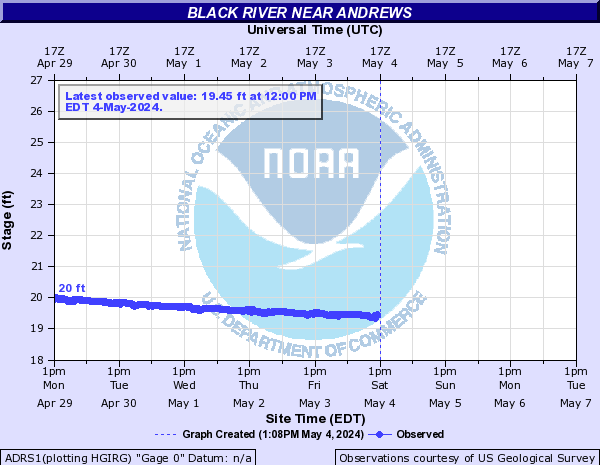
| Black River NC | | 18 | 3.96 | -0.2 | - | - | - | - | - |
| - | 2.41 | -0.1 | - | - | - | - | - |
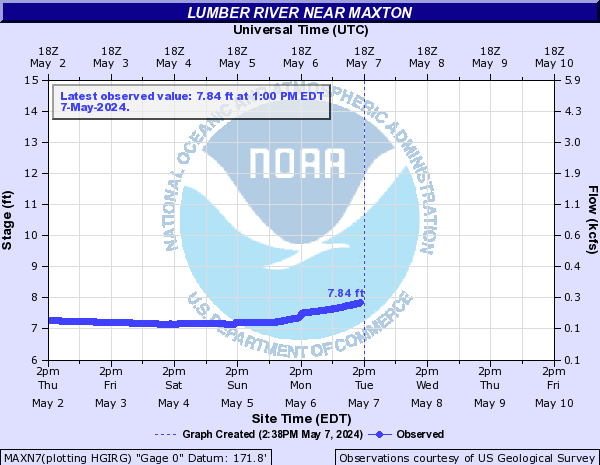
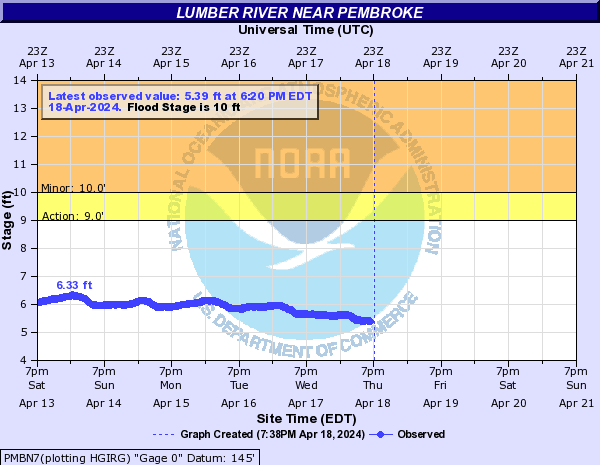
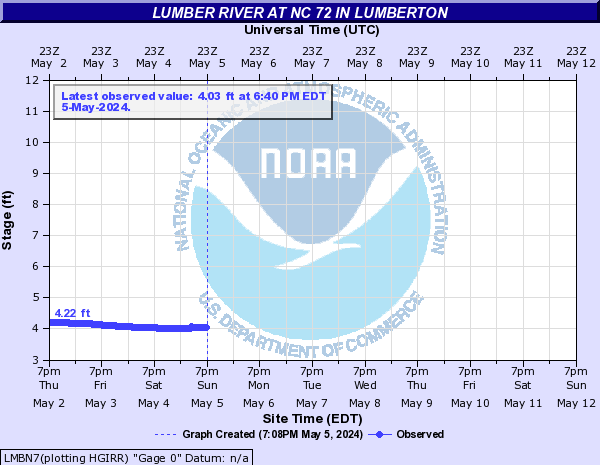
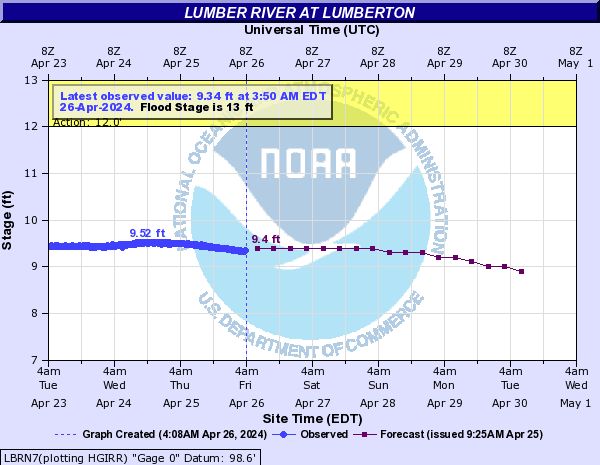
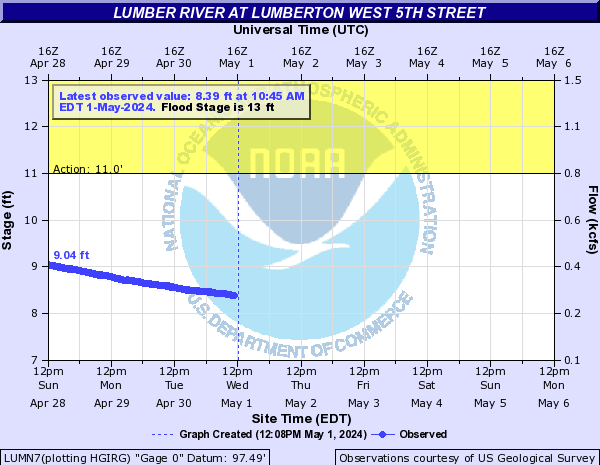
| Lumber River | | - | 9.10 | -0.2 | - | - | - | - | - |
| 10 | 7.31 | -0.1 | - | - | - | - | - |
| - | 7.11 | +0.1 | - | - | - | - | - |
| 13 | 11.31 | - | 11.4 | 11.3 | 11.1 | 10.8 | 10.5 |
| 13 | 10.79 | +0.1 | - | - | - | - | - |
| - | 5.46 | 0.0 | - | - | - | - | - |
| - | 7.29 | -0.3 | - | - | - | - | - |
| 20 | 16.17 | -0.3 | - | - | - | - | - |
| Black Creek | | - | 3.55 | +0.1 | - | - | - | - | - |
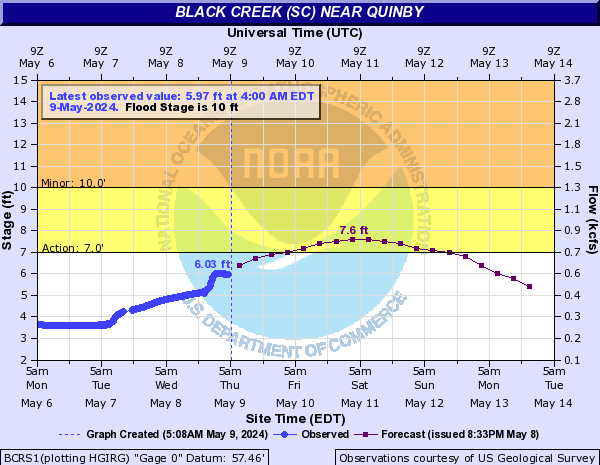
| 10 | 3.90 | -0.8 | 4.9 | - | - | - | - |
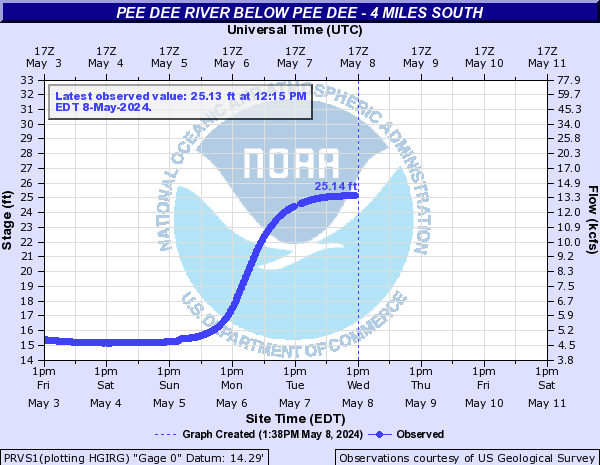
| Great Pee Dee River | | 15 | 3.49 | +0.4 | - | - | - | - | - |
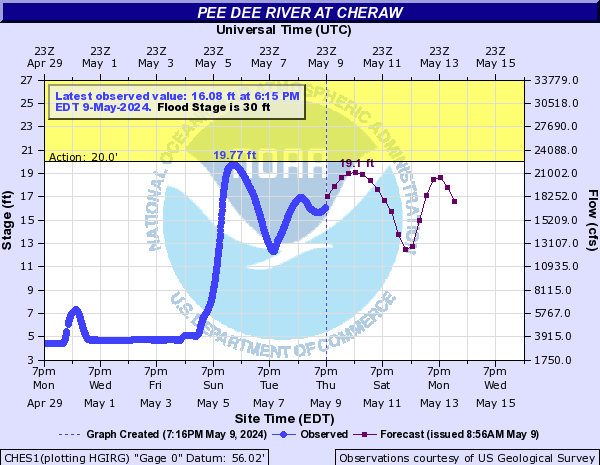
| 30 | 7.68 | +1.0 | 9.8 | 9.2 | 9.7 | 5.0 | 3.9 |
| - | 60.14 | +0.9 | - | - | - | - | - |
| - | 43.35 | -2.3 | - | - | - | - | - |
| 19 | 17.57 | -1.8 | 17.7 | 17.1 | 16.0 | 15.3 | 12.5 |
| - | 25.73 | -1.3 | - | - | - | - | - |
| - | 24.10 | -0.3 | - | - | - | - | - |
| - | 13.73 | +0.2 | - | - | - | - | - |
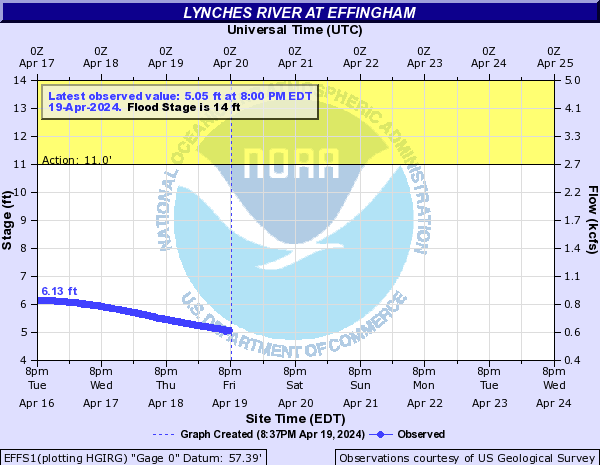
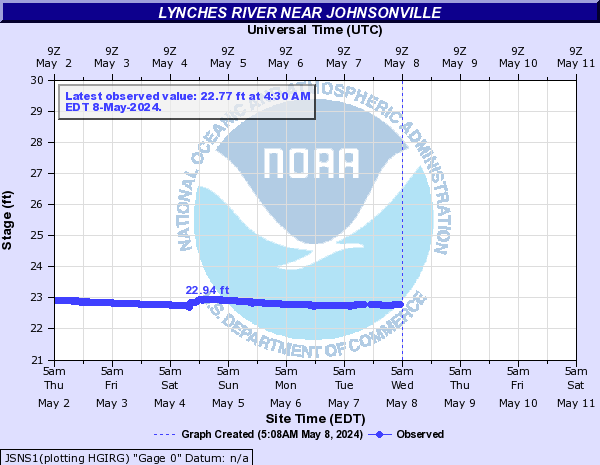
| Lynches River | | 14 | 7.26 | -0.6 | - | - | - | - | - |
| - | 23.93 | -0.1 | - | - | - | - | - |
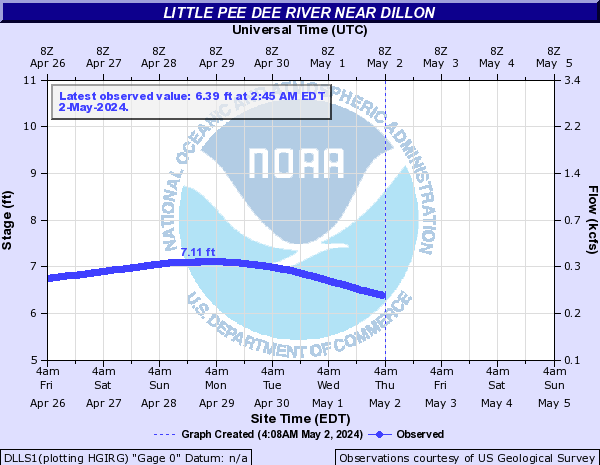
| Little Pee Dee River | | - | 7.42 | -0.1 | - | - | - | - | - |
| 9 | 7.18 | 0.0 | 7.2 | 7.1 | 7.1 | 7.0 | 7.0 |
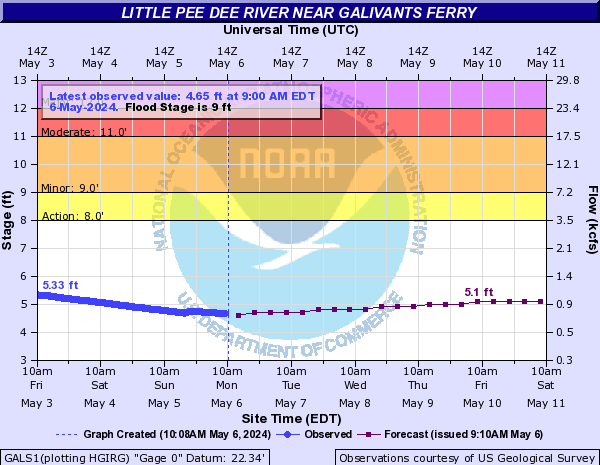
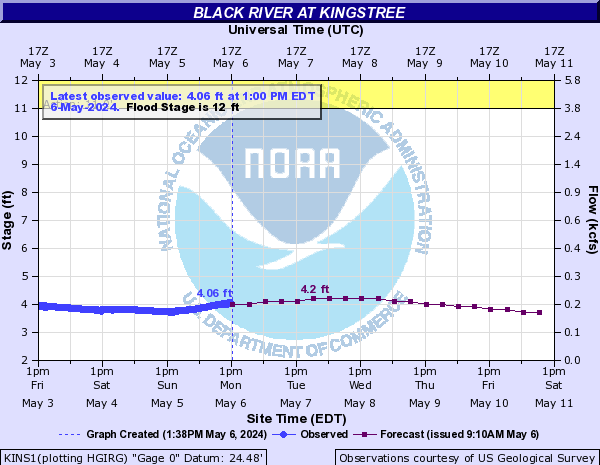
| Black River SC | | 12 | 4.68 | -0.3 | 4.7 | 4.7 | 4.7 | 4.6 | 4.4 |
| - | 19.79 | -0.1 | - | - | - | - | - |
| - | 15.67 | -0.4 | - | - | - | - | - |
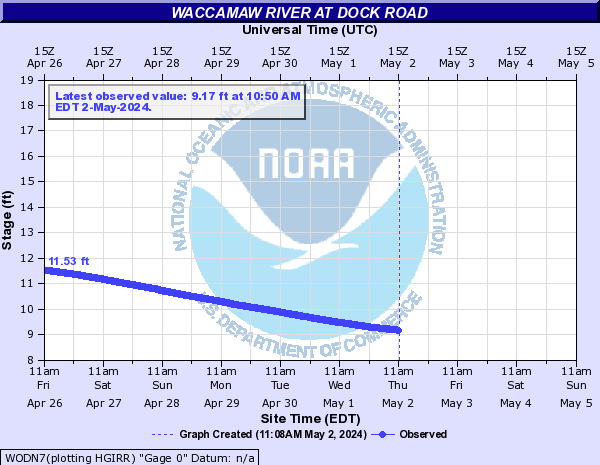
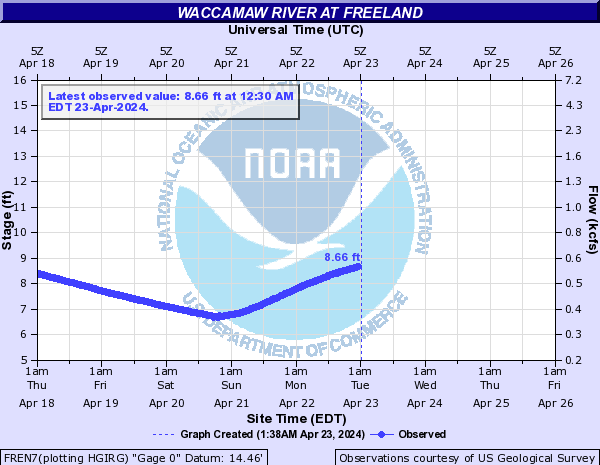
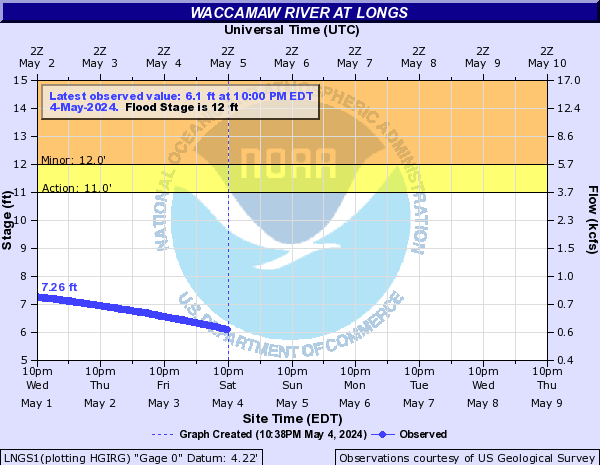
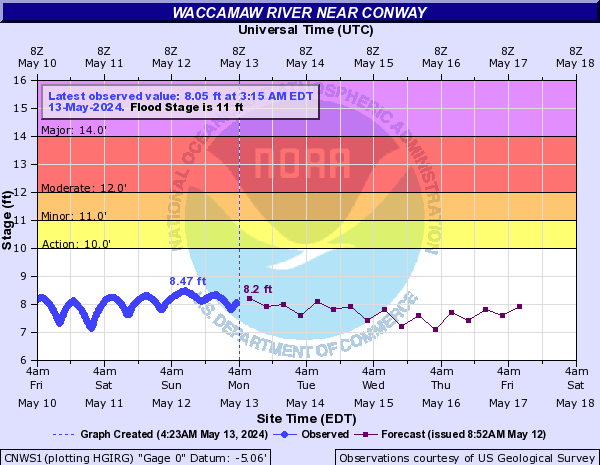
| Waccamaw River | | - | 9.92 | +0.4 | - | - | - | - | - |
| - | 5.67 | 0.0 | - | - | - | - | - |
| 12 | 4.83 | -0.3 | - | - | - | - | - |
| - | 11.52 | -0.2 | - | - | - | - | - |
| - | 2.47 | -0.2 | - | - | - | - | - |
| 11 | 8.43 | -0.1 | 8.6 | 8.6 | 8.5 | 8.5 | 8.5 |
| - | 17.35 | -0.2 | - | - | - | - | - |
| - | 4.31 | -0.3 | - | - | - | - | - |
|


 Coastal Flood