|
Wilmington, Florence, and Lumberton: 2025 Average Temperatures Were the Coolest In 11 Years Significant January Snowstorm: Largest Snow in Myrtle Beach in 35 Years Tropical Storm Chantal Landfall on July 6 |
From a major snowstorm in January to a tropical storm in July, the eastern Carolinas saw a wide variety of weather events during 2025.
From a climate perspective, the six month period February through July ran well above normal and was the first or second warmest over the past decade. However, below normal temperatures began in August as persistent upper level low pressure sat across the Southeast states. This knocked annual average temperatures down to the coolest observed over the past 11 years.
|
|
 |
Persistent upper level low pressure over the Southeast starting in August led to below normal temperatures across the Carolinas
Top Ten Local Weather Events of 2025 (in chronological order)
1) January 21-22: Winter Storm
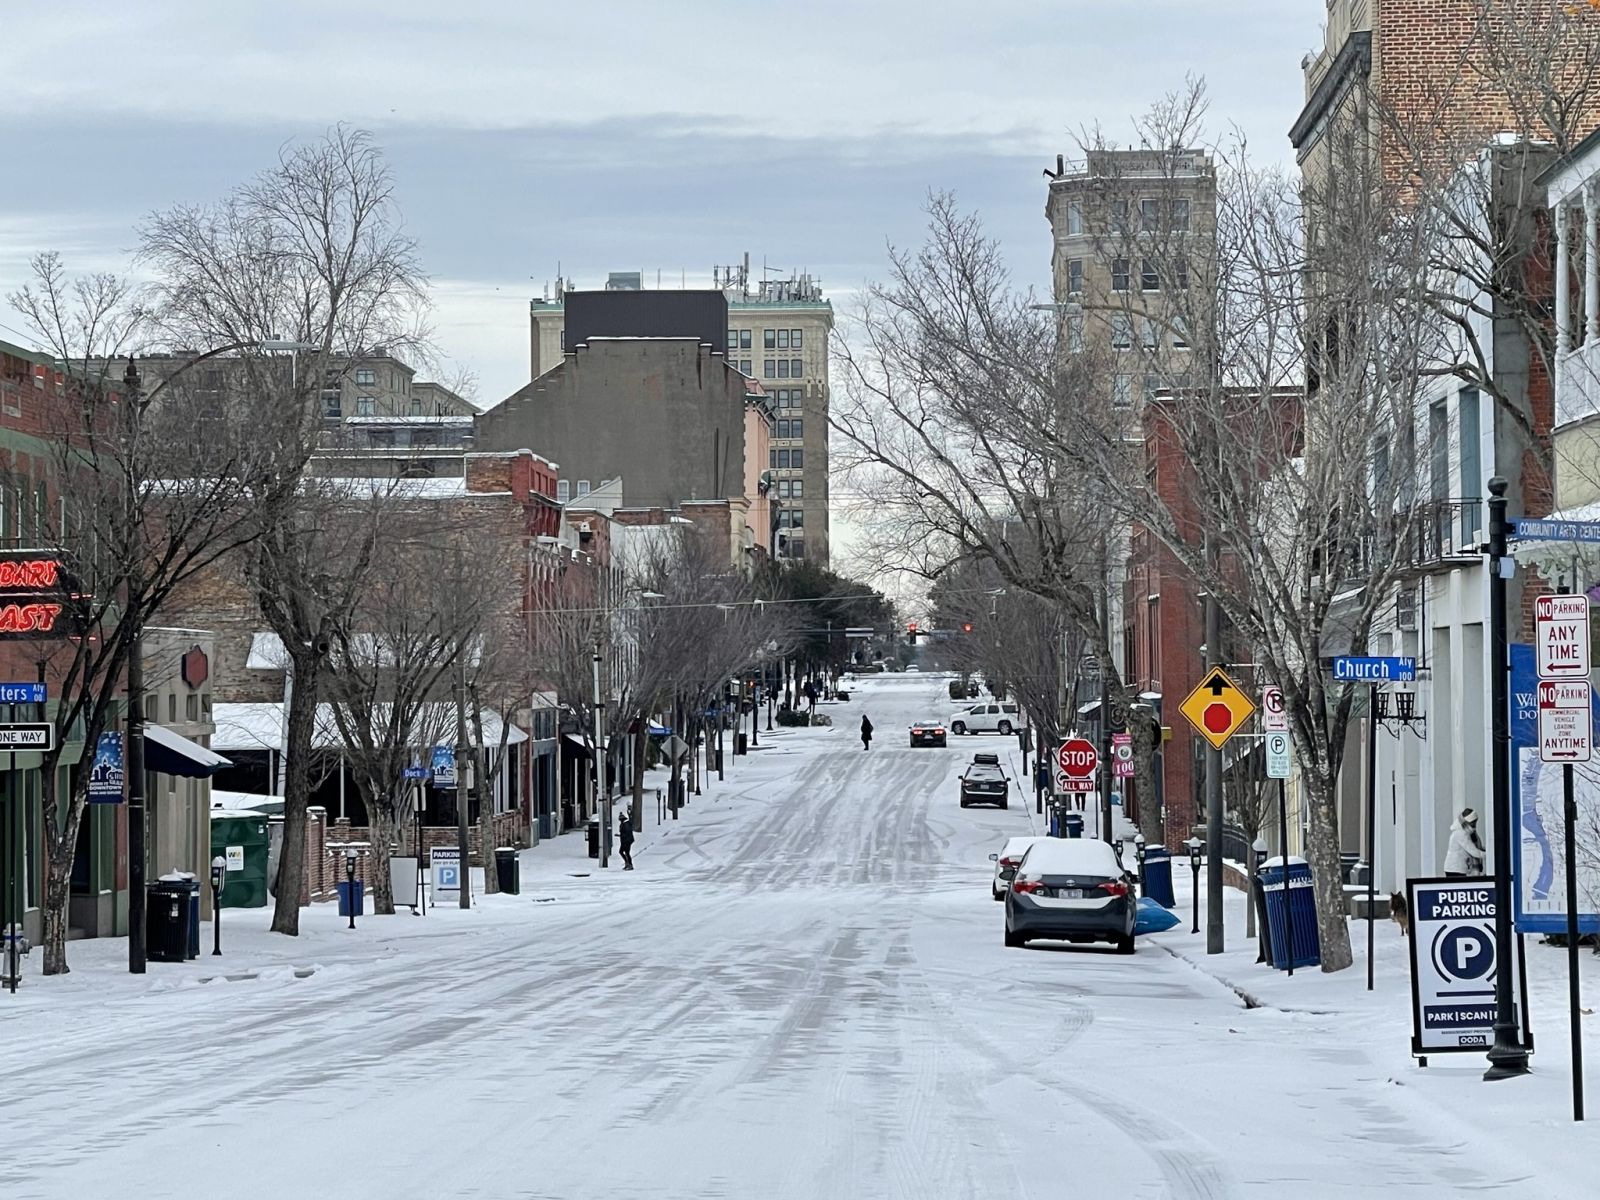
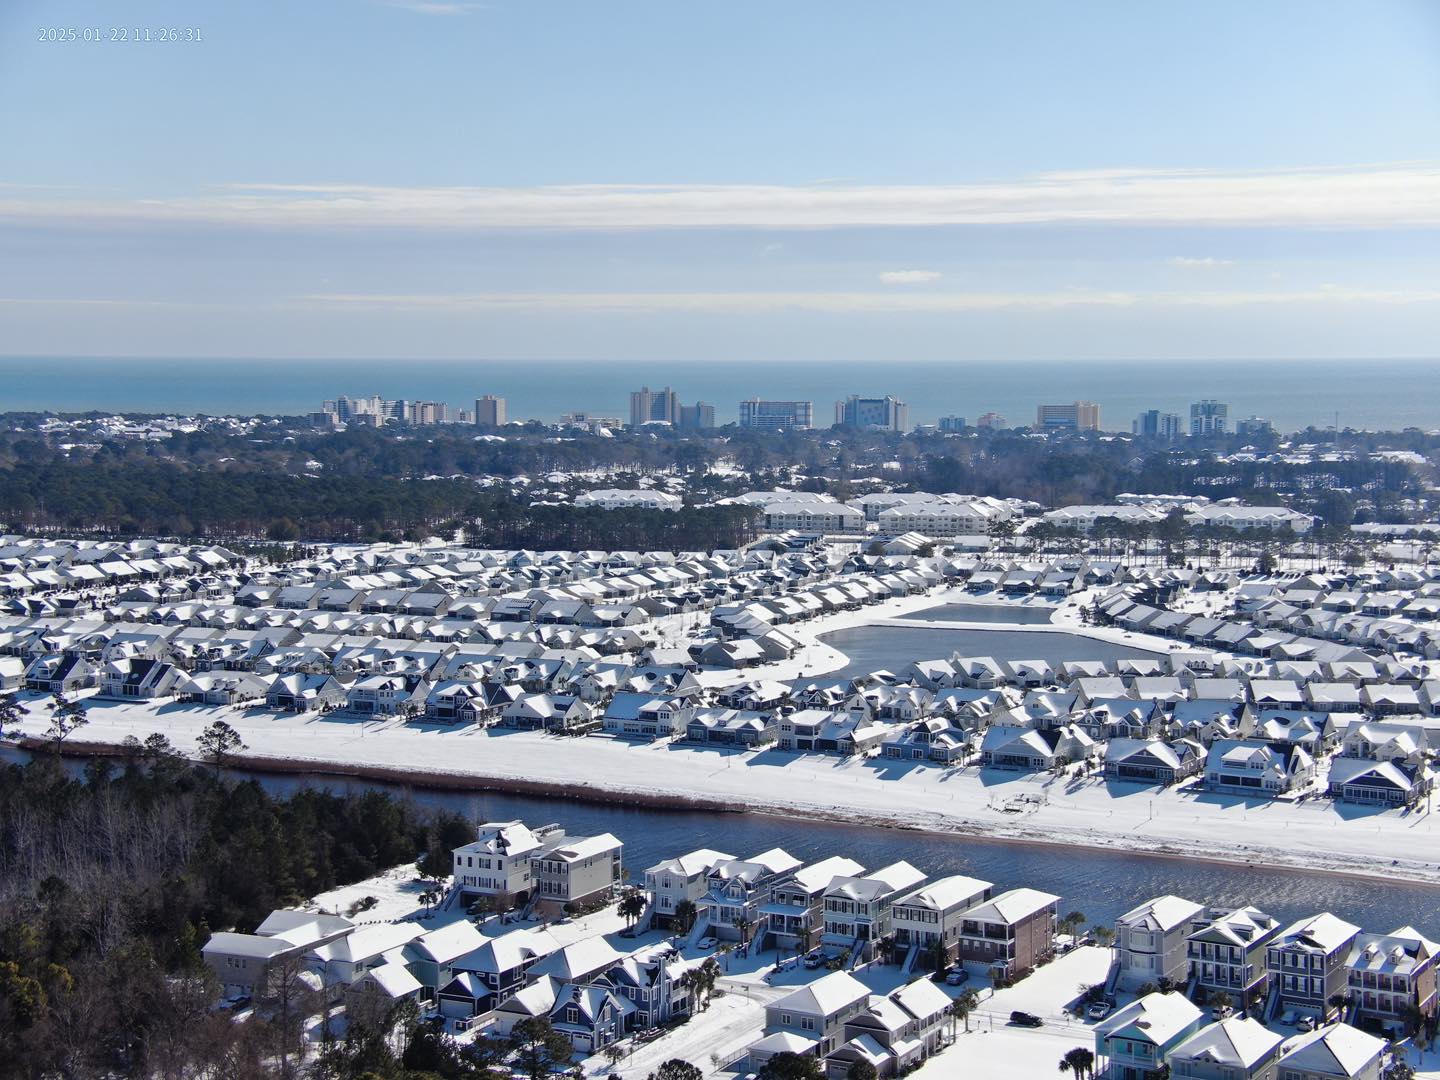
Low pressure to our south and an arctic airmass overhead led to one of the most significant snowstorms in years for portions of the coastal Carolinas. Snow began during the afternoon of January 21 and continued through the night, ending during the morning of January 22. In Myrtle Beach this was the city's largest snowstorm in 35 years, dating back to the unforgettable Christmas 1989 snowstorm. Snowfall totals up to six inches were reported from a number of locations in Horry County, SC northward through Columbus and Bladen counties in North Carolina.
This was the same snowstorm that produced exceptional snow totals across coastal Georgia and the Gulf Coast. Around 10 inches of snow fell in New Orleans, LA and 7.5 inches in Mobile, AL. Baton Rouge, LA measured 7.6 inches, the city's snowiest single day on record.
|
Southeastern Regional Snow Depth analysis for January 22, 2025. Click here to view interactive map |
|
Snowy streets in downtown Wilmington |
Snow covers Myrtle Beach, SC |
| Location | Snowfall | Location | Snowfall | |
| Kelly, NC (Bladen Co.) | 6.5" | Lake Waccamaw, NC (Columbus Co.) | 6.5" | |
| Bolivia, NC (Brunswick Co.) | 6.0" | Whiteville, NC (Columbus Co.) | 6.0" | |
| Loris, SC (Horry Co.) | 6.0" | Conway, SC (Horry Co.) | 6.0" | |
| 5 WNW Myrtle Beach, SC (Horry Co.) | 6.0" | 4 mi SSW Watha, NC (Pender Co.) | 5.3" | |
| 5 mi SW Orrum, NC (Robeson Co.) | 5.3" | White Lake, NC (Bladen Co.) | 5.0" | |
| Ocean Isle Beach, NC (Brunswick Co.) | 5.0" | Murrells Inlet, SC (Georgetown Co.) | 5.0" | |
| 5 mi SSE Wilmington, NC (New Hanover Co.) | 4.8" | Burgaw, NC (Pender Co.) | 4.5" | |
| Georgetown, SC (Georgetown Co.) | 4.5" | Scranton, SC (Florence Co.) | 4.2" | |
| 9 mi SSE Lumberton, NC (Robeson Co.) | 4.0" | Fork, SC (Dillon Co.) | 4.0" | |
| Mullins, SC (Marion Co.) | 4.0" | Kingstree, SC (Williamsburg Co.) | 4.0" | |
| Myrtle Grove, NC (New Hanover Co.) | 3.0" | Florence, SC (Florence Co.) | 2.5" | |
| 5 mi. E Sellers, SC (Marion Co.) | 2.5" | Dillon, SC (Dillon Co.) | 2.0" | |
| 5 mi. NNE Timmonsville, SC (Darlington Co.) | 1.9" | Darlington, SC (Darlington Co.) | 1.0" | |
| Tatum, SC (Marlboro Co.) | 1.0" | Clio, SC (Marlboro Co.) | 0.9" |
Temperatures during this snowstorm were exceptionally cold. In Wilmington early morning air temperatures on January 22 were measured at 22°F for three consecutive hours while snow was falling, the coldest temperature observed during any measurable precipitation since at least 1996.
Additional information on this snowstorm is available at https://www.weather.gov/ilm/WinterStormJan2025
2) March 1-June 4 Covington Drive Wildfire near Myrtle Beach
A wildfire started on March 1 near the Carolina Forest area of Myrtle Beach, burning 2,059 acres before being declared 100 percent contained on May 21. Although several structures were damaged by the fire in its first few days, there were no fatalities and no homes or businesses were destroyed. The fire ignited peat soil which had dried out due to recent drought and this ground fire continued to burn through early June before wetting rainfall extinguished the last hot spots.
Forecast and observed weather conditions on March 1 were extremely dangerous for outdoor burning. A Red Flag Warning issued by the NWS in Wilmington early in the morning of March 1 called for minimum relative humidity of 15 to 25 percent and wind gusts of 30 to 40 mph and included the warning message "Any fire that develops will catch and spread quickly. Outdoor burning is not recommended."
The fire grew to 1,600 acres within its first day due to gusty winds and dry weather conditions.
Dense smoke caused air quality issues. Evacuations were ordered in the nearby Avalon, Waterbridge and Walkers Woods neighborhoods.
|
News report from March 2, 2025, courtesy of ABC News |
3) March 16-17: Pender County Tornado and Cape Fear Waterspout
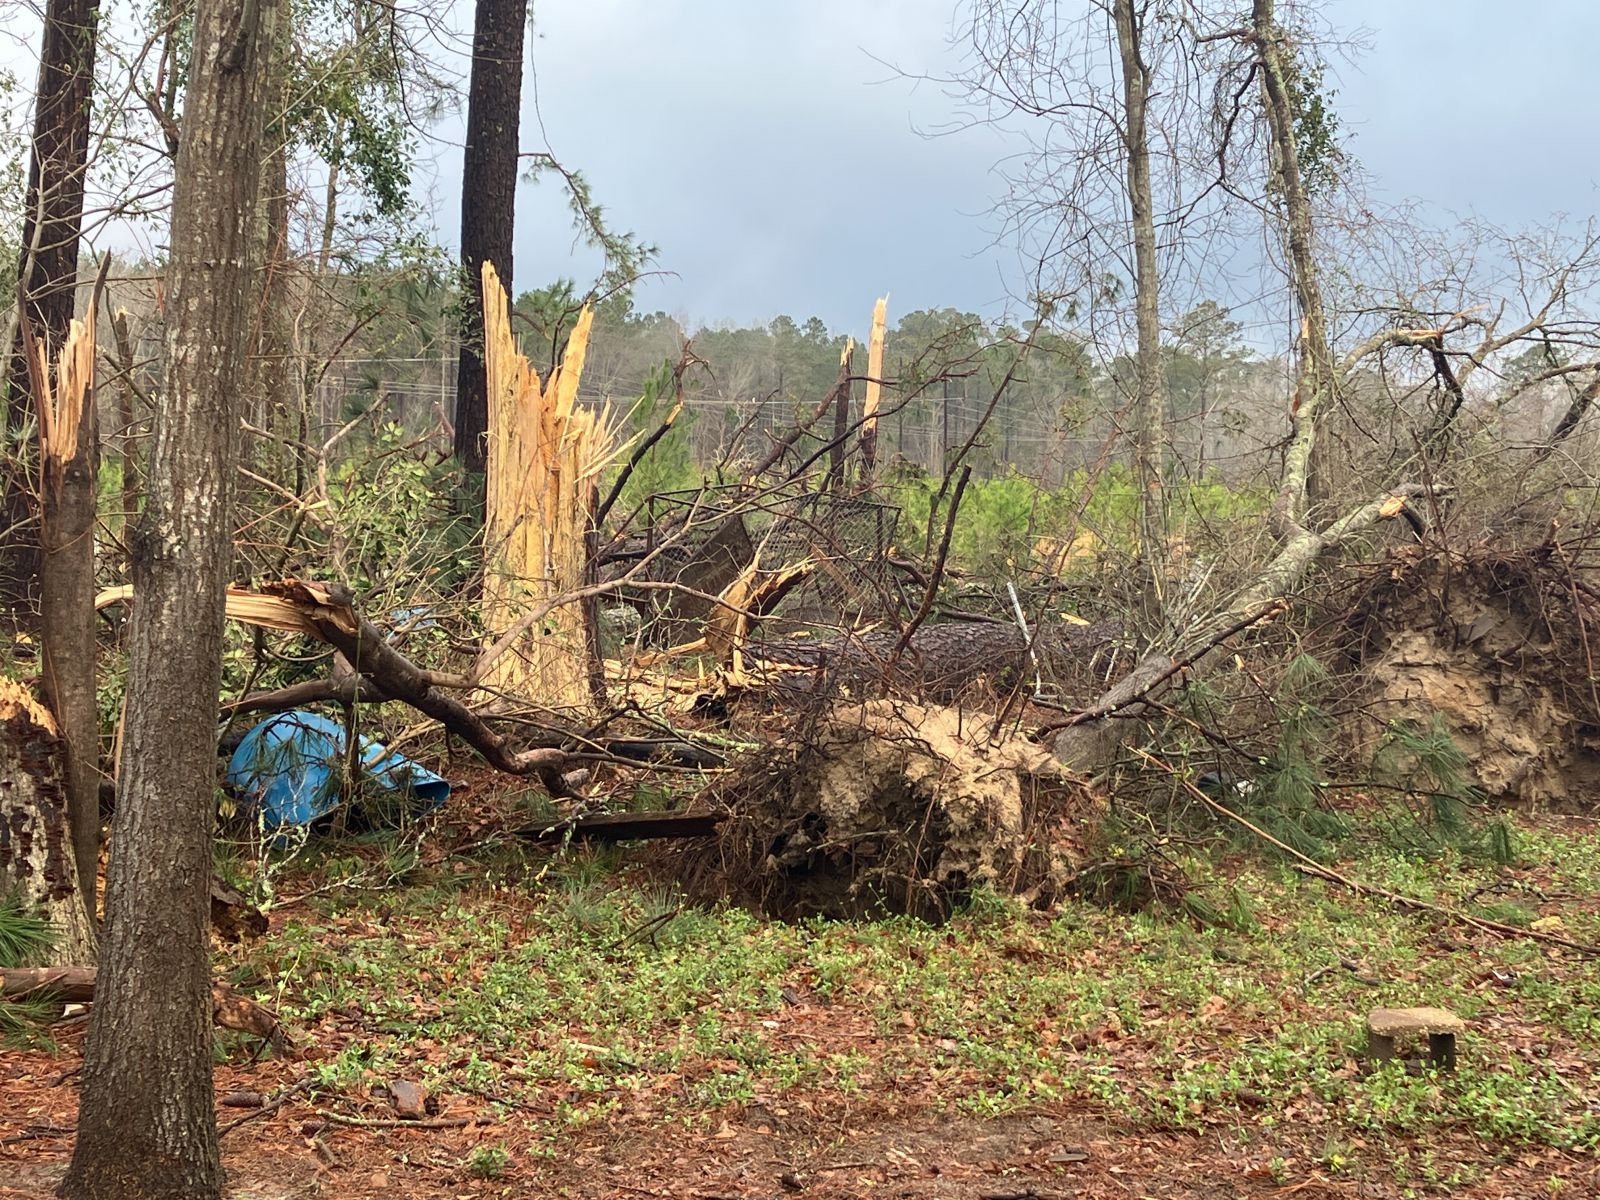
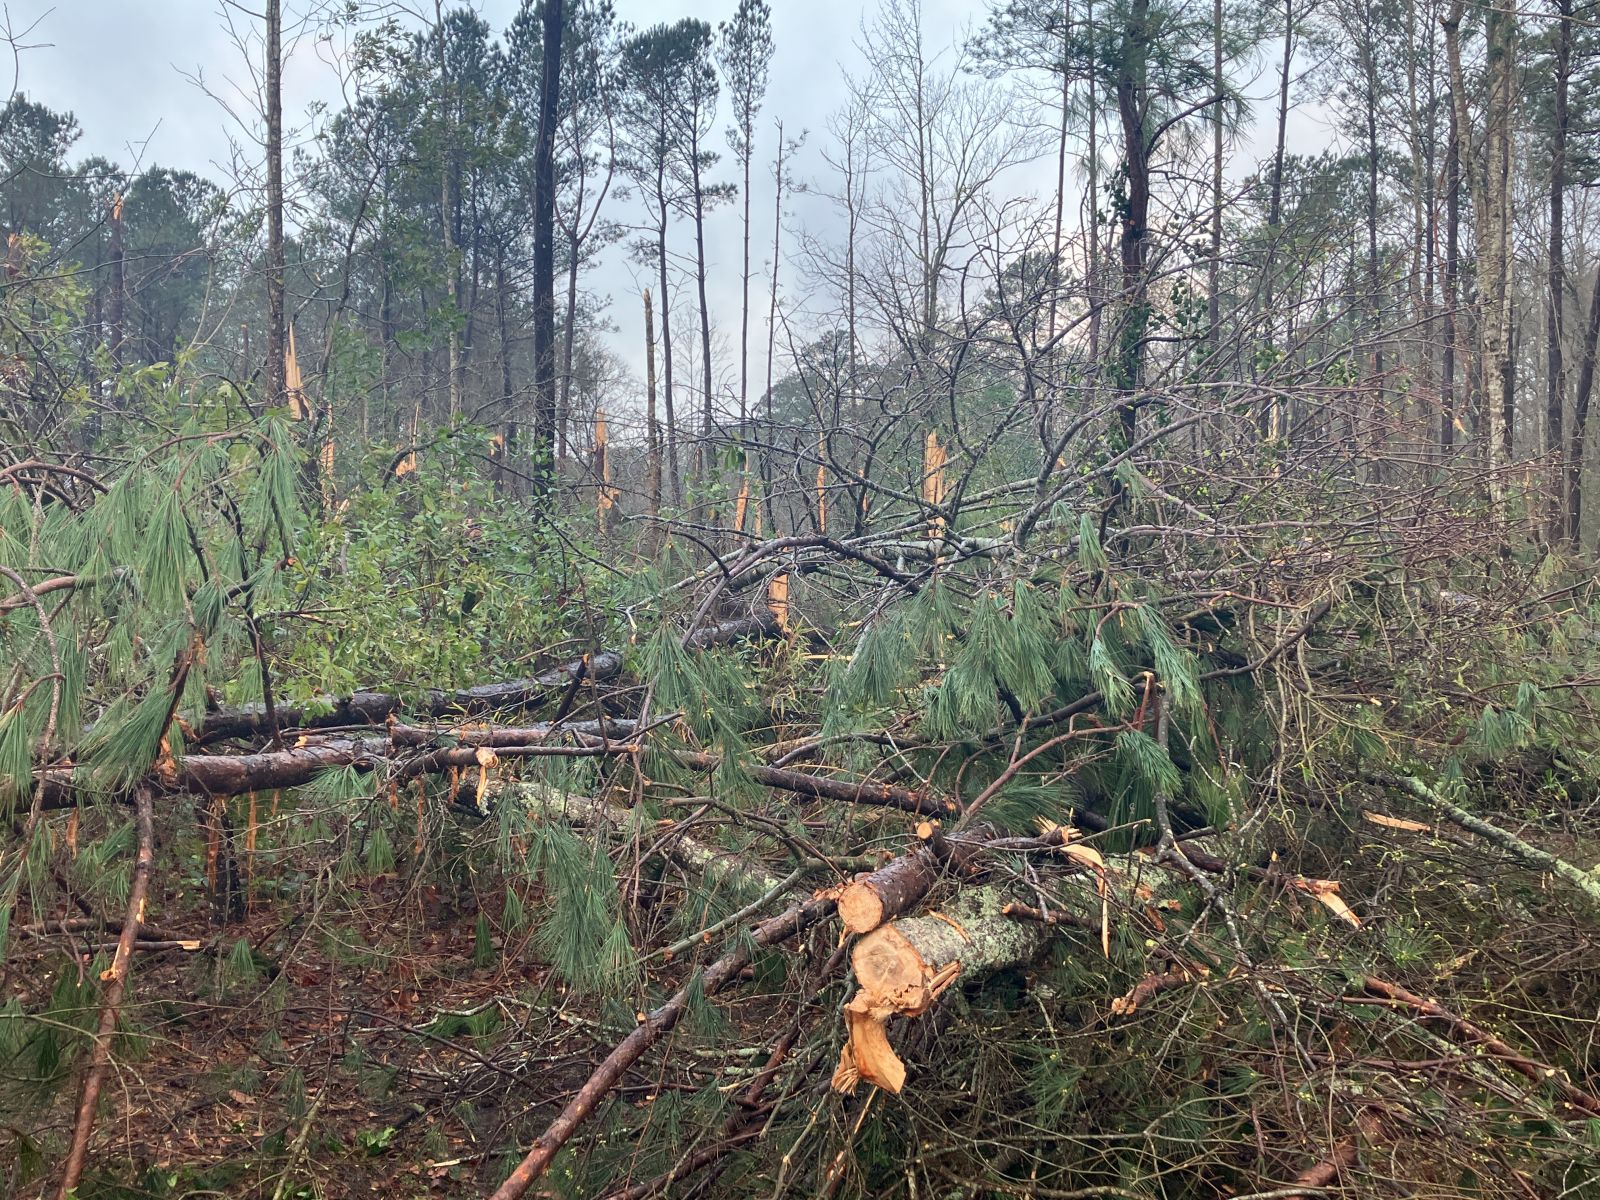
On March 16 a tornado touched down near Malpass Corner, about midway between Currie and Burgaw in Pender County, NC, producing a 3.15 mile long swath of damage to trees, roofs, and small outbuildings. Damage was first observed west of Herrings Chapel Rd about 4 miles east of Currie and was estimated to have occurred around 7:25 pm EDT. The tornado damaged a large number of trees and several dog kennels. The tornado crossed Herrings Chapel Rd. causing extensive tree damage. Roof damage to houses was observed along Fennell Town Rd. along with a few snapped and uprooted trees. The tornado dissipated north of Fennell Town Rd shortly after 7:28 pm.
A second round of thunderstorms developed across the coastal Carolinas on March 17. A long-lived waterspout formed over the lower Cape Fear River. Photographed by numerous people, the waterspout dissipated before reaching land.
|
Video shared with the NWS shows the slow-moving waterspout churning over the Cape Fear river shortly after 1:00 pm EDT. |
Additional information on this severe weather outbreak is available here: https://www.weather.gov/ilm/2025-03-16and17_SevereWeather
4) May 30: South Carolina Severe Thunderstorm Outbreak
|
Radar loop from the afternoon of May 30 |
A long-lived cluster of severe thunderstorms moved across South Carolina during the afternoon of May 30. Numerous reports of wind damage and strong winds over 58 mph occurred along a 200-mile long path from Augusta, GA to the coastal waters near Sunset Beach, NC.
Numerous trees and large tree limbs were blown down in Hemingway, SC. Damage was also observed to power lines, roofs, barns, carports, and at least one masonry church sign. Evidence for wind speeds around 90 mph was observed in a few spots. In all cases, fallen trees were pointing toward the east, implying damage was from straight-line thunderstorm wind and not a tornado.
Numerous reports of high winds and thunderstorm wind damage were also received from the Grand Strand area as storms swept through between 6:30 and 7:00 pm. North Myrtle Beach airport (CRE) and Myrtle Beach International Airport (MYR) recorded wind gusts of 58 and 59 mph, respectively. A NOAA anemometer on Springmaid Pier in Myrtle Beach measured 57 mph at 6:36 pm. Social media reports showed a large number of trees fell across roads.
Additional information on this severe weather outbreak is available at https://www.weather.gov/ilm/2025-05-30_SevereTstorms
5) June 25: Severe Thunderstorm Outbreak
More severe thunderstorms brought widespread damaging winds and several reports of large hail to portions of eastern North and South Carolina on June 25. This severe weather outbreak occurred during a heatwave with 100° inland temperatures and featured unusual storm movement from north to south.
Reports of large hail were received from St. Pauls and Clarkton, NC. As the cold outflow from these initial storms joined together, the entire mass of thunderstorms began to surge south and southwestward into South Carolina producing strong and damaging wind gusts along the way.
| Location | Wind Gust |
| Murrells Inlet, SC (Surfchex) | 56 mph |
| Florence, SC (Airport) | 55 mph |
| Sunset Beach, NC (CORMP buoy) | 54 mph |
| Futch Beach, SC (Weather Underground) | 53 mph |
| Winyah Bay Entrance, SC (Surfchex) | 51 mph |
| Southport, NC (Airport) | 48 mph |
| Whiteville, NC (Airport) | 48 mph |
Additional information about this severe weather outbreak is available at https://www.weather.gov/ilm/2025-06-25severeThunderstorms
6) July 5-6: Tropical Storm Chantal
Tropical Storm Chantal, the third named storm of the 2025 Atlantic hurricane season, made landfall near Litchfield Beach, SC around 4:00 AM EDT on July 6. The National Hurricane Center analyzed Chantal as having maximum sustained winds near 60 mph and a pressure of 1002 millibars at landfall. Along the coast of the Carolinas, wind gusts as high as 56 mph were measured at Springmaid Pier in Myrtle Beach. Rainfall amounts of 4 to 6 inches were measured in a swath extending from northern Horry County, SC through Whiteville and into the Lumberton and Red Springs areas in southeastern North Carolina.
|
GOES satellite imagery from July 5 to 6, 2025 showing Chantal's move inland across the Carolinas |
Regional composite radar loop showing Chantal's landfall on the South Carolina coast on July 6, 2025 |
One tornado associated with Chantal was confirmed to have developed in Wilmington. At 4:27 AM EDT on July 6 a tornado touched down in the Kings Grant community just east of the Wilmington airport. Wind speeds around 70 mph were estimated based on observed damage to trees, roofs, and siding material. The tornado was on the ground for over a mile.
| Location | Peak Wind Gust | Location | Peak Wind Gust | |
| Myrtle Beach-Springmaid Pier, SC | 56 mph | 3 mi SW Myrtle Beach, SC | 54 mph | |
| Huntington Beach State Park, SC | 52 mph | Winyah Bay, SC | 51 mph | |
| Frying Pan Shoals Buoy | 49 mph | Southport, NC | 48 mph | |
| 1 mi N. Atlantic Beach, SC | 48 mph | North Myrtle Beach, SC | 48 mph | |
| Oak Island, NC | 43 mph | Wrightsville Beach, NC | 41 mph | |
| Wilmington, NC | 40 mph | Marion, SC | 37 mph | |
| Florence, SC | 36 mph | Georgetown, SC | 33 mph |
Additional information on Tropical Storm Chantal's impacts on the area is available at https://www.weather.gov/ilm/Chantal2025
7) July 26-28: Heat Wave and 100°+ Temperatures
A heat wave developed across the Southeast late in July as a strong ridge of high pressure built overhead. Temperatures in Florence, SC exceeded 100° for three consecutive days, the first time that had happened since 2022.
When humidity was considered, maximum heat indices reached dangerous levels including 115° in Laurinburg, NC; 114° in Myrtle Beach, SC; 113° at Florence, SC; and 112° in Wilmington and Lumberton, NC. An Excessive Heat Warning was in effect throughout the heat event, advising residents of the anticipated dangerous conditions.
|
A strong upper level ridge sat over South Carolina on July 27. Sinking air enhanced hot temperatures. |
Highest observed temperatures during the July 26-28 heat wave included 104° in Darlington and Hartsville, SC; 103° in Florence, SC; and 102 in Elizabethtown, NC. |
| Location | High Temperature | Location | High Temperature | |
| Darlington, SC Airport | 104° | Hartsville, SC | 104° | |
| Florence, SC Airport | 103° | Darlington, SC (NWS coop) | 103° | |
| Chesterfield, SC (NWS coop) | 103° | Lumberton, NC Airport | 102° | |
| Laurinburg (NWS coop) | 102° | Fort Bragg, NC | 102° | |
| Elizabethtown, NC (NWS coop) | 102° | Lumber River State Park, NC | 101° | |
| Marion, SC (NWS coop) | 101° | Cheraw, SC (NWS coop) | 101° | |
| Moores Creek Nat'l Battlefield, NC | 99° | Castle Hayne, NC | 99° |
A Wilmington cooling shelter extended its operating hours to provide additional refuge from the heat. The North Carolina Department of Health and Human Services reported during the week of July 27 to August 2 there were 560 visits to emergency rooms across North Carolina due to heat related illnesses.
8) August 18-19: Rip Currents from Hurricane Erin
Swells generated by Hurricane Erin impacted the East Coast between August 18 and 22. Dangerous rip currents and large breaking waves resulted in a large number of swimmers rescued by lifeguards.
Locally, Surf City officials reported there were 15 surf rescues performed on August 18. Wrightsville Beach Ocean Rescue lifeguards reported 60 to 70 rescues, mainly between noon and 5:00 pm. The following day, August 19, an additional 15 rescues were reported from Wrightsville Beach. The town of Wrightsville Beach advised that swimming was not recommended on August 19 and 20 and lifeguards allowed only surfers into the water.
|
Wavewatch3 model wave height analysis for Hurricane Erin off the Southeast U.S. Coast for August 17-21, 2025. Red color near the core of the hurricane indicates wave heights of 40-50 feet. Wave heights up to 12.8 feet were reported from the Frying Pan Shoals buoy near Cape Fear. Imagery courtesy PacIOOS. |
Erin was a category five hurricane with maximum sustained winds near 160 mph while located just north of the Leeward Islands on August 16. Erin turned northward well before reaching the U.S. East Coast.
According to WECT news, Kure Beach saw minor beach erosion but the dunes were not damaged. Oak Island officials reported little erosion. Extensive coastal flooding and beach erosion occurred on portions of the North Carolina Outer Banks.
9) October 10-13: Coastal Storm/Georgetown, SC Flash Flood
An early season Nor'easter affected large portions of the East Coast including the Carolinas October 10 to 13, bringing strong winds, high tides, and heavy rainfall. Both flash flooding and coastal flooding occurred.
In downtown Georgetown, SC, upwards of 14 inches of rain flooded businesses along Front Street. Portions of Sims St. and Palm St. were reportedly impassible and driveways to some residences were scoured by floodwaters. Georgetown County's Emergency Management Director was quoted in an interview "several motorists had to be rescued when rising waters inundated their cars."
Flash flooding also occurred in Whiteville, NC. An article from the News Reporter referenced businesses along S. Madison St. were flooded and that eight inches of rain fell in a 24 hour period.
Tides during the storm ran unusually high due to strong onshore winds. At Springmaid Pier in Myrtle Beach, SC the measured water level reached 8.28 feet MLLW and 7.36 feet MLLW at Wrightsville Beach, NC. Both of these readings are over one foot above water levels known to cause flooding.
According to a local television news, significant coastal flooding impacted portions of North Myrtle Beach, Cherry Grove, and Garden City. WMBF news reported that water entered most buildings on Atlantic Avenue in Garden City, SC
|
WBTW news reports severe beach erosion occurred in Cherry Grove, SC. |
Wind gusts up to 56 mph were measured in Winyah Bay near Georgetown, and 46 mph gusts were measured at Wrightsville Beach, NC.
| Location | Peak Wind Gust | Location | Peak Wind Gust | |
| Frying Pan Shoals Buoy | 60 mph | Winyah Bay, SC | 56 mph | |
| Federal Point, NC | 53 mph | Wilmington, NC | 47 mph | |
| Wrightsville Beach, NC | 46 mph | Southport, NC | 40 mph | |
| North Myrtle Beach, SC | 39 mph | Georgetown, SC | 38 mph | |
| Florence, SC | 36 mph | Myrtle Beach, SC | 35 mph |
Some additional information on this coastal storm and flood event is available at https://www.weather.gov/ilm/Oct2025CoastalStorm
10) November 10: Earliest Local Snow Ever Recorded
An arctic blast brought the earliest snow flurries on record to portions of the eastern Carolinas during the evening of November 10. Snow was observed falling in numerous locations including Pembroke, Bladenboro, Elizabethtown, Whiteville, Lake Waccamaw, Marion, Dillon, Leland, Myrtle Beach, and Wilmington.
In Wilmington, this was the earliest in the winter season that snow had ever been observed since local weather records began in 1871. Trace of amounts of snow had been recorded only a few times as early as mid-November including Nov 12-13, 2013; Nov 14, 1976; and Nov 14, 1934.
The earliest measurable snow in Wilmington's history remains 1.5 inches which fell on Nov 20, 1879.
In Lumberton, NC, the 0.1 inches that fell was the earliest measurable snow on record, beating the previous earliest snowfall on November 25, 1950.
|
Radar and infrared satellite animation of snow falling across the eastern Carolinas during the evening of November 10, 2025 |
Snow falling in Whiteville, NC during the evening of November 10. From WECT TV News |
Additional information on this unusual snowfall event is available at https://www.weather.gov/ilm/2025Nov10flurries
2025 Observed Monthly Averages and Totals for Local Cities
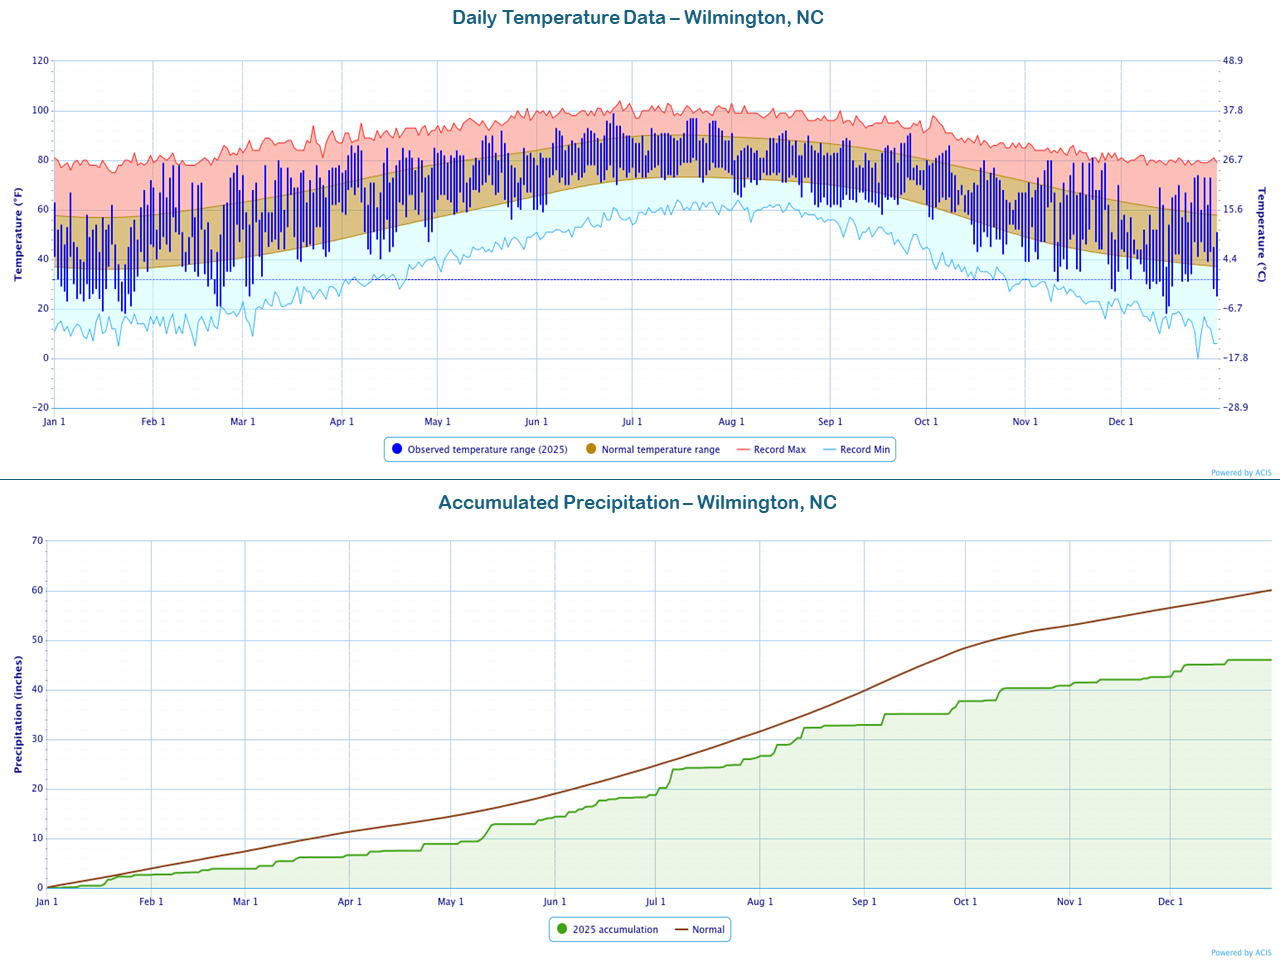
Wilmington, NC

     Avg Hi/Dep   Avg Lo/Dep   Avg T/Dep   Warmest   Coolest   Precip/Dep
JAN   51.8/-5.4    29.5/-6.8   40.7/-6.1   72/31st   18/23rd   2.63/-1.18
FEB   61.8/+1.5    39.4/+1.0   50.6/+1.3   79/4th    21/22nd   1.25/-2.22
MAR   69.7/+3.2    46.6/+2.5   58.2/+2.9   80/12th   25/3rd    2.74/-1.23
APR   77.2/+2.6    56.0/+3.4   66.6/+3.0   86/6th    40/13th   2.27/-0.80
MAY   81.7/+0.6    65.1/+4.0   73.4/+2.3   92/21st   56/24th   5.21/+0.67
JUN   88.9/+1.9    72.3/+3.0   80.6/+2.4   99/25th   59/3rd    4.68/-0.99
JUL   90.7/+0.7    75.7/+2.7   83.2/+1.7   97/21st   70/23rd   7.55/+0.69
AUG   85.5/-2.8    70.0/-1.7   77.8/-2.2   92/18th   61/28th   6.59/-1.57
SEP   82.1/-1.8    65.0/-1.7   73.6/-1.7   91/26th   58/17th   4.81/-3.88
OCT   72.9/-3.2    54.3/-1.3   63.6/-2.3   86/8th    42/25th   3.10/-1.56
NOV   69.2/+1.8    43.8/-1.0   56.5/+0.4   81/22nd   27/29th   1.80/-1.76
DEC   57.9/-2.4    34.8/-4.3   46.4/-3.3   74/25th   18/18th   3.41/-0.28
--------------------------------------------------------------------------
ANN   74.1/-0.3    54.4/-0.0   64.2/-0.2   99        18       46.04/-14.11


Number of days with Temperatures...
90 degrees or higher:  44 (1 fewer than normal)
32 degrees or lower:   48 (11 more than normal)

Heating degree days: 2395 (69 more than normal)
Cooling degree days: 2230 (97 more than normal)

Number of days with precipitation...
0.01" or greater: 110 (12 fewer than normal)
0.10" or greater:  73 (6 fewer than normal)
0.50" or greater:  33 (3 fewer than normal)
1.00" or greater:  14 (4 fewer than normal)

Thunderstorms occurred on 61 days.
Snow occurred on 3 days.

Average wind speed: 7.9 MPH
Maximum 2-minute wind speed: 41 mph on June 10th (severe thunderstorm)
Maximum 5-second wind gust: 60 mph on June 10th (severe thunderstorm)

Notes:  2025 was the coolest year in Wilmington since 2014.
|
2025 Temperature and Rainfall summary for Wilmington, NC |
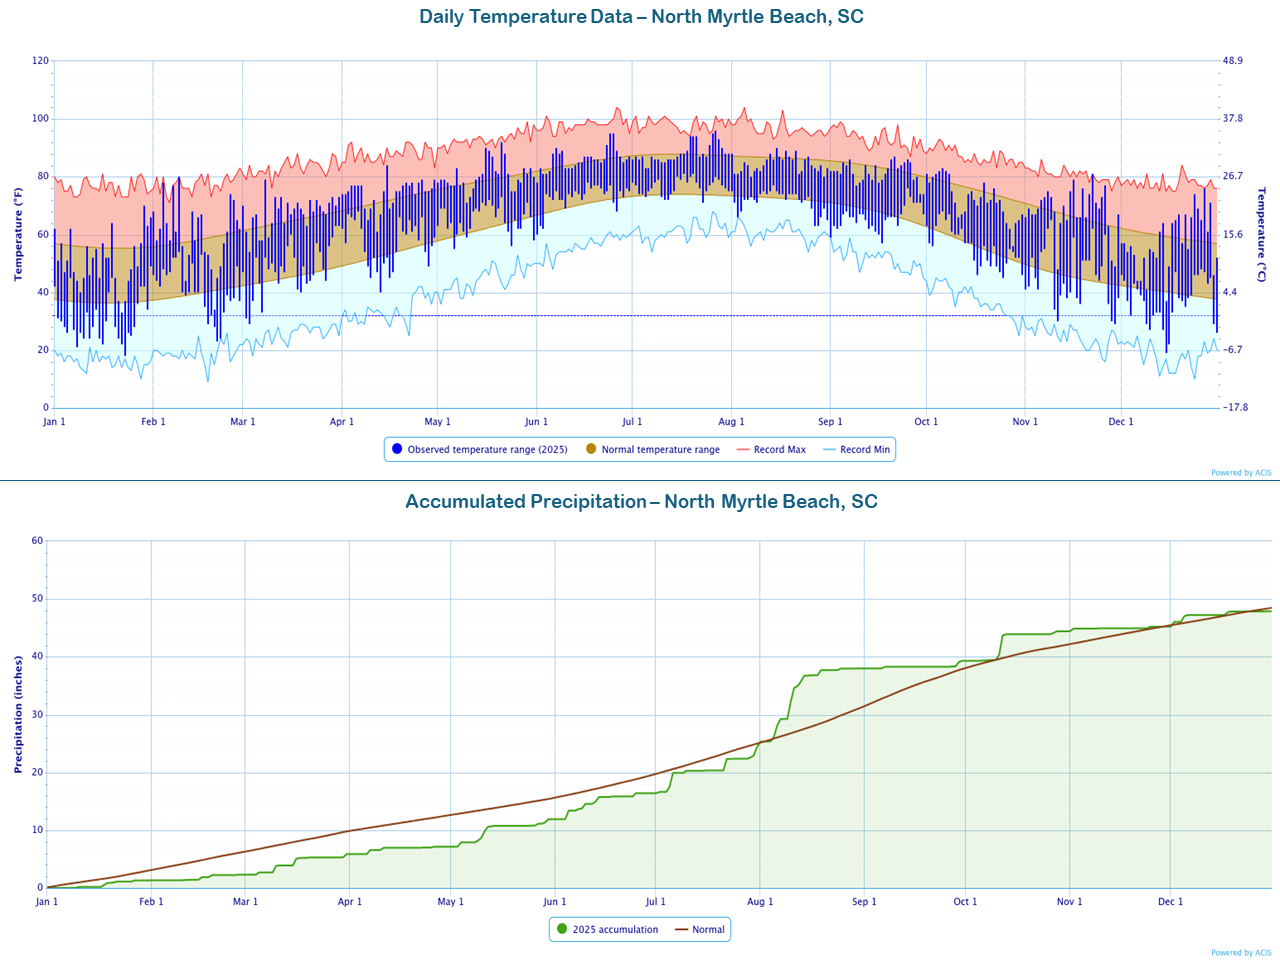
North Myrtle Beach, SC

     Avg Hi/Dep   Avg Lo/Dep   Avg T/Dep   Warmest   Coolest   Precip/Dep
JAN  51.3/-4.4    30.8/-5.9    41.0/-5.2   70/29th   18/23rd   1.30/-1.71
FEB  60.4/+2.2    40.6/+1.0    50.5/+1.6   80/9th    23/21st   1.00/-2.18
MAR  67.6/+2.9    47.8/+2.4    57.7/+2.7   79/8th    29/3rd    3.57/-0.02
APR  74.3/+2.5    56.7/+3.4    65.5/+3.0   84/15th   40/13th   1.26/-1.51
MAY  80.3/+1.6    65.0/+2.9    72.7/+2.3   92/21st   55/6th    4.77/+1.81
JUN  86.1/+1.3    72.7/+2.4    79.4/+1.9   95/25th   60/1st    4.50/+0.43
JUL  88.3/+0.7    76.5/+2.8    82.4/+1.8   96/27th   71/23rd   7.99/+2.59
AUG  84.5/-2.0    71.5/-1.0    78.0/-1.5   90/15th   63/27th  13.60/+7.35
SEP  81.6/-1.6    65.7/-2.0    73.7/-1.8   87/21st   57/17th   1.35/-5.30
OCT  72.4/-3.2    55.7/-0.6    64.1/-1.9   83/6th    45/25th   5.10/+0.90
NOV  68.3/+1.9    45.4/-0.2    56.8/+0.8   81/22nd   29/29th   0.82/-2.47
DEC  57.6/-1.7    36.7/-3.3    47.1/-2.5   76/27th   19/15th   2.65/-0.45
--------------------------------------------------------------------------
ANN  72.7/0.0     55.4/+0.2    64.1/+0.1   96        18       47.91/-0.56


Number of days with Temperatures...
90 degrees or higher:  15 (6 fewer than normal)
32 degrees or lower:   39 (5 more than normal)

Heating degree days: 2316 (27 fewer than normal)
Cooling degree days: 2092 (89 more than normal)

Number of days with precipitation...
0.01" or greater: 105 (17 fewer than normal)
0.10" or greater:  66 (5 fewer than normal)
0.50" or greater:  31 (exactly normal)
1.00" or greater:  13 (exactly normal)

Thunderstorms occurred on 58 days.
Snow occurred on 3 days.

Average wind speed: 7.7 MPH
Maximum 2-minute wind speed: 38 mph on May 4th (severe thunderstorm)
Maximum 5-second wind gust: 58 mph on May 4th (severe thunderstorm)

Notes:  2025 was tied for the coolest year (2022) in North Myrtle Beach since 2014.
|
2025 Temperature and Rainfall summary for North Myrtle Beach, SC |
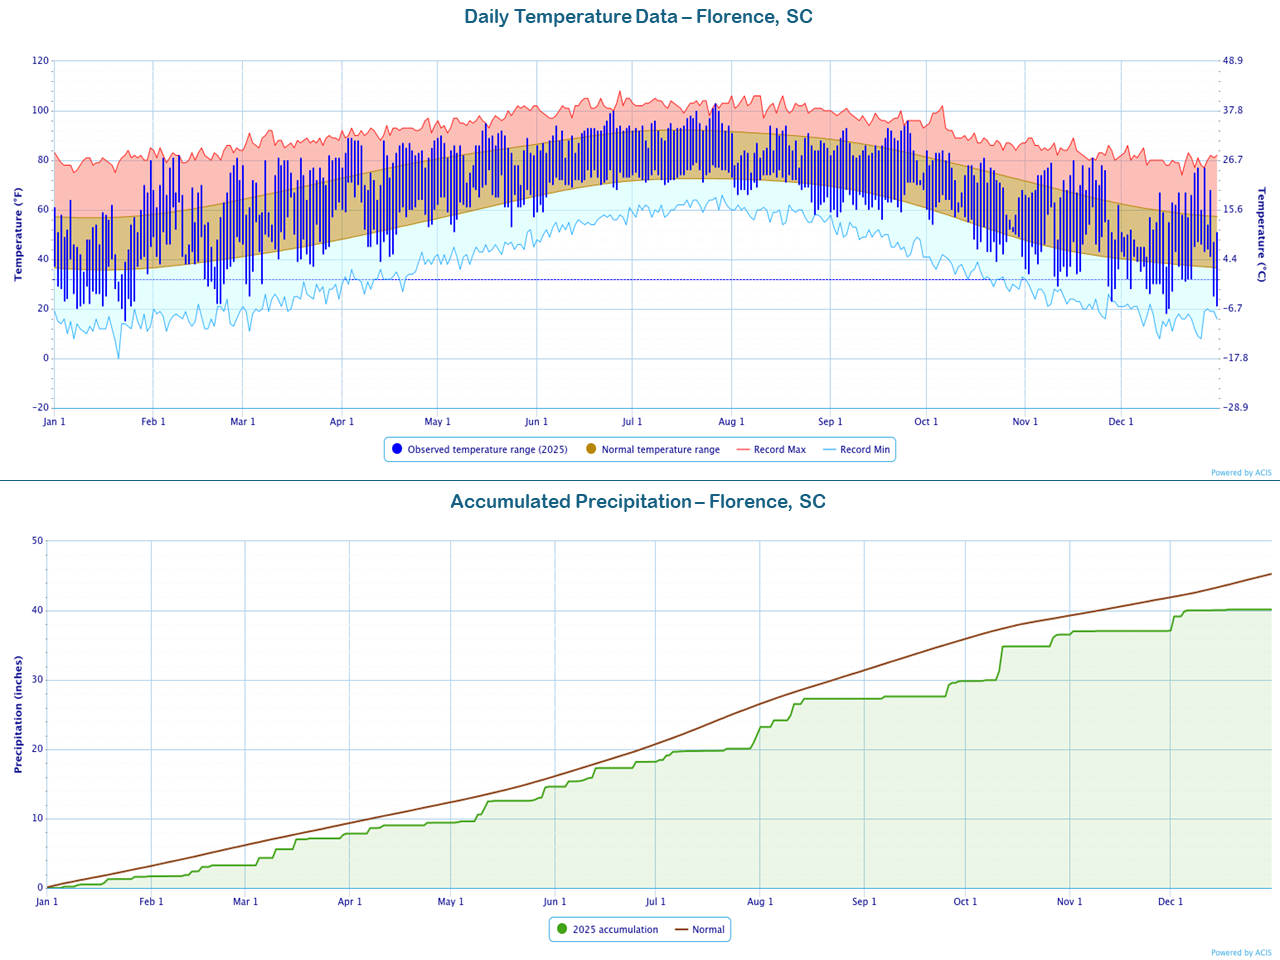
Florence, SC

     Avg Hi/Dep   Avg Lo/Dep   Avg T/Dep   Warmest   Coolest   Precip/Dep
JAN  52.1/-5.0    28.2/-7.8    40.2/-6.4   80/31st   15/23rd   1.68/-1.40
FEB  64.3/+3.5    40.5/+1.9    52.4/+2.7   82/9th    22/22nd   1.58/-1.42
MAR  72.4/+4.1    45.8/+1.5    59.1/+2.8   82/28th   25/3rd    4.58/+1.39
APR  81.1/+4.4    56.0/+3.9    68.5/+4.1   89/4th    39/13th   1.57/-1.43
MAY  84.5/+1.0    63.3/+2.4    73.9/+1.7   95/16th   51/6th    5.20/+1.49
JUN  90.7/+1.5    70.6/+1.6    80.6/+1.5  100/25th   59/3rd    3.59/-1.02
JUL  94.2/+2.2    74.3/+1.9    84.2/+2.0  103/27th   70/11th   3.87/-1.93
AUG  85.5/-4.8    69.2/-2.2    77.3/-3.6   94/18th   58/27th   5.22/+0.36
SEP  86.1/+0.7    63.6/-2.2    74.9/-0.7   96/25th   56/17th   2.54/-1.99
OCT  73.0/-3.7    52.7/-1.6    62.9/-2.6   87/6th    39/23rd   6.71/+3.29
NOV  69.0/+2.0    41.4/-2.1    55.2/-0.1   81/22nd   23/28th   0.52/-2.11
DEC  56.7/-2.7    33.9/-4.4    45.3/-3.6   77/25th   18/15th   3.10/-0.37
--------------------------------------------------------------------------
ANN  75.8/+0.2    53.3/-0.6    64.6/-0.1   103       15       40.16/-5.14


Number of days with Temperatures...
90 degrees or higher:  69 (1 fewer than normal)
32 degrees or lower:   53 (13 more than normal)

Heating degree days: 2410 (76 more than normal)
Cooling degree days: 2344 (87 more than normal)

Number of days with precipitation...
0.01" or greater:  96 (15 fewer than normal)
0.10" or greater:  56 (17 fewer than normal)
0.50" or greater:  29 (1 fewer than normal)
1.00" or greater:  13 (1 more than normal)

Thunderstorms occurred on 53 days.
Snow occurred on 3 days.

Average wind speed: 6.8 MPH
Maximum 2-minute wind speed: 41 mph on July 4th (thunderstorm) and
                             41 mph on August 1st (severe thunderstorm)
Maximum 5-second wind gust: 61 mph on August 1st (severe thunderstorm)

Notes:  2025 was the coolest year in Florence since 2014.
|
2025 Temperature and Rainfall summary for Florence, SC |
Lumberton, NC

     Avg Hi/Dep   Avg Lo/Dep   Avg T/Dep   Warmest   Coolest   Precip/Dep
JAN   50.6/-4.0    28.2/-7.1   39.4/-5.5   78/31st   13/23rd   1.74/-0.81
FEB   61.8/+3.2    39.2/+1.8   50.5/+2.5   79/27th   22/21st   1.95/-0.82
MAR   70.4/+4.6    45.3/+2.2   57.8/+3.3   79/29th   25/3rd    4.54/+1.28
APR   78.0/+3.3    52.7/+2.0   65.3/+2.6   87/30th   35/13th   2.13/-0.72
MAY   83.5/+1.0    61.0/+1.5   72.2/+1.2   93/21st   50/24th   3.50/+0.09
JUN   92.0/+3.2    69.8/+1.1   80.9/+2.1  100/25th   53/3rd    2.48/-2.44
JUL   93.0/+2.0    74.1/+1.8   83.5/+1.9  102/27th   69/23rd   8.91/+4.30
AUG   85.5/-3.6    68.9/-2.0   77.2/-2.8   97/27th   58/28th   4.33/-0.44
SEP   85.2/+1.0    62.8/-2.0   74.0/-0.5   95/25th   54/17th   0.97/-3.96
OCT   72.6/-3.3    51.3/-1.2   62.0/-2.2   85/6th    37/25th   3.71/+1.42
NOV   68.0/+2.1    40.2/-2.2   54.1/+0.0   79/22nd   23/29th   1.53/-1.42
DEC   55.6/-1.9    32.6/-4.9   44.1/-3.4   75/25th   17/15th   2.82/-0.49
--------------------------------------------------------------------------
ANN   74.7/+0.6    52.2/-0.7   63.4/-0.1   102       13       38.61/-4.01


Number of days with Temperatures...
90 degrees or higher:  66 (1 fewer than normal)
32 degrees or lower:   57 (6 more than normal)

Heating degree days: 2630 (21 more than normal)
Cooling degree days: 2165 (78 more than normal)

Number of days with precipitation...
0.01" or greater: 106 (12 fewer than normal)
0.10" or greater:  62 (9 fewer than normal)
0.50" or greater:  25 (3 fewer than normal)
1.00" or greater:  11 (1 fewer than normal)

Thunderstorms occurred on 54 days.
Snow occurred on 3 days.

Average wind speed: 6.3 MPH
Maximum 2-minute wind speed: 40 mph on December 29th (cold front)
Maximum 5-second wind gust: 55 mph on April 11th (thunderstorm)

Notes:  2025 was the coolest year in Lumberton since 2014.
|
2025 Temperature and Rainfall summary for Lumberton, NC |
Research and Author: Tim Armstrong
Last Updated: January 1, 2026


 Coastal Flood