Published February 28, 2022 by NWS Wilmington, NC Meteorologist and Climate Program Leader Tim Armstrong
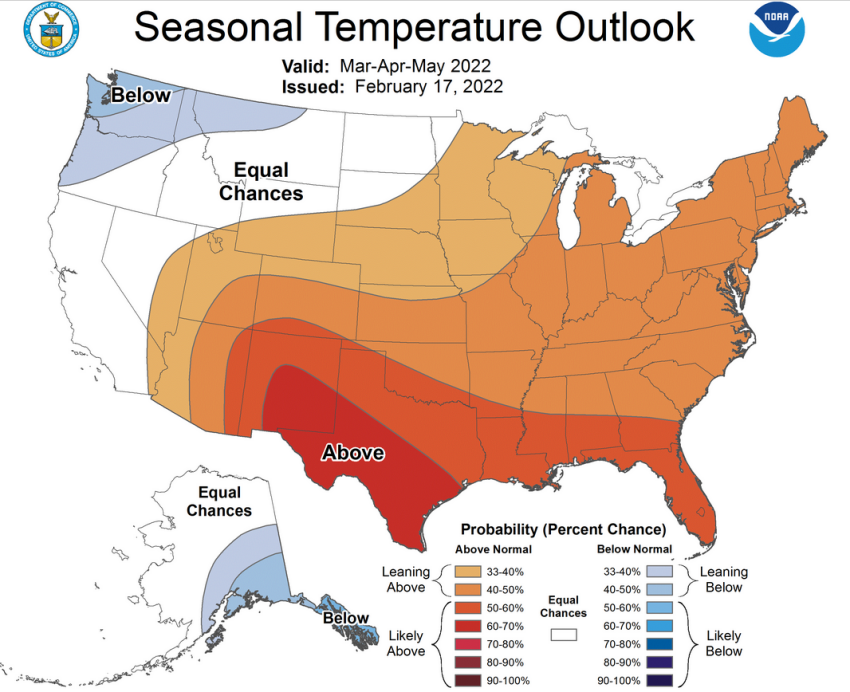
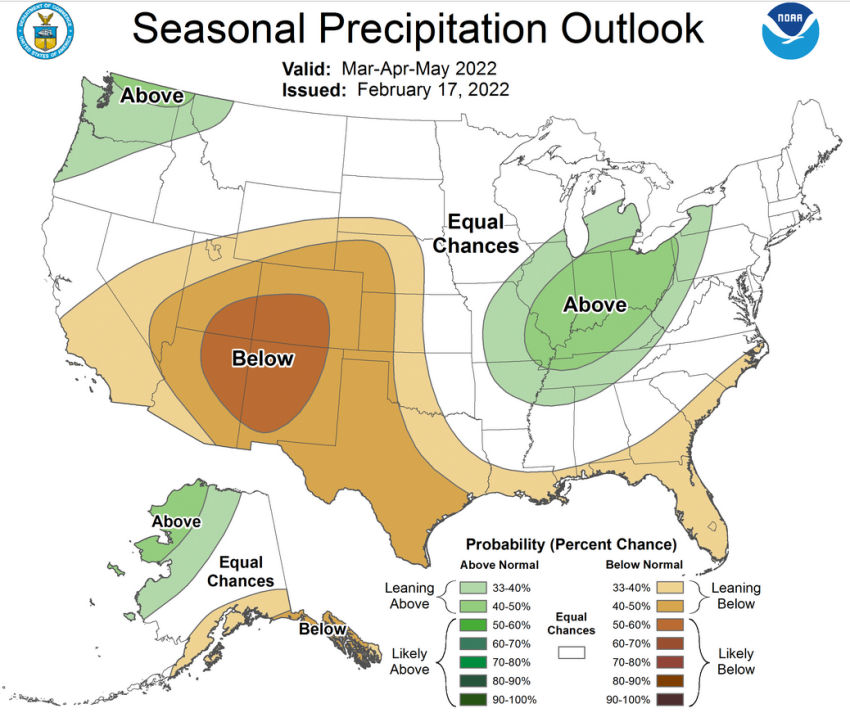
The official Spring outlook from the NWS Climate Prediction Center calls for good chances for above-normal temperatures along with slightly increased chances for below-normal rainfall across eastern portions of North and South Carolina.
|
Climate Prediction Center Temperature Outlook for Spring 2022 |
|
Meteorological spring consists of the months of March, April, and May, and is a transition season with rapidly rising temperatures as day length and sun angles increase. Spring is also climatologically one of the driest periods of the year across the Carolinas as frontal systems become weaker and less frequent, but tropical moisture for frequent afternoon showers and thunderstorms hasn’t arrived yet. April is typically the driest spring month across the eastern Carolinas with an average rainfall of only three inches.
|
Tropical east Pacific water temperature anomalies. The waves along the north edge of the cool equatorial water are called "Legeckis Waves." Graphic from CPC |
La Nina
Water temperatures cooled below normal late last summer across the tropical east Pacific Ocean. This cooling caused changes in regional and global winds, shifting the El Nino Southern Oscillation (ENSO) climate pattern into its La Nina phase.
This La Nina has likely been a major contributor to the dry weather we’ve experienced over the fall and winter. Rainfall deficits since September have reached six to 12 inches for many locations in the eastern Carolinas. Unusually warm temperatures this winter, averaging two to three degrees above normal, also is a likely consequence of La Nina which continues as we prepare to enter spring.
The bulk of statistical and dynamic model guidance shows tropical Pacific water temperatures should return to within a half degree of normal by May or June this year, ending this La Nina and creating a neutral ENSO climate pattern.
|
Ensemble model probabilities show the chances for La Nina will rapidly decrease this spring while the chances for neutral ENSO conditions will increase. The current La Nina will probably end late this spring. Data: Columbia Climate School |
Temperatures and Precipitation
Since the year 2000, there have been six times when a wintertime La Nina ended during the spring months: 2001, 2006, 2009, 2012, 2018, and 2021. However, during these years no consistent impact has been noted on springtime temperatures or precipitation totals across the eastern Carolinas.
|
Wilmington, NC - March, April, May
|
Florence, SC - March, April, May
|
||||||||||||||||||||||||||||||||||||||||||||||||||||||||||||||||||||||||||||||||||||||||||||||||||||||||||||||||||||||||||||||||
|
North Myrtle Beach, SC - March, April, May
|
Lumberton, NC - March, April, May
|
Correlation analysis produced by NOAA’s Physical Science Laboratory shows there is not a significant correlation between the state of ENSO (La Nina, Neutral, or El Nino) and local spring temperatures and precipitation across the Carolinas.
|
Correlation between ENSO and surface air temperatures during the Spring months. Greens and yellows indicate a positive correlation (cooler temperatures during La Nina) while blue colors indicate a negative correlation (warmer temperatures during La Nina.) For the Carolinas, white colors indicate there is virtually no correlation. Graphic from NOAA PSL |
Correlation between ENSO and precipitation totals over the Spring months. Greens and yellows indicate a positive correlation (less precipitation during La Nina) while blue colors indicate a negative correlation (more precipitation during La Nina.) White indicates no correlation. For the Carolinas, there is only a weak positive correlation. Graphic from NOAA PSL |
This means other factors, like the strength and phase of the North Atlantic Oscillation and the positions of the Icelandic Low and Bermuda High, largely control our weather during the spring season. Unfortunately, these important factors aren’t predictable at long ranges like ENSO.
The outlook from the Climate Prediction Center for temperatures and precipitation this spring is mainly based on output from the NMME (North American Multi Model Ensemble) and on observed trends toward warmer temperatures due to human-induced climate change. A full discussion from the Climate Prediction Center is available here.
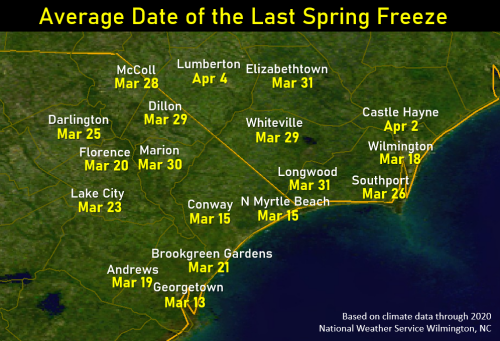
The average date of the last spring freeze varies from March 13 in Georgetown, SC to April 4 in Lumberton, NC -- but the actual date can vary widely from year to year depending on actual weather patterns. Freezing temperatures have been recorded locally as late as May 10, 1980 in Lumberton when the temperature fell to 32 degrees. But in 1921, Wilmington recorded its last freeze of the season on January 26, almost two months early and responsible for a growing season almost 300 days in length that year!
You can explore our local climate history for spring freezes by clicking a city on the map or table below.
|
|
|
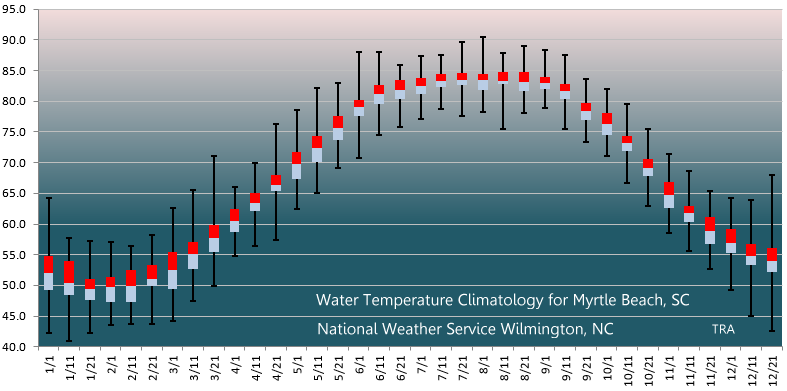
Local ocean water temperatures typically reach their lowest values during late January and February, then steadily warm during the spring months. While it's too cool to safely spend time in the water without a wetsuit now, water temperatures will reach the 60s in April and the 70s in May. During exceptionally warm springs, beach water temperatures have reached 80 degrees by the middle of May!
|
Annual water temperature climatology for Myrtle Beach, SC. Click for more information... |
You can view current and climatological water temperature information for area beaches here:
While enjoying the water, make sure you are aware of the threat posed by Rip Currents.
Drought and Wildfire Risk
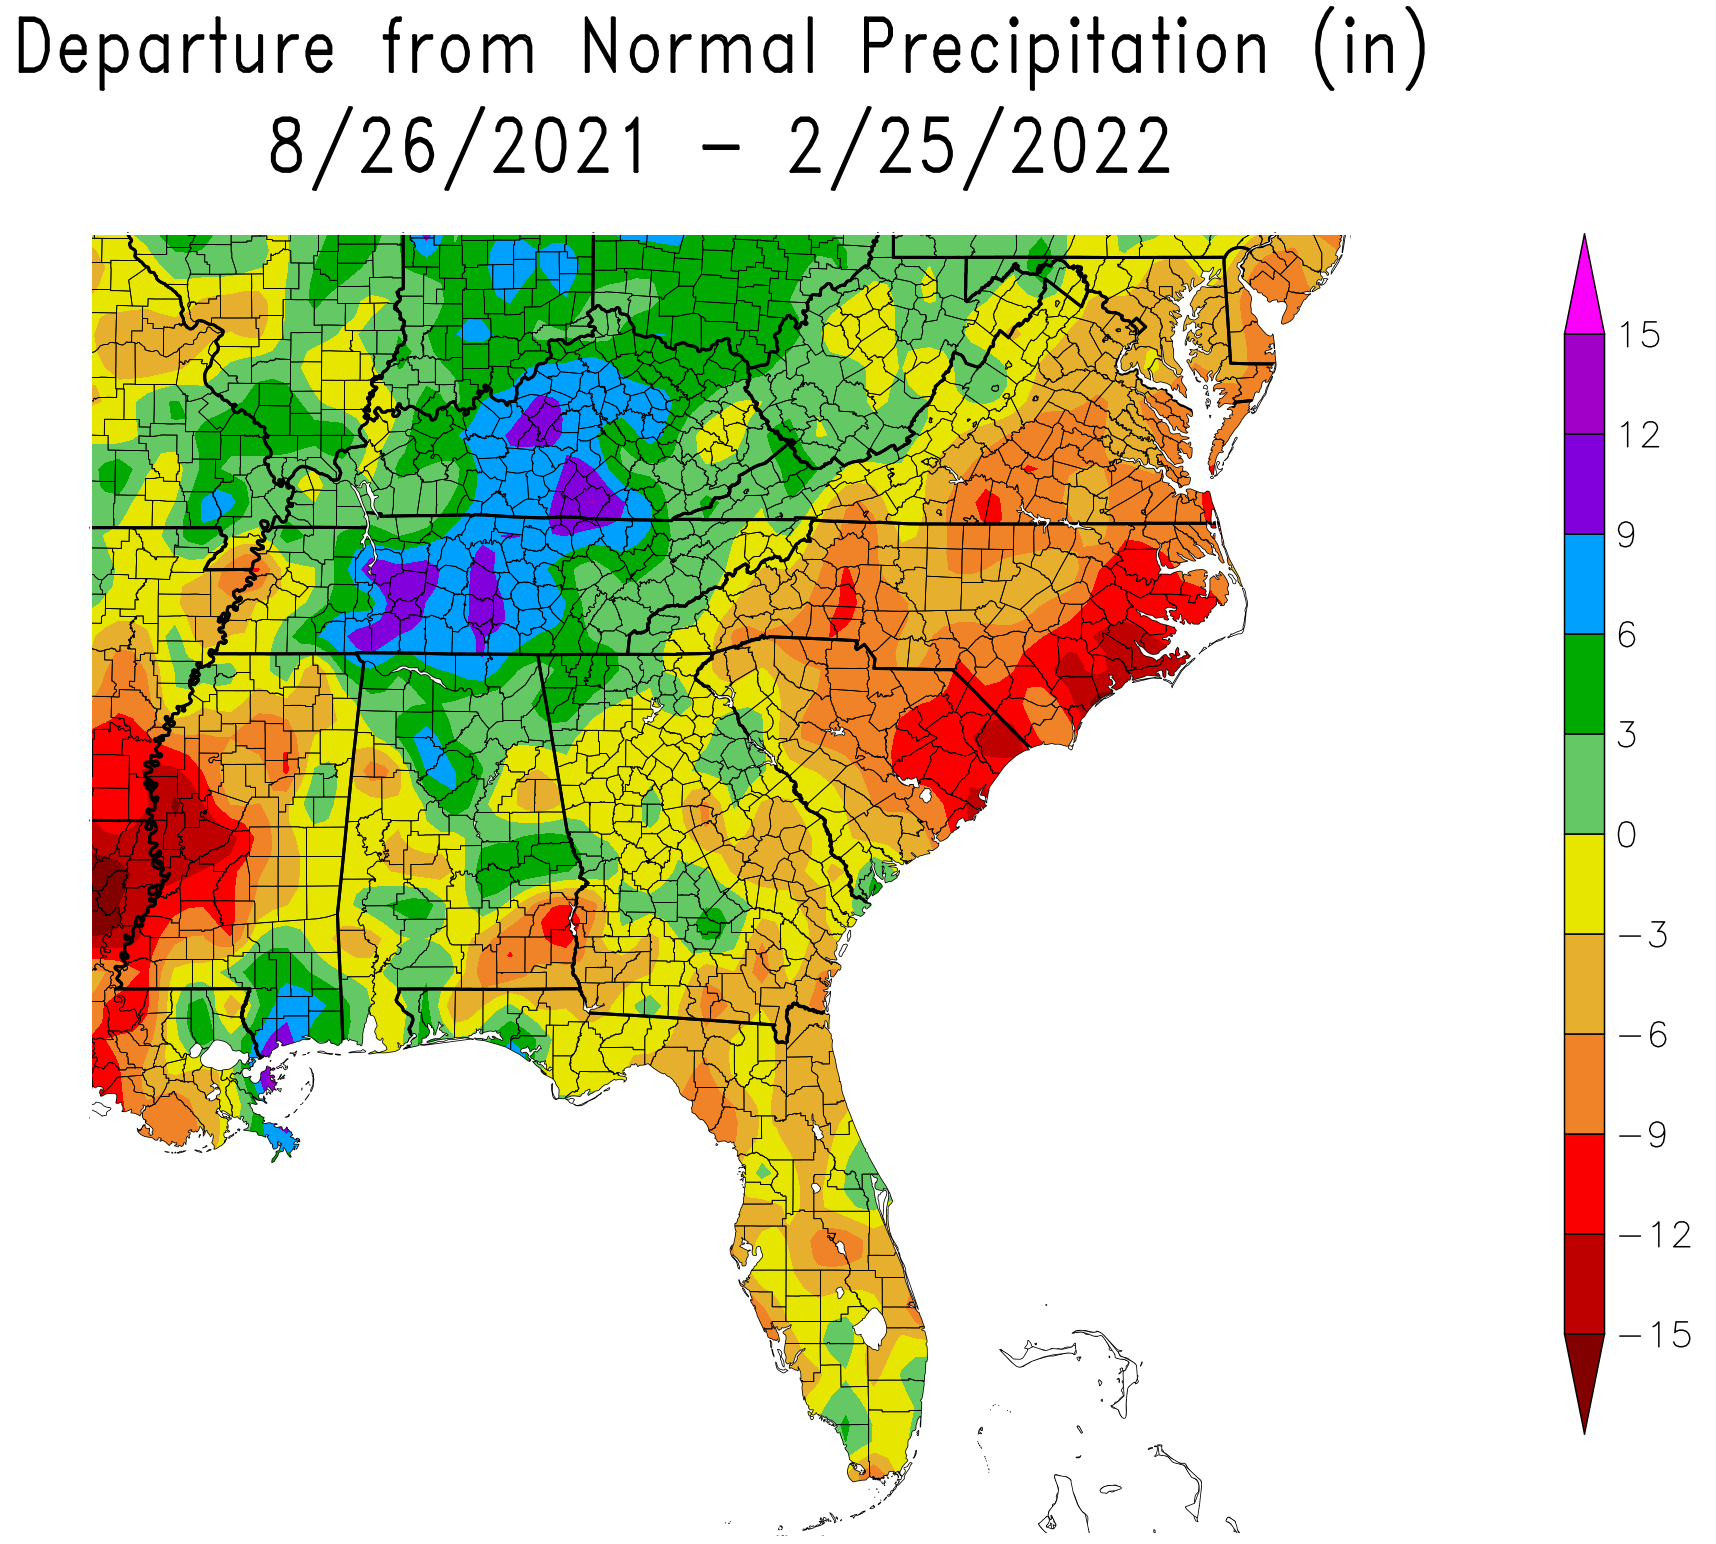
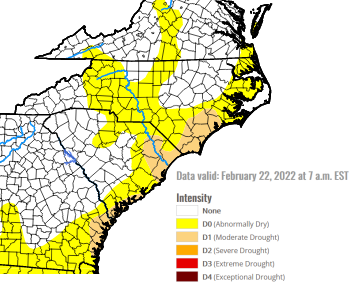
Precipitation totals over the past six months have been six to 12 inches below normal for most locations across southeastern North Carolina and northeastern South Carolina. This is the driest we’ve been since the 2013-2014 fall and winter seasons, and moderate drought conditions continue as we begin the spring season.
|
Departure from normal precipitation (inches) over the past six months. For the eastern Carolinas rainfall totals have ranged from six to 12 inches below normal. Graphic from HPRCC |
U.S. Drought Monitor issued February 22 showing moderate drought occurring across portions of southeastern North Carolina and northeastern South Carolina. From UNL Drought |
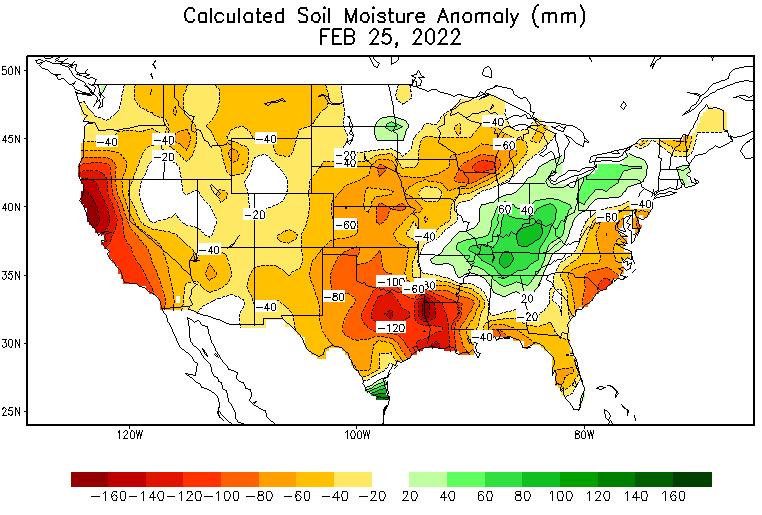
Abnormally dry weather has led to soil moisture deficits expanding across the Carolinas during January and February. Soil moisture becomes vitally important in late March and April as the growing season begins and forest and agricultural water needs increase rapidly.
|
Soil moisture anomaly in millimeters. This shows how much wetter (green) or drier (red) the soil is relative to normal for late February. Data from CPC |
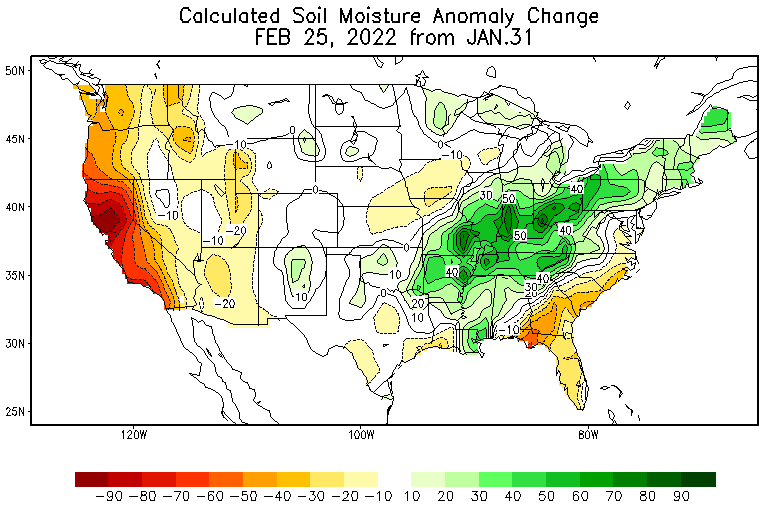
Change in soil moisture during the February 2022. Soils across the eastern Carolinas have become drier during the month due to low precipitation amounts. Data from CPC |
Soil moisture also acts as a buffer against the springtime increase in solar radiation. Evaporation of water from the soil can help stabilize soil and air temperatures during the spring. Persistently low rainfall will dry out the soil and can lead to abnormally high temperatures, particularly in late spring or summer, as more of the sun’s energy turns into heat rather than evaporating water.
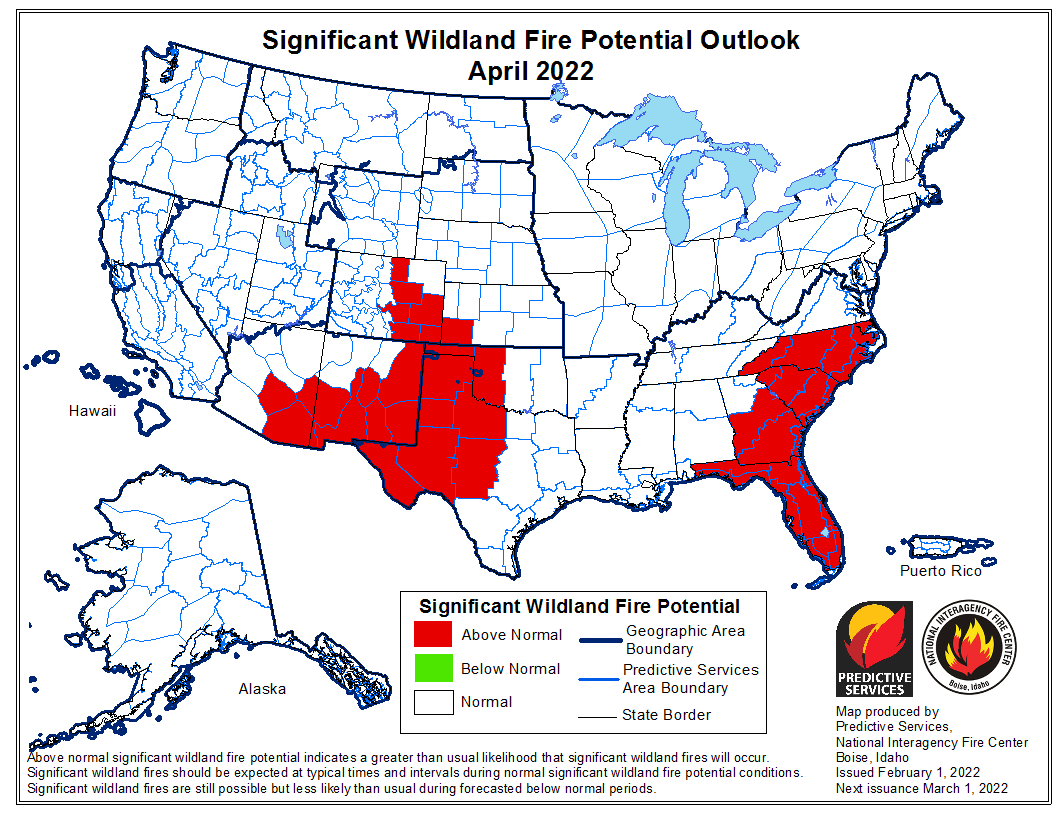
Drought during spring is often associated with an increased wildfire risk across the eastern Carolinas. The National Interagency Coordination Center (a government wildland fire resource agency) is predicting an above normal risk of wildfires across South Carolina in March, and across both North and South Carolina in April. This is due to the expectation for above normal temperatures coupled with an ongoing drought.
|
National Interagency Fire Center April 2022 Outlook for Wildland Fire Potential. Graphic from NICC |
On April 22, 2009, a small debris burn escaped and became a major wildfire between Conway and Myrtle Beach, SC. This became known as the Highway 31 Fire and burned 19,000 acres across eastern Horry County, destroying $25 million of property and $17 million of agricultural products. Much of South Carolina was experiencing a drought during the winter and spring months leading up to this fire.
Coastal Flooding
Astronomical tides during March and April will not reach unusually high values. Although coastal flooding and beach erosion can still occur given a strong enough storm system or sustained onshore winds, the likelihood of flooding appears to be less than usual through April.
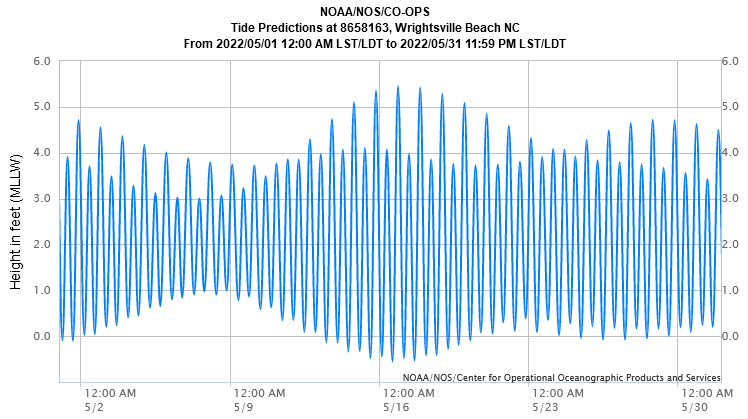
But for several days around May’s full moon (May 16) astronomical tides will grow larger, reaching within a half foot of minor coastal flood thresholds at the beaches. Any onshore winds or a passing storm system during this period will produce a higher likelihood of coastal flooding or beach erosion.
|
Astronomical tide predictions for Wrightsville Beach, NC for May 2022. The period between May 14 and May 19 surrounding May's full moon could experience coastal flooding if onshore winds or a nearby storm system develops. Data: NOAA/NOS |
You can monitor total water level forecasts incorporating tides, storm surge, and other factors for three locations in our area using these links:
Additional Information
CPC Climate Outlooks: https://www.cpc.ncep.noaa.gov/products/predictions/long_range
IRI Columbia ENSO forecast: https://iri.columbia.edu/our-expertise/climate/forecasts/enso/current
NIFC Wildland Fire Outlook: https://www.nifc.gov/nicc/predictive/outlooks/outlooks.htm
Local Climate Data: https://www.weather.gov/wrh/Climate?wfo=ilm
Page Updated: February 28, 2022
Research and Page Author: Tim Armstrong


 Coastal Flood