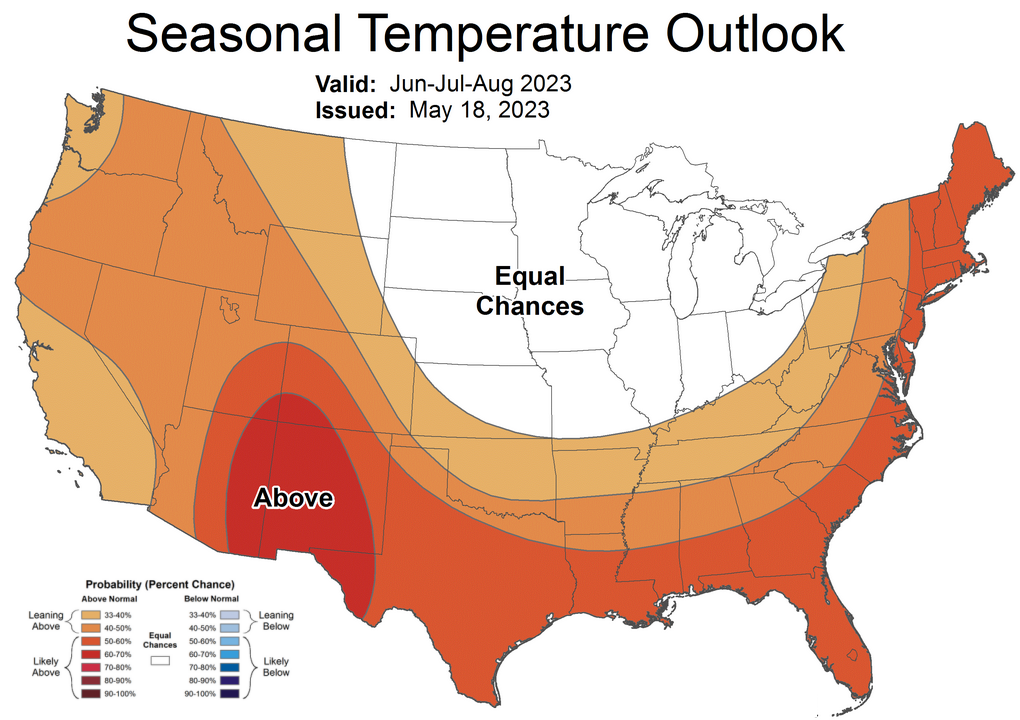
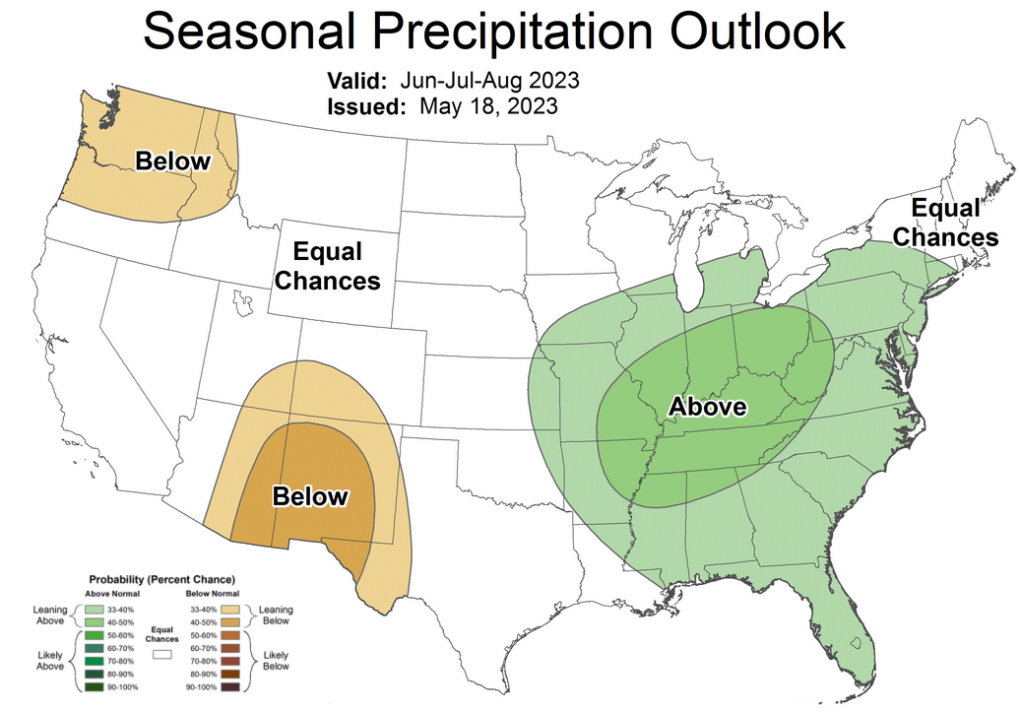
Summer 2023 is shaping up to be a warm one according to outlooks issued by the Climate Prediction Center. Across the eastern Carolinas there is a 50 to 60 percent chance for temperatures to run above normal this summer. There's not as much certainty with precipitation, but forecasters believe much of the eastern U.S. will see a slightly elevated potential for above normal rainfall this summer.
|
Summer 2023 temperature outlook |
Summer 2023 precipitation outlook |
Developing El Niño and Temperatures
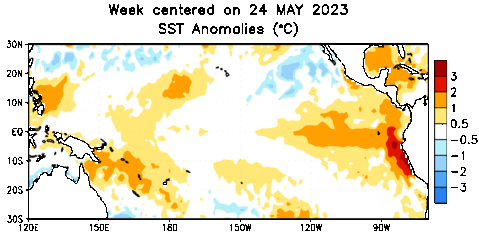
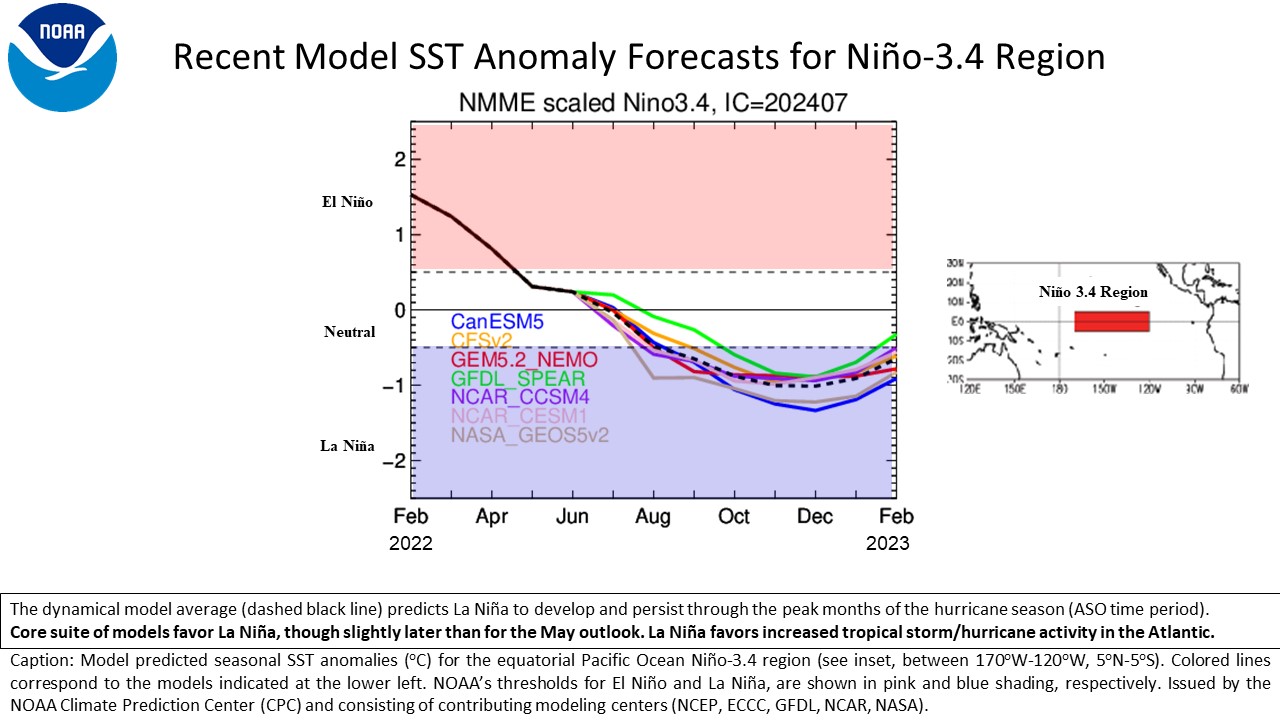
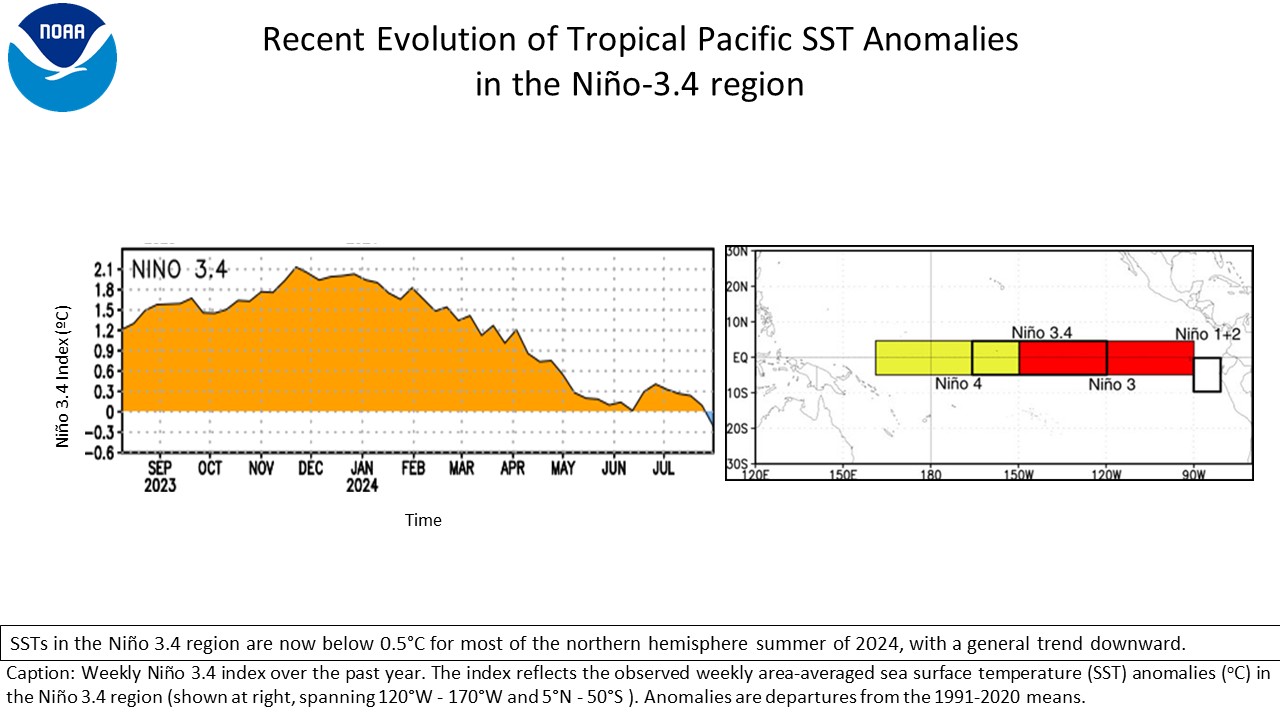
After almost three years of persistent La Niña conditions, ocean water temperatures across the tropical east Pacific Ocean are warming above normal and will likely cause El Niño to develop for the first time since 2019. El Niño is the warm phase of ENSO -- the El Niño Southern Oscillation. ENSO brings various weather and climate impacts around the world varying by location and by season.
|
Above normal sea surface temperature readings are developing across the eastern tropical Pacific Ocean, a sign El Niño is coming |
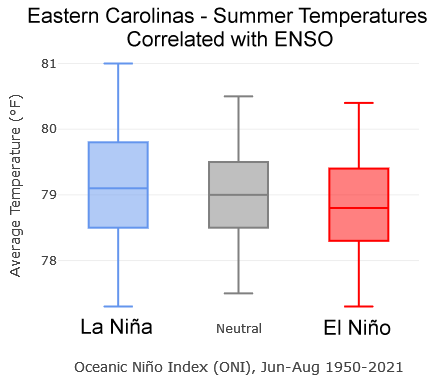
For the Carolinas during summer, El Niño's impact on temperatures is small. Statistical analysis since 1950 shows El Niño is associated with a slight tendency for cooler summer temperatures here, but there is considerable overlap between years which makes it a rather poor predictor by itself.
|
Summer temperatures correlated with ENSO phase. There is a slight tendency for El Niño summers to be cooler than others, but there is considerable overlap between years. |
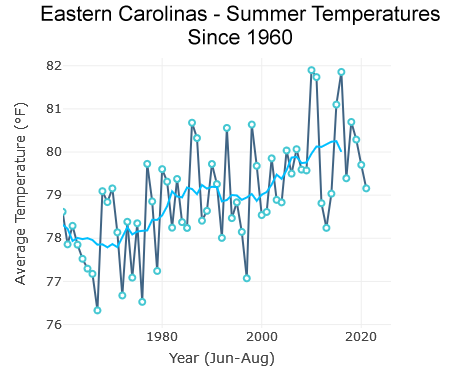
Summer temperatures since 1960 across the eastern Carolinas show a steady warming trend with time. |
Learn more about ENSO, El Niño, and La Niña...
The Climate Prediction Center's outlook for this summer is for a 50 to 60 percent chance for above normal temperatures. There are two main factors behind this outlook: computer models and climate change. Carbon dioxide and methane continue to increase in concentration in the atmosphere. These gases, released into the air from the burning of fossil fuels and from natural gas extraction, trap more and more of the sun's heat which leads to a warming climate. The past several summers have had observed temperatures near or above the 1991-2020 average, and this summer may turn out no different.
| Wilmington | Lumberton | N. Myrtle Beach | Florence | |
| 1991-2020 AVERAGE SUMMER TEMPERATURE | 79.9° | 80.1° | 79.2° | 80.7° |
| 2022 observed (anomaly) | 81.1° (+1.2°) | 80.8° (+0.7°) | 79.3° (+0.1°) | 81.5° (+0.8°) |
| 2021 observed (anomaly) | 80.6° (+0.7°) | 79.7° (-0.4°) | 78.8° (-0.4°) | 80.6° (-0.1°) |
| 2020 observed (anomaly) | 80.5° (+0.6°) | 79.5° (-0.6°) | 80.3° (+1.1°) | 81.2° (+0.5°) |
| 2019 observed (anomaly) | 80.8° (+0.9°) | 80.8° (+0.7°) | 79.8° (+0.6°) | 81.4° (+0.7°) |
| 2018 observed (anomaly) | 80.7° (+0.8°) | 80.8° (+0.7°) | 80.0° (+0.8°) | 81.9° (+1.2°) |
| 2018-2022 averages (anomaly) | 80.7° (+0.8°) | 80.3° (+0.2°) | 79.6° (+0.4°) | 81.3° (+0.5) |
On average, 90 degree high temperatures are recorded 20 times a year in Myrtle Beach, SC; 45 times a year in Wilmington, NC; and 70 times a year in Florence, SC. Extremely hot temperatures of 100 degrees average three occurrences a year in Florence, and only once a year in Wilmington. Both Florence and Lumberton, NC saw 100 degree temperatures last summer, but it's been 18 years since the normally cool seabreezes in Myrtle Beach have allowed temperatures to reach 100 there. (July 27, 2005)
Cooling degree days are a way to relate seasonal temperatures to energy consumed by air conditioning a home or business. Each degree that a day's average temperature runs above 65° F accumulates one cooling degree day, and summing up these cooling degree days across a season shows how much energy is needed for air conditioning.
For the climate across the eastern Carolinas, each 1° F that summer temperatures run above normal causes number of cooling degree days to rise by approximately 6 percent. Energy bills will likely be higher than normal this summer due to increased cooling costs -- dependent on exactly how far seasonal temperatures stray from normal.
More info on Cooling and Heating Degree Days from the EPA...
Precipitation
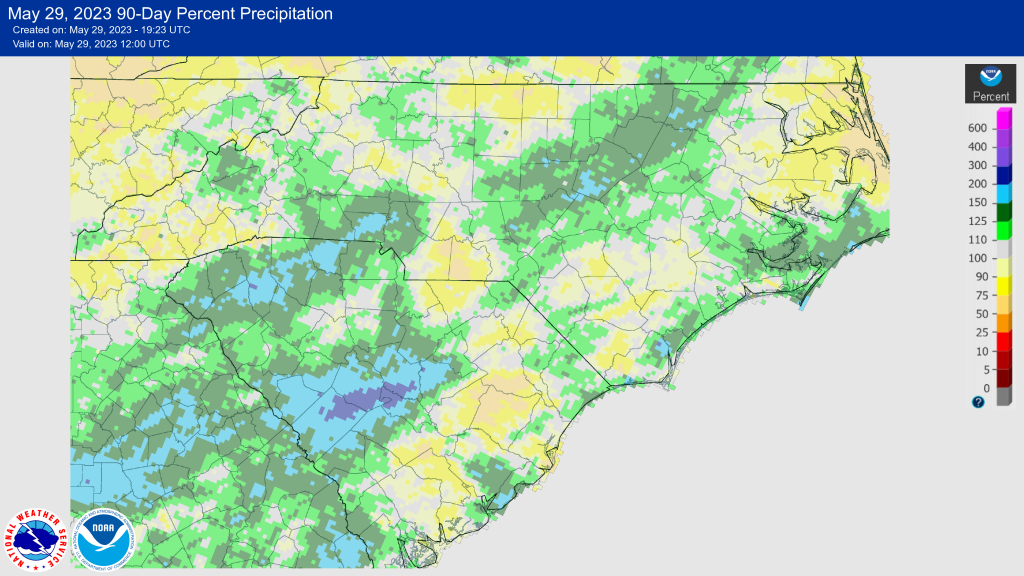
Areas of moderate drought at the end of the winter have vanished thanks to plentiful rainfall across most portions of the eastern Carolinas this spring. Rainfall amounts over the past three months have been near to above normal with the exception of locally dry conditions across Williamsburg and Florence counties in South Carolina.
|
Rainfall shown as percent of normal over 90 days ending on May 29, 2023. Williamsburg and southern Florence counties have only received 50 to 75 percent of normal rainfall, while Wilmington has received 130 percent of normal. |
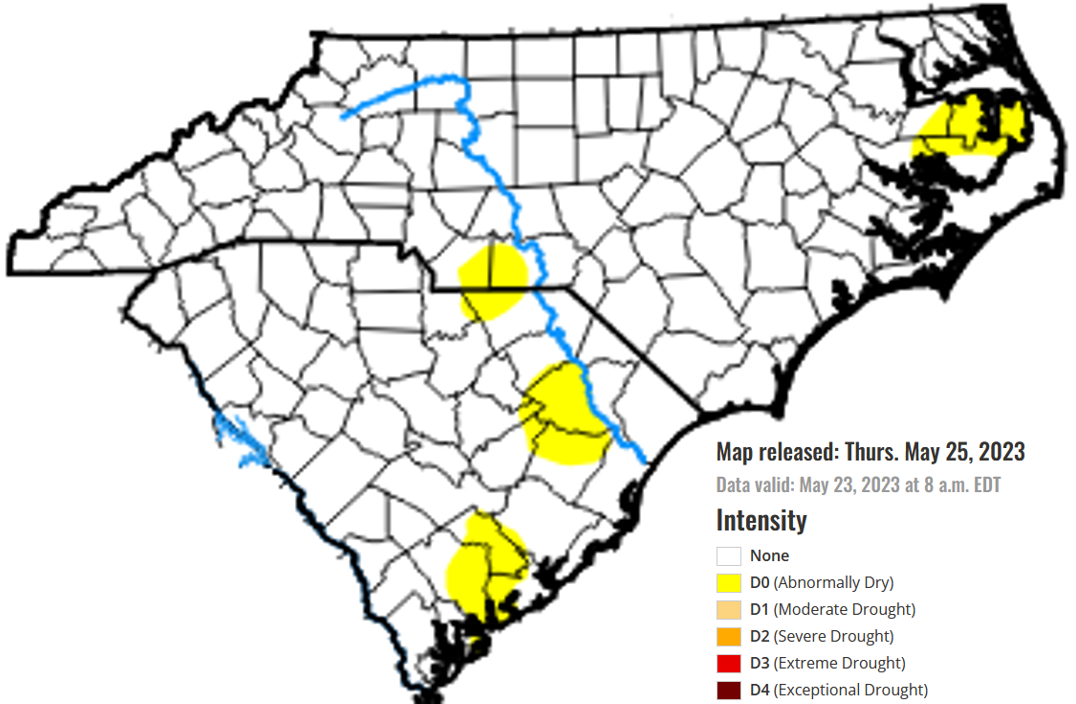
U.S. Drought Monitor in late May 2023. Only some small areas of abnormally dry conditions were noted, but no drought. |
There is very little historic difference between rainfall in El Niño, neutral, and La Niña summers across the eastern Carolinas. A small tendency is noted for El Niño summers to run drier than others, but there is considerable overlap between years and this by itself is not a reliable predictor.
| Wilmington | Lumberton | N. Myrtle Beach | Florence | |
| 1991-2020 AVERAGE SUMMER RAINFALL | 20.69" | 14.30" | 15.72" | 15.27" |
| 2022 observed (anomaly) | 19.13" (-1.52") | 14.12" (-0.18") | 21.33" (+5.61") | 11.48" (-3.79") |
| 2021 observed (anomaly) | 31.18" (+10.49") | 15.62" (+1.32") | 21.22" (+5.50") | 18.58" (+3.31") |
| 2020 observed (anomaly) | 24.24" (+3.55") | 18.02" (+3.72") | 15.73" (+0.01") | 18.66" (+3.39") |
| 2019 observed (anomaly) | 13.67" (-7.02") | 11.44" (-2.86") | 20.06" (+4.34") | 15.88" (+0.61") |
| 2018 observed (anomaly) | 30.94" (+10.25") | 14.33" (+0.03") | 19.34" (+3.62") | 15.84" (+0.57") |
| 2018-2022 averages (anomaly) | 23.83" (+3.14") | 14.71" (+0.41") | 19.54" (+3.82") | 16.09" (+0.82") |
The Climate Prediction Center outlook for the Carolinas this summer is for a slightly enhanced potential for above normal precipitation. This is mainly based on recent observed trends toward higher summer rainfall totals. Extended range model blends including the NMME (North American Multi-Model Ensemble) and C3S (European Copernicus) suggest near normal to slightly above normal rainfall totals as well.
Two positive aspects to an outlook for adequate rainfall during the summer are:
Hurricane Season
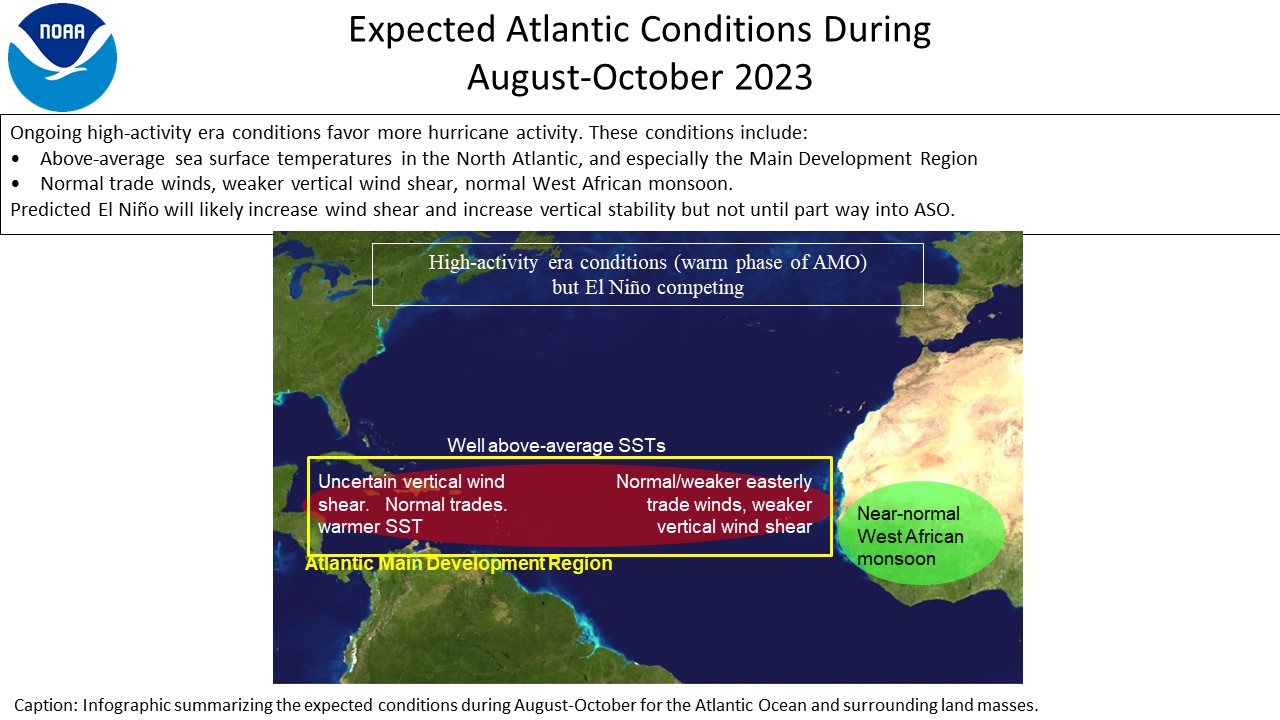
NOAA's official outlook has an increased likelihood of a near-normal hurricane season across the Atlantic Ocean, Caribbean Sea, and Gulf of America with the number of tropical storms, hurricanes, and major hurricanes near the center of their historic ranges.
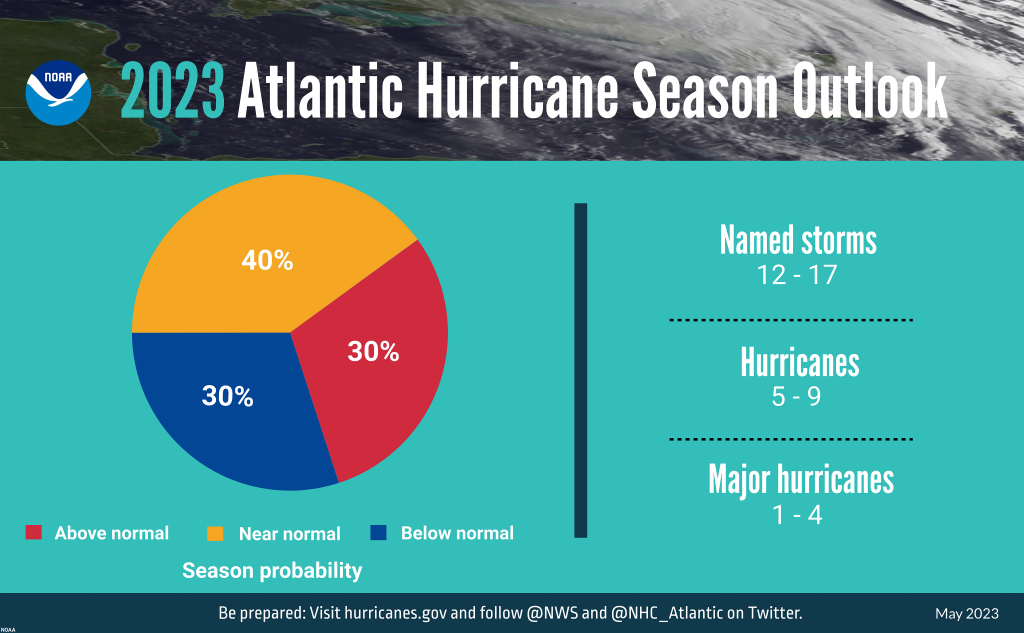 |
Why are the forecast ranges so wide? NOAA forecasters carefully craft their forecasts so that there is at least a 70 percent chance that the actual number of tropical storms, hurricanes, and major hurricanes will fall into those forecast ranges at the end of the season. If only a single forecast value was provided, the chance of that forecast verifying would be very small.
|
Hurricane Bertha struck in July 1996 bringing a gust to 92 mph at Wrightsville Beach, NC. The storm damaged or destroyed six fishing piers along the New Hanover and Pender county beaches. |
There are multiple competing factors in the ocean and atmosphere that make this season's hurricane outlook particularly challenging.
The official Atlantic Hurricane Season begins June 1 and lasts through November 30. The bulk of our significant local hurricane impacts have occurred in September or early October, however destructive storms can still affect the Carolinas during summer. Some of our more notable July and August hurricane strikes include:
The list of names for this year's tropical storms and hurricanes are:
| Arlene | Bret | Cindy | Don | Emily | Franklin | Gert |
| Harold | Idalia | Jose | Katie | Lee | Margot | Nigel |
| Ophelia | Philippe | Rina | Sean | Tammy | Vince | Whitney |
In the unlikely event all of the names on this list are used, there is a backup list of names ready.
Coastal and River Flooding
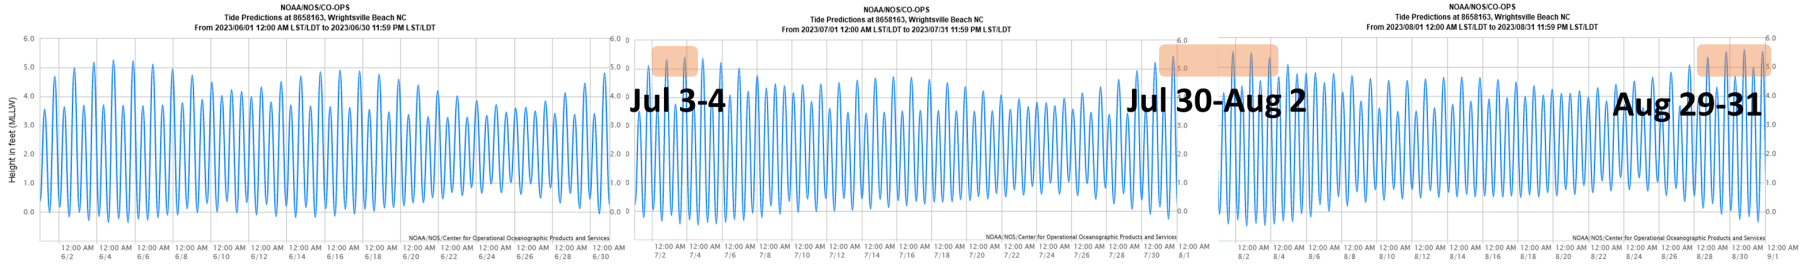
The risk of coastal flooding will be highest this summer during full moons on July 3, August 1, and August 30. These are times when astronomical tides will be large enough that only a modest period of onshore winds or a nearby storm system could easily produce coastal flooding. Tides associated with this summer's new moons on June 18, July 17, and August 16 will be smaller and should pose a lesser risk for flooding.
|
Coastal flood risk will be highest around full moons in early July, late July to early August, then again in late August |
Official astronomical tide forecasts are available for Wrightsville Beach and Myrtle Beach. We also produce a local 3-day Total Water Forecast which takes winds and storm surge into account for Wrightsville Beach and Myrtle Beach.
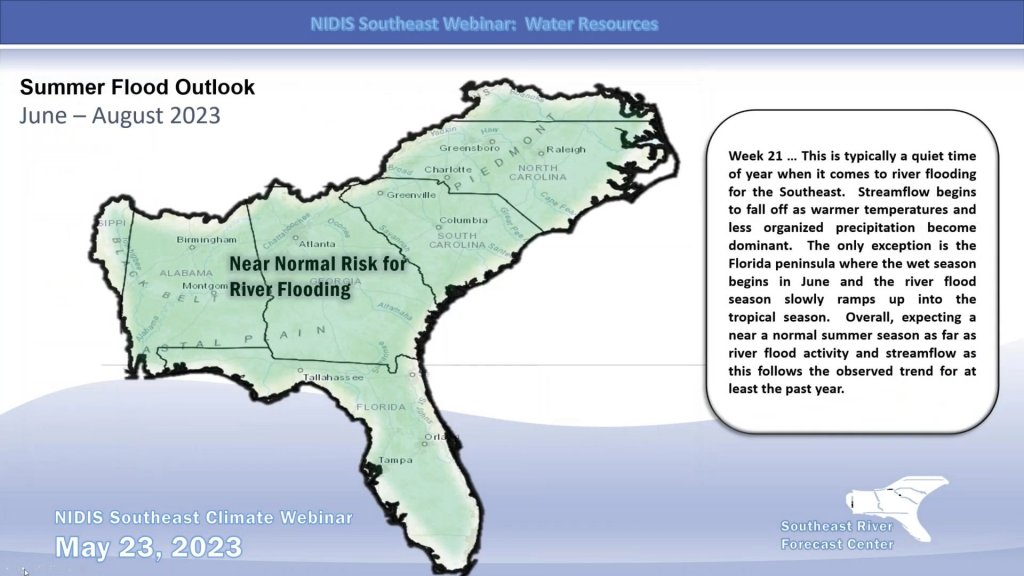
Probabilistic river stage forecasts produced by the Southeast River Forecast Center suggest a near normal potential for river flooding across the region this summer including the Carolinas. River levels going into summer are generally near to slightly below normal. Evaporation and water usage by trees and plants are both highest during the summer months, so it generally takes well above normal rainfall to lead to river flooding concerns.
|
The Southeast River Forecast Center predicts a near normal risk of river flooding across the Southeast this summer |
Long range probabilistic river outlooks are issued once a month for points along many of the larger rivers across the eastern Carolinas. Check our Advanced Hydrological Prediction Service (AHPS) page for these and for additional forecasts and outlooks.
Other Links of Interest
Research and Page Author: Tim Armstrong
Last Updated: May 31, 2023


 Coastal Flood