Winter Outlook 2016-2017
One of the most powerful El Niños in recorded history provided a very wet winter across the eastern Carolinas last year. December through February rainfall in Florence, SC was the 7th wettest in history at 14.55 inches, and in Wilmington, NC it was the 5th wettest with 17.57 inches of rain. Last winter's El Niño quickly faded away back in the spring. For this upcoming winter the pattern to watch is El Nino’s opposite: La Niña.

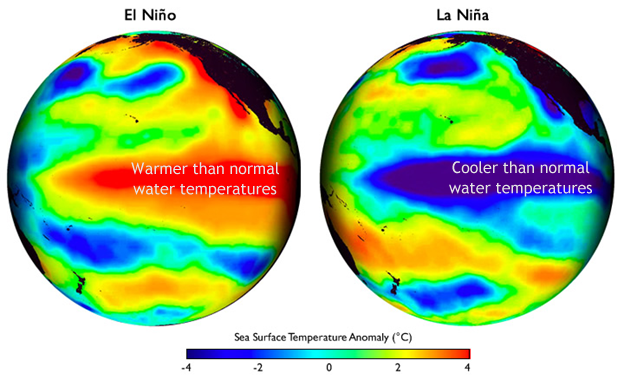
During La Niña, tropical Pacific Ocean temperature anomalies are reversed from those observed during El Niño. Cooler than normal water develops over the tropical East Pacific Ocean, and this suppresses the widespread thunderstorm activity that typically exists there. Instead of frequent storminess and heavy rainfall across the eastern Carolinas, La Niña typically provides the eastern Carolinas with dry, mild days, punctuated by occasional cold arctic outbreaks.
The La Niña expected to develop for the winter of 2016-2017 should be a weak one. This means the atmospheric response should also be weak. However, we can still use climate history as a guide to see what we might expect for this winter.
Since 1950 there have been 25 winters with weak La Niña conditions similar to what we expect to see this winter. Among those, 15 also had the Atlantic Multidecadal Oscillation
Rainfall
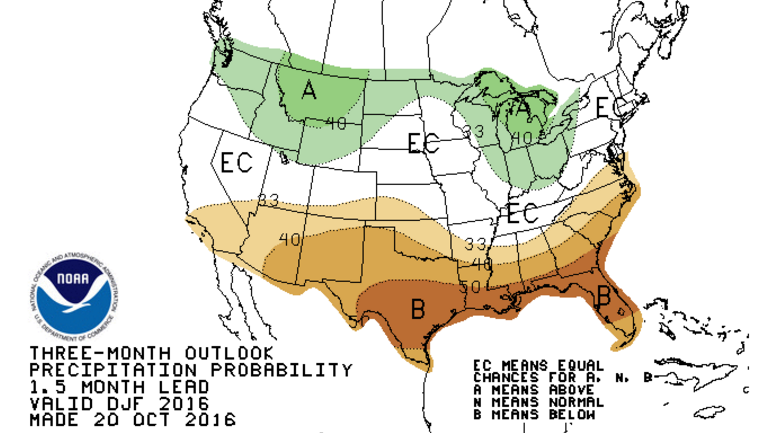
El Niño and La Niña’s largest impact in the Carolinas deals with wintertime rainfall totals. El Niño is typically associated with wetter than average winter weather, while La Niña is associated with drier than average winter weather. Our five La Niña analog winters fit this pattern quite well with observed precipitation totals averaging 20% below normal. In fact, during the 2001-2002 and 2008-2009 La Niña winters, precipitation totals were only half of their normal values! For the winter of 2016-2017 we are expecting precipitation totals to be lower than normal. Confidence is medium to high.
|
|
Average Winter Precipitation (1981-2010) |
1959-1960 |
1961-1962 |
2001-2002 |
2008-2009 |
2013-2014 |
Average of these five analog winters |
|
New Bern, NC |
10.93" |
15.44" |
8.80" |
8.15" |
7.68" |
8.92" |
9.80" (-1.13") |
|
Wilmington, NC |
11.10" |
11.66" |
9.03" |
5.10" |
6.64" |
7.19" |
7.92" (-3.18") |
|
Florence, SC |
9.10" |
13.87" |
9.25" |
3.65" |
4.82" |
10.05" |
8.33" (-0.77") |
|
Charleston, SC |
9.74" |
12.36" |
6.30" |
6.32" |
2.97" |
7.00" |
6.99" (-2.75") |
Temperatures
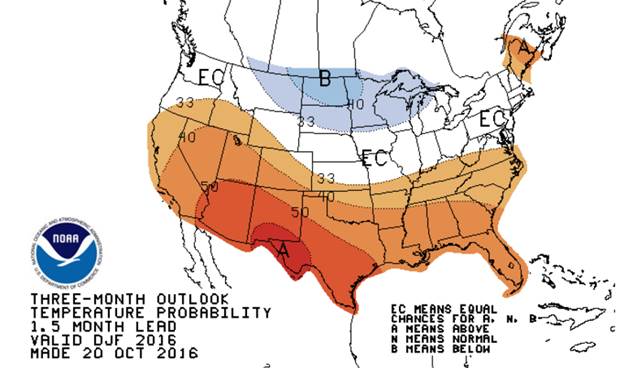
El Niño and La Niña episodes aren’t consistent in how they affect winter temperatures across the eastern Carolinas. There is a tendency for El Niño winters to have below-normal temperatures and for La Niña winters to have above-normal temperatures, but there are also many exceptions. Examining the five winters we’re using as analogs for this upcoming winter, temperatures averaged warmer than normal by one degree or less, but 20-40% of the time winter temperatures were actually below normal. For the winter of 2016-2017, we expect temperatures to average above normal, however, confidence is only low to medium.
|
|
Average Winter Temperature (1981-2010) |
1959-1960 |
1961-1962 |
2001-2002 |
2008-2009 |
2013-2014 |
Average of these five analog winters |
|
New Bern, NC |
46.1 |
46.3 |
47.7 |
49.0 |
45.7 |
46.8 |
47.1 (+1.0) |
|
Wilmington, NC |
47.7 |
46.8 |
48.5 |
50.6 |
48.3 |
48.0 |
48.5 (+0.3) |
|
Florence, SC |
47.1 |
46.5 |
47.8 |
49.6 |
47.8 |
46.6 |
47.7 (+0.6) |
|
Charleston, SC |
50.6 |
49.1 |
51.4 |
53.1 |
51.3 |
51.8 |
51.3 (+0.7) |
We can also examine winter temperatures by looking at just the coldest temperature recorded at any point in the winter. This minimum winter temperature can have agricultural impacts for cold sensitive winter field crops like collards, lettuce, spinach, and kale, and can also have infrastructure and societal impacts if water pipes become frozen or if the power grid becomes overwhelmed by high electrical demand for heating.
|
|
Average Coldest Winter Temp (1981-2010) |
1959-1960 |
1961-1962 |
2001-2002 |
2008-2009 |
2013-2014 |
Average of these five analog winters |
|
New Bern, NC |
15 |
19 |
13 |
23 |
15 |
12 |
16 (+1) |
|
Wilmington, NC |
16 |
19 |
16 |
23 |
15 |
14 |
17 (+1) |
|
Florence, SC |
15 |
18 |
16 |
19 |
14 |
12 |
16 (+1) |
|
Charleston, SC |
19 |
20 |
16 |
21 |
19 |
17 |
19 (normal) |
Our five analog winters show in most cases the coldest winter temperature was within +/- 3 degrees of normal values for each location, deviating above or below that range an average of 25% of the time. But this is a tiny sample size. Our outlook is for this winter's coldest temperature to reach near-normal values, but with low confidence.
In most winters the coldest temperatures occur during short-lived arctic outbreaks associated with a strongly negative phase of the North Atlantic Oscillation (NAO). It is not possible to forecast the phase of the NAO more than 1-2 weeks in advance, and it is unknown what NAO phase will dominate this winter.
Snowfall
Snow is quite rare across eastern South Carolina, and occurs infrequently enough over eastern North Carolina that standard statistical analysis is difficult. For example, Wilmington's annual average snowfall is 1.7 inches. However, snowfall statistics show we average less than one measurable snowfall event per year. The standard deviation computed for Wilmington's historic snowfall events is much larger than the annual average!
Of the five winters we are using as analogs for this upcoming winter, a simple average shows greater than normal snowfall for most locations in the eastern Carolinas. Charleston, SC is a notable exception. However, that average snowfall statistic is dominated by two or three individual snowstorms that skew the averages sharply upward.
|
|
Average Snowfall November-April (1981-2010) |
1959-1960 |
1961-1962 |
2001-2002 |
2008-2009 |
2013-2014 |
Average of these five analog winters |
|
New Bern, NC |
1.4" |
12.0" |
3.0" |
7.0"[3] |
Trace |
10.0" |
6.4" (+5.0") |
|
Wilmington, NC |
1.6" |
6.2" |
3.1" |
1.8" |
1.0" |
1.0" |
2.6" (+1.0") |
|
Florence, SC |
1.5" |
6.2" |
0.3" |
4.0"[4] |
2.5"[4] |
2.0"[4] |
3.0" (+1.5") |
|
Charleston, SC |
0.5" |
0.5" |
Trace |
Trace |
Trace |
Trace |
0.1" (-0.4") |
It is interesting that in all five of these analog winters, Wilmington and Florence have received at least some measurable snowfall. This indicates the three climate oscillations we are tracking this winter (La Niña, AMO, and QBO) don't necessarily rule a snowstorm out! A local climate summary of past snowfall is available for Wilmington, Myrtle Beach, and Florence.
Official NWS Climate Prediction Center Outlooks
The latest outlooks for this winter from the Climate Prediction Center show the odds are skewed in favor of warmer than normal temperatures and drier than normal precipitation totals for the eastern Carolinas. These outlooks are updated once per month.


[1] The Atlantic Multidecadal Oscillation (AMO) is an approximately 60-70 year cycle in water temperatures over the North Atlantic Ocean. The cycle consists of a ~30 year warm phase followed by a ~30 year cool phase, with impacts noted on Atlantic hurricane frequency and the severity of winter temperatures.
[2] The Quasi-biennial Oscillation (QBO) is a natural cycle in the direction of equatorial stratospheric winds. A complete QBO cycle averages about 28 months, split between an easterly (negative) and westerly (positive) phase in wind directions. When the easterly phase occurs during winter, it tends to create a weaker polar vortex allowing cold air to more easily dive southward across Northern Hemisphere landmasses.
[3] New Bern, NC snowfall was missing for the 2001-2002 winter, data was taken from the nearly Trenton, NC cooperative station.
[4] Florence, SC official snowfall data ended when the ASOS was installed at the Florence airport in 1999. This data is an unofficial extension constructed with help from Meteorologist Frank Johnson at WBTW TV.
Page Author: Tim Armstrong
Page Created: October 26, 2016
Last Updated: October 26, 2016