Outlooks from the NWS Climate Prediction Center show an increased likelihood of above normal temperatures this summer across North and South Carolina. There is a 40 to 50 percent chance that this summer's temperatures will land among the warmest one-third of previously observed summer seasons. This spring's temperatures also ran unusually warm across the eastern Carolinas with most local stations placing in the top 5 warmest spring seasons (March through May) on record.
|
The Climate Prediction Center's Summer 2025 outlook shows increased potential for above-normal temperatures across the lower 48 states including the Carolinas |
The El Niño Southern Oscillation (ENSO) is in its neutral phase and should not have a significant impact on temperatures across the Carolinas this summer. Forecast Discussions from NWS Climate Prediction Center forecasters reveal that recent dynamical and statistical models as well as the presence of unusually warm sea surface temperatures along the Southeast coast were used as inputs to their forecast.
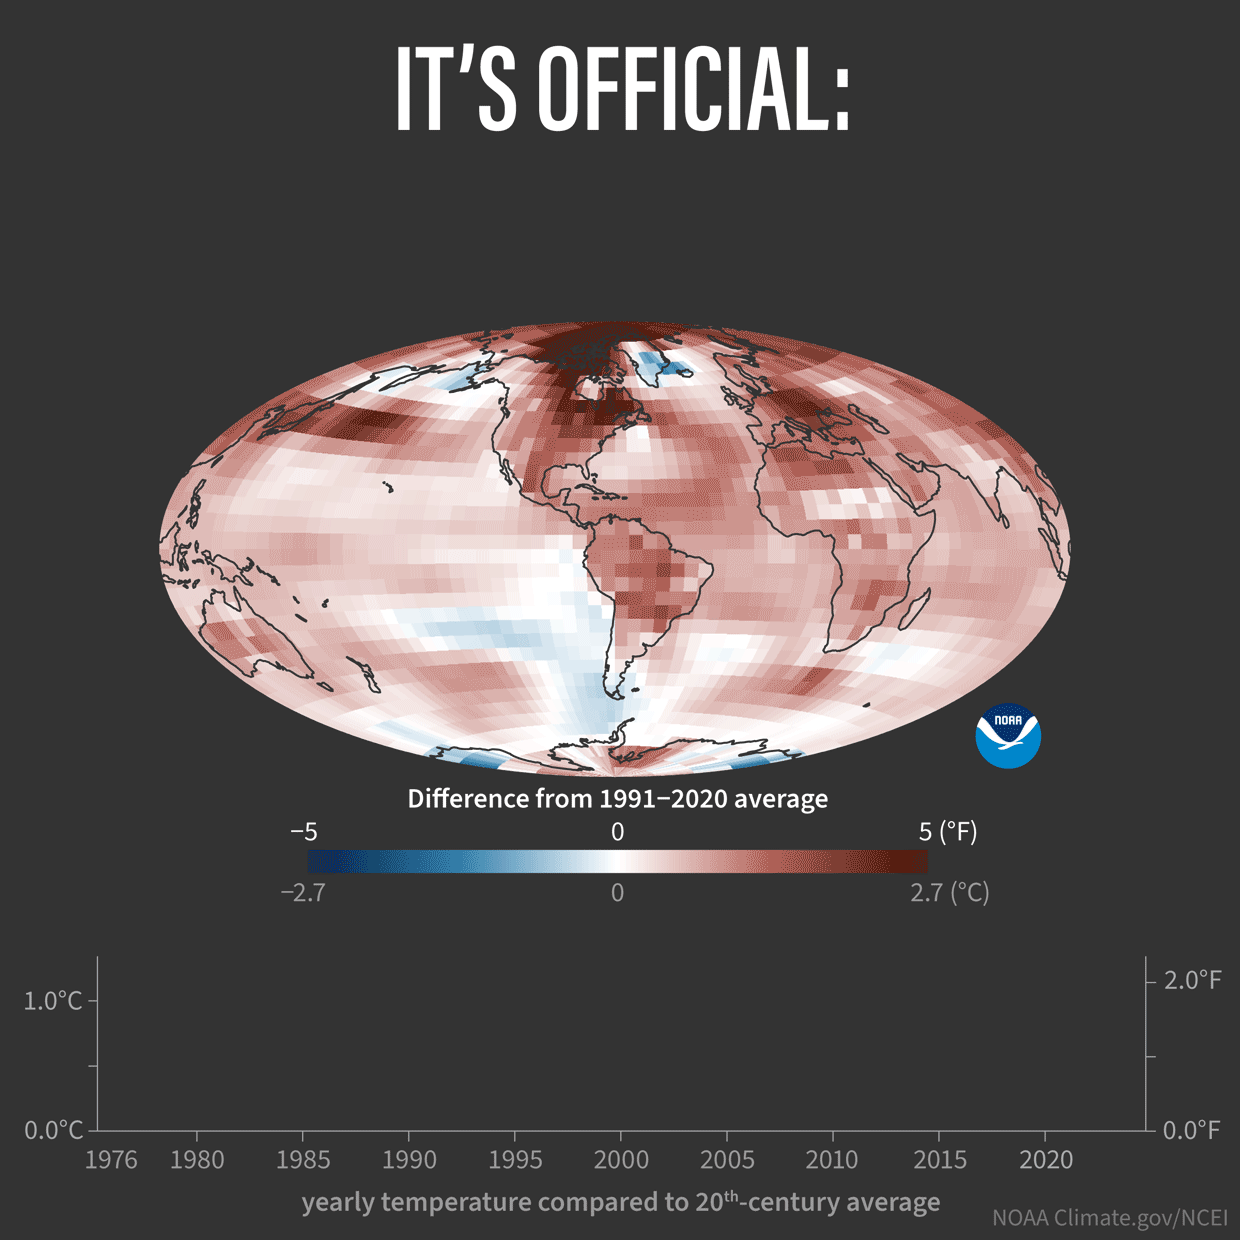
Another factor at work is ongoing climate change which increases the likelihood seasonal temperatures will run above normal. Globally, the two warmest years in the modern record were 2023 and 2024 and it's possible 2025 will rank among the warmest observed too. Global temperature records began in 1850.
 |
> > > Read more about Climate Change from NOAA
Locally observed average summer temperatures over the past five years have ranged from 0.7 degrees below normal (Florence, SC in 2023) to 1.2 degrees above normal (Wilmington, NC in 2022). Average summer temperatures are computed by taking each day's observed high and low temperature and averaging them together, then averaging these daily temperatures across the summer season.
| Wilmington | Lumberton | N. Myrtle Beach | Florence | |
| 1991-2020 AVERAGE SUMMER TEMPERATURE | 79.9° | 80.1° | 79.2° | 80.7° |
| 2020 observed (anomaly) | 80.5 (+0.6) | 79.5 (-0.6) | 80.2 (+1.0) | 81.1 (+0.4) |
| 2021 observed (anomaly) | 80.6 (+0.7) | 79.7 (-0.4) | 78.8 (-0.4) | 80.6 (-0.1) |
| 2022 observed (anomaly) | 81.1 (+1.2) | 80.9 (+0.8) | 79.3 (+0.1) | 81.6 (+0.9) |
| 2023 observed (anomaly) | 80.3 (+0.4) | 79.8 (-0.3) | 79.1 (-0.1) | 80.0 (-0.7) |
| 2024 observed (anomaly) | 80.4 (+0.5) | 81.2 (+1.1) | 79.9 (+0.7) | 81.6 (+0.9) |
| Average of the last five Summers | 80.6 (+0.7) | 80.3 (+0.2) | 79.5 (+0.3) | 81.0 (+0.3) |
Hot summer temperatures can increase heat stress to people, animals, and plants. Warmer temperatures also increase the amount of energy needed for air conditioning, driving up costs to families and businesses. Each one degree F increase in average temperature roughly equals a six percent increase in energy costs. Computed cooling degree days are used to estimate how much energy is used for cooling throughout a day, a month, or a season.
Rainfall and Drought
NWS Climate Prediction Center outlooks show an increased likelihood of above normal rainfall across the Carolinas. This forecast is based on a combination of above normal sea surface temperatures across the Gulf and Atlantic, plus input from long-range climate forecast models. Warmer ocean water can add additional moisture to the atmosphere through enhanced evaporation, allowing summer thunderstorms or any tropical cyclones to produce heavier rainfall rates.
 NWS Climate Prediction Center outlook for rainfall this summer NWS Climate Prediction Center outlook for rainfall this summer |
Precipitation observed during the past five summers (2020 through 2024) showed many local stations exceeded their 30-year average rainfall totals, in one case (Wilmington in 2021) by over ten inches.
| Wilmington | Lumberton | N. Myrtle Beach | Florence | |
| 1991-2020 AVERAGE SUMMER RAINFALL | 20.69" | 14.30" | 15.72" | 15.27" |
| 2020 observed (anomaly) | 24.24" (+3.55") | 18.02" (+3.72") | 15.73" (+0.01") | 18.66" (+3.39") |
| 2021 observed (anomaly) | 31.18" (+10.49") | 15.62" (+1.32") | 21.22" (+5.50") | 18.58" (+3.31") |
| 2022 observed (anomaly) | 19.13" (-1.56') | 14.12" (-0.18") | 21.33" (+5.61") | 11.48" (-3.79") |
| 2023 observed (anomaly) | 21.94" (+1.25") | 20.28" (+5.98") | 15.42" (-0.30") | 19.32" (+4.05") |
| 2024 observed (anomaly) | 25.08" (+4.39") | 17.74" (+3.44") | 24.01" (+8.29") | 19.01" (+3.74") |
| Average of the last five Summers | 22.54" (+1.85") | 16.39" (+2.09") | 19.63" (+3.91") | 17.16" (+1.89") |
Consistently below normal rainfall totals from October through the middle of this Spring led to an expansion of moderate to severe drought across the eastern Carolinas. Recent rain in May has helped erode the drought, and outlooks from the Climate Prediction Center suggest the drought may end entirely this summer if expected above-normal rainfall develops.
|
The current U.S. Drought Monitor shows moderate to severe drought continues across some portions of eastern North and South Carolina. |
Drought may finally end this summer according to CPC's Seasonal Drought Outlook |
Hurricane Season
NOAA's official Seasonal Hurricane Outlook calls for an active Atlantic Hurricane Season featuring 13 to 19 named storms, 6 to 10 hurricanes, and 3 to 5 major hurricanes. These forecast ranges are slightly above long-term averages (14 named storms, 7 hurricanes, and 3 major hurricanes) and highlight the importance of remaining aware of the threat this year's hurricane season poses to coastal residents. Hurricane season officially starts on June 1 and continues through the end of November.
 |
Sea surface temperatures are above normal across most of the Atlantic Ocean including the Gulf and Caribbean. Earlier negative temperature anomalies across the Atlantic's "main development region" between the African coast and the Caribbean have modified over the past month and temperatures in this region are approaching normal.
Tropical storms and hurricanes derive their strength from warm ocean water, so the additional oceanic heat available this season could help this process along.
|
Shades of yellow, orange, and red indicate warmer-than-normal ocean water. Source: NOAA Coral Reef Watch |
Last fall and winter featured a La Niña climate pattern. As eastern tropical Pacific sea surface temperatures returned toward normal, NWS Climate Prediction Center staff officially declared the end of La Niña in April and ENSO neutral conditions are now in place. These neutral conditions are expected to continue through the summer months.
During neutral years like this one, ENSO's influence on Atlantic tropical cyclones is reduced. La Niña years can lead to more and stronger Atlantic tropical cyclones, while El Niño years often feature fewer storms and overall weaker Atlantic activity.
|
|
Over the past 30 years there have been 11 times when neutral ENSO conditions were observed during the summer. Although there was significant season-to-season variability observed, the overall average is very close to the midpoint of this year's NOAA official seasonal outlook.
| Year | Tropical Storms | Hurricanes | Major Hurricanes | Notes |
| 1996 | 13 | 9 | 6 | La Niña transitioned to neutral |
| 2001 | 15 | 9 | 4 | La Niña transitioned to neutral |
| 2003 | 16 | 7 | 3 | El Niño transitioned to neutral |
| 2005 | 28 | 15 | 7 | El Niño transitioned to neutral |
| 2008 | 16 | 8 | 5 | La Niña transitioned to neutral |
| 2012 | 19 | 10 | 2 | La Niña transitioned to neutral |
| 2013 | 4 | 2 | 0 | Neutral throughout spring, summer, and fall |
| 2014 | 8 | 6 | 2 | Neutral throughout spring, summer, and fall |
| 2017 | 17 | 10 | 6 | Neutral throughout spring, summer, and fall |
| 2019 | 18 | 6 | 3 | El Niño transitioned to neutral |
| 2024 | 18 | 11 | 5 | El Niño transitioned to neutral |
| Average | 16.5 | 8.5 | 3.9 |
If we exhaust the entire Atlantic list of 21 names this hurricane season, there is a supplemental list of names approved by the World Meteorological Organization (WMO) that would be used.
Supplemental Atlantic Storm Names
| Adria | Heath | Orlanda |
| Braylen | Isla | Pax |
| Caridad | Jacobus | Ronin |
| Deshawn | Kenzie | Sophie |
| Emery | Lucio | Tayshaun |
| Foster | Makayla | Viviana |
| Gemma | Nolan | Will |
The complete Atlantic name list is available from the WMO at https://wmo.int/content/tropical-cyclone-naming/caribbean-sea-gulf-of-mexico-and-north-atlantic-names
Coastal Flooding Risk
Astronomical tides will not run excessively high this summer and significant coastal flooding is not likely to occur in the absence of a nearby tropical cyclone or strong onshore winds. Normally large tidal ranges will occur in the days surrounding new moons on June 25 and July 24.
|
Astronomical Tide Predictions for the of Summer 2025 |
The Monthly High Tide Flooding Outlook from the National Ocean Service has more details about each month's flooding risk.
Wildfire Risk
Forecasters with the National Interagency Fire Center (NIFC) monitor trends in drought, fuel moisture, and plant growth to create maps highlighting the hazards posed by wildfire. Their outlook shows an above-normal risk of wildfire across the coastal counties of eastern North and South Carolina in June, then a near normal wildfire risk for the remainder of the summer season.
|
NIFC Wildland Fire Potential Outlooks for June through August 2025 |
Avoid outdoor burning on days when recent dry weather, low relative humidity, and gusty winds coexist. Check our latest Fire Weather Forecast to see if weather conditions will allow safe burning.
Other Links of Interest
Research and Page Author: Tim Armstrong
Last Updated: May 30, 2025


 Coastal Flood