Andrews, South Carolina Spring and Fall Freeze Statistics
|
Andrews's average date for the last spring freeze is March 19
Spring freeze statistics sorted by probability
| Probability |
Date |
| 1% |
Feb 9 |
| 5% |
Feb 20 |
| 10% |
Feb 26 |
| 25% |
Mar 8 |
| 50% |
Mar 19 |
| 75% |
Mar 29 |
| 90% |
Apr 8 |
| 95% |
Apr 14 |
| 99% |
Apr 25 |
Earliest last spring freeze: Feb 14, 2012
Latest last spring freeze: April 24, 1986
|
Spring freeze statistics sorted by date
| Date |
Probability |
| Jan 25 |
0.0% |
| Feb 1 |
0.2% |
| Feb 5 |
0.4% |
| Feb 10 |
1.0% |
| Feb 15 |
2.2% |
| Feb 20 |
4.5% |
| Feb 25 |
8.3% |
| Mar 1 |
12.9% |
| Mar 5 |
18.9% |
| Mar 10 |
28.4% |
| Mar 15 |
39.8% |
| Mar 20 |
52.2% |
| Mar 25 |
64.4% |
| Mar 30 |
75.2% |
| Apr 5 |
85.5% |
| Apr 10 |
91.4% |
| Apr 15 |
95.4% |
| Apr 20 |
97.7% |
| Apr 25 |
98.9% |
| Apr 30 |
99.6% |
| May 5 |
99.8% |
| May 10 |
99.9% |
|
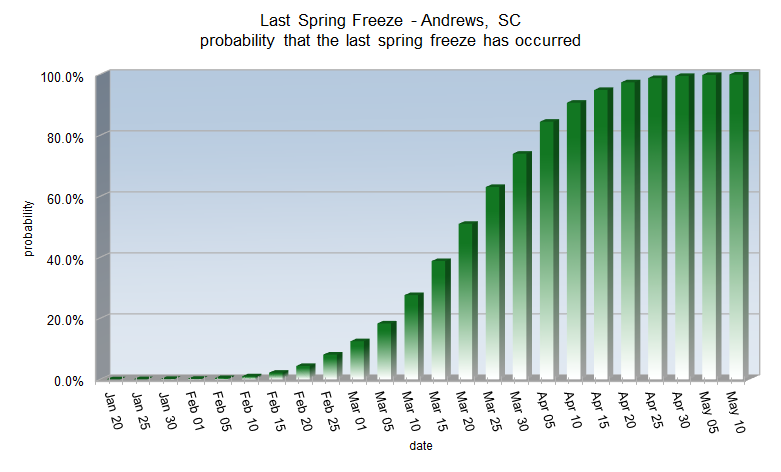
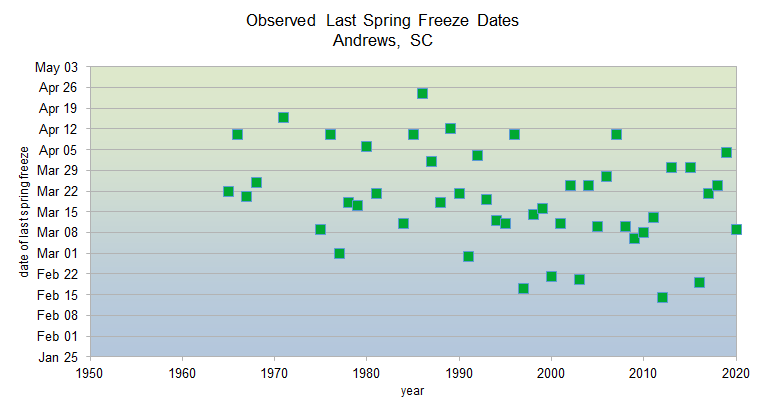
Since 1955, Andrews has 19 years of missing climate data. This makes it difficult to determine a statistically accurate change in spring freeze dates.
|
|
Andrews's average date for the first fall freeze is November 14
Fall freeze statistics sorted by probability
| Probability |
Date |
| 1% |
Oct 20 |
| 5% |
Oct 27 |
| 10% |
Oct 31 |
| 25% |
Nov 7 |
| 50% |
Nov 14 |
| 75% |
Nov 21 |
| 90% |
Nov 27 |
| 95% |
Dec 1 |
| 99% |
Dec 8 |
Earliest first fall freeze: October 25, 2006
Latest first fall freeze: December 11, 2009
|
Fall freeze statistics sorted by date
| Date |
Probability |
| Oct 1 |
0.0% |
| Oct 5 |
0.0% |
| Oct 10 |
0.0% |
| Oct 15 |
0.2% |
| Oct 20 |
0.9% |
| Oct 25 |
2.8% |
| Nov 1 |
10.7% |
| Nov 5 |
19.4% |
| Nov 10 |
34.8% |
| Nov 15 |
53.3% |
| Nov 20 |
71.1% |
| Nov 25 |
84.8% |
| Nov 30 |
93.3% |
| Dec 5 |
97.6% |
| Dec 10 |
99.3% |
| Dec 15 |
99.8% |
| Dec 20 |
100.0% |
| Dec 25 |
100.0% |
| Dec 30 |
100.0% |
|
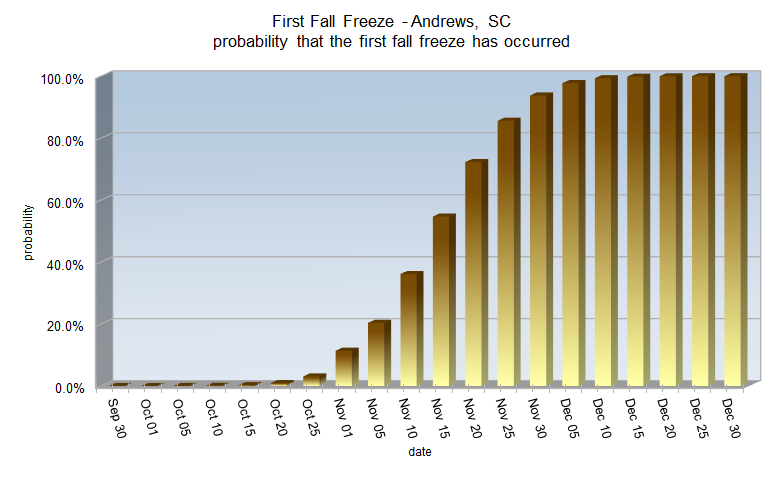
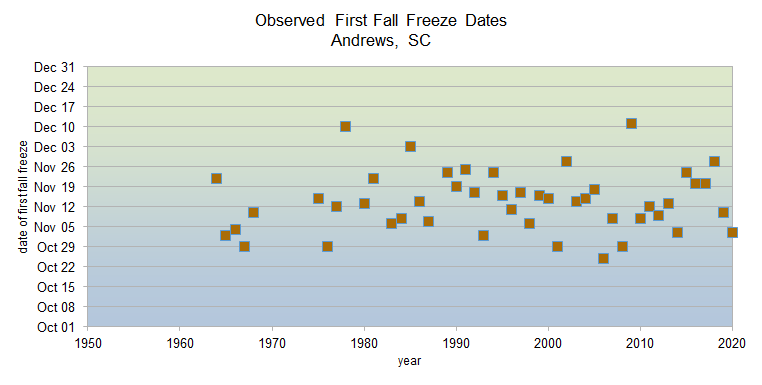
Since 1955, Andrews has 19 years of missing climate data. This makes it difficult to determine a statistically accurate change in fall freeze dates.
|
|
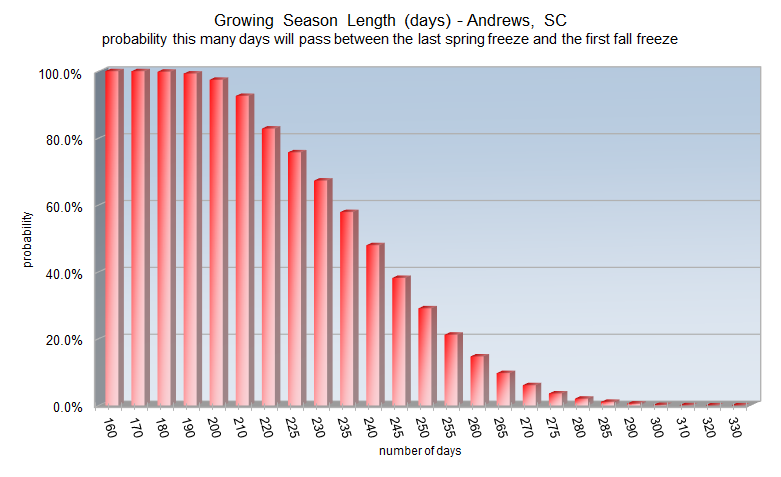
Andrews's average growing season length is 240 days
Growing season statistics sorted by probability
| Probability |
Days |
| 1% |
287 |
| 5% |
273 |
| 10% |
266 |
| 25% |
254 |
| 50% |
240 |
| 75% |
226 |
| 90% |
214 |
| 95% |
207 |
| 99% |
193 |
Shortest growing season: 201 days in 1976
Longest growing season: 280 days in 2024
|
Growing season statistics sorted by days
| Days |
Probability |
| 160 |
100.0% |
| 170 |
100.0% |
| 180 |
99.9% |
| 190 |
99.4% |
| 200 |
97.7% |
| 210 |
93.2% |
| 220 |
84.0% |
| 225 |
77.2% |
| 230 |
69.0% |
| 235 |
59.8% |
| 240 |
50.0% |
| 245 |
40.2% |
| 250 |
31.0% |
| 255 |
22.8% |
| 260 |
16.0% |
| 270 |
6.8% |
| 280 |
2.3% |
| 290 |
0.6% |
| 300 |
0.1% |
|
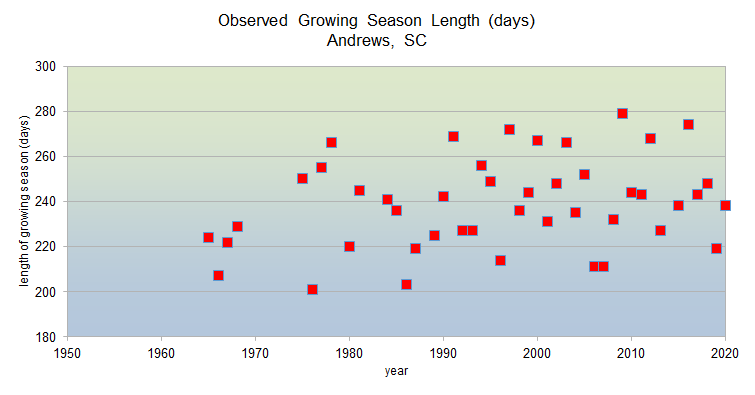
Since 1955, Andrews has 19 years of missing climate data. This makes it difficult to determine a statistically accurate change in growing season length.
|
Research and Page Author: Tim Armstrong & Vicky Oliva
Last Updated: September 17, 2026



 Radar
Radar Current Weather
 Rivers & Lakes
 Satellite
 Forecast Maps
 Hour by Hour Forecast
 Tropical Weather
 Graphical Hazards
 Weather Hazard Briefing
 Forecaster's Discussion
 Text Bulletins
 Climate
 Skywarn
 NOAA Weather Radio
 Sunrise/Sunset
 Marine Forecasts
 Beach & Surf
 Coastal Flood
  Follow us on X
 Follow us on Facebook
 Follow us on YouTube
 ILM RSS Feed