Lake City, South Carolina Spring and Fall Freeze Statistics
|
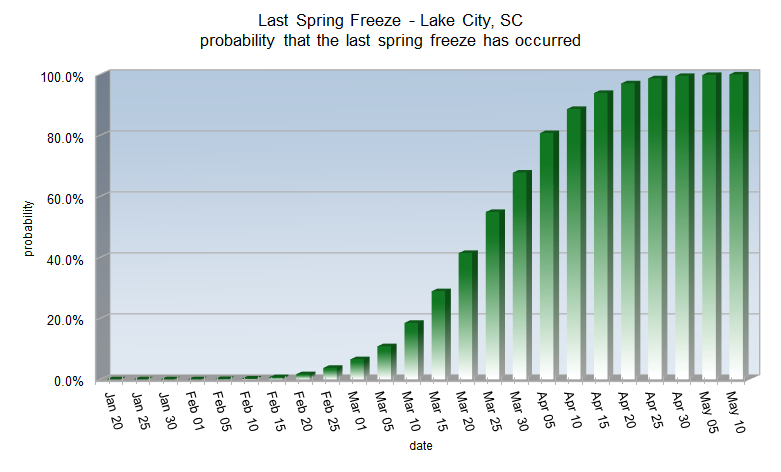
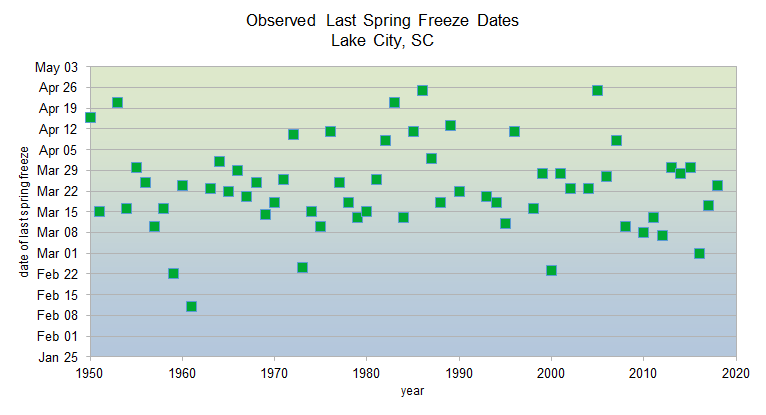
Lake City's average date for the last spring freeze is March 23
Spring freeze statistics sorted by probability
| Probability |
Date |
| 1% |
Feb 16 |
| 5% |
Feb 26 |
| 10% |
Mar 4 |
| 25% |
Mar 13 |
| 50% |
Mar 23 |
| 75% |
Apr 2 |
| 90% |
Apr 11 |
| 95% |
Apr 16 |
| 99% |
Apr 26 |
Earliest last spring freeze: Feb 9, 1945
Latest last spring freeze: April 25, 1986
|
Spring freeze statistics sorted by date
| Date |
Probability |
| Jan 25 |
0.0% |
| Feb 1 |
0.0% |
| Feb 5 |
0.1% |
| Feb 10 |
0.3% |
| Feb 15 |
0.7% |
| Feb 20 |
1.7% |
| Feb 25 |
3.8% |
| Mar 1 |
6.6% |
| Mar 5 |
10.9% |
| Mar 10 |
18.5% |
| Mar 15 |
28.9% |
| Mar 20 |
41.4% |
| Mar 25 |
54.9% |
| Mar 30 |
67.8% |
| Apr 5 |
80.8% |
| Apr 10 |
88.6% |
| Apr 15 |
93.9% |
| Apr 20 |
97.0% |
| Apr 25 |
98.7% |
| Apr 30 |
99.5% |
| May 5 |
99.8% |
| May 10 |
99.9% |
|
Since 1950, Lake City has 14 years of missing climate data. This makes it difficult to determine a statistically accurate change in spring freeze dates.
|
|
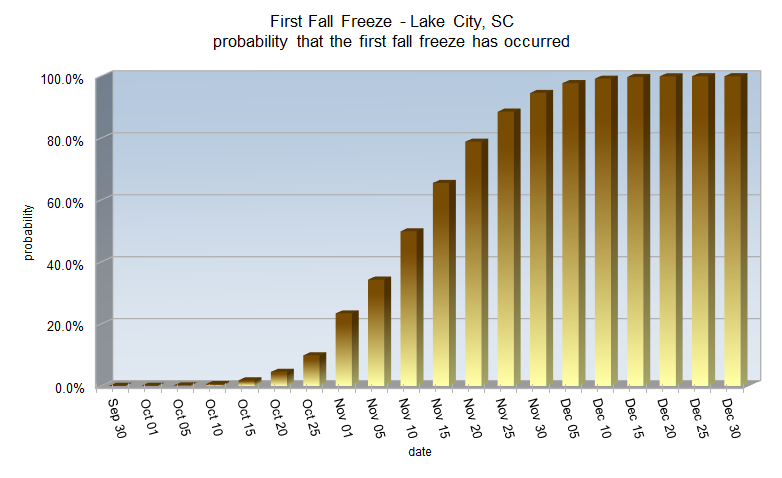
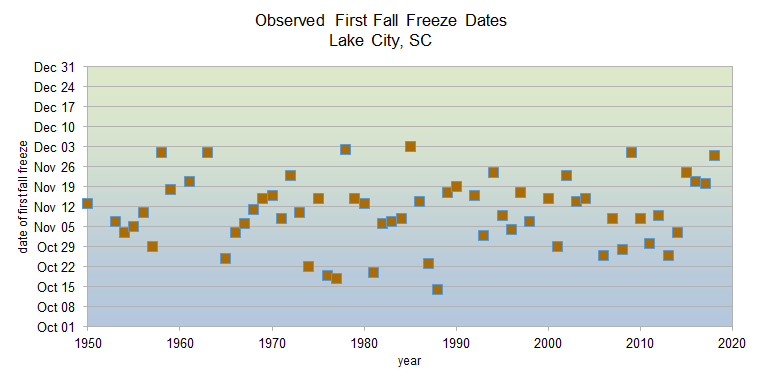
Lake City's average date for the first fall freeze is November 10
Fall freeze statistics sorted by probability
| Probability |
Date |
| 1% |
Oct 12 |
| 5% |
Oct 20 |
| 10% |
Oct 25 |
| 25% |
Nov 1 |
| 50% |
Nov 10 |
| 75% |
Nov 18 |
| 90% |
Nov 25 |
| 95% |
Nov 30 |
| 99% |
Dec 8 |
Earliest first fall freeze: October 14, 1988
Latest first fall freeze: December 11, 1948
|
Fall freeze statistics sorted by date
| Date |
Probability |
| Oct 1 |
0.1% |
| Oct 5 |
0.2% |
| Oct 10 |
0.6% |
| Oct 15 |
1.8% |
| Oct 20 |
4.6% |
| Oct 25 |
9.9% |
| Nov 1 |
23.4% |
| Nov 5 |
34.3% |
| Nov 10 |
49.9% |
| Nov 15 |
65.5% |
| Nov 20 |
78.9% |
| Nov 25 |
88.6% |
| Nov 30 |
94.6% |
| Dec 5 |
97.8% |
| Dec 10 |
99.2% |
| Dec 15 |
99.8% |
| Dec 20 |
99.9% |
| Dec 25 |
100.0% |
| Dec 30 |
99.7% |
|
Since 1950, Lake City has 14 years of missing climate data. This makes it difficult to determine a statistically accurate change in fall freeze dates.
|
|
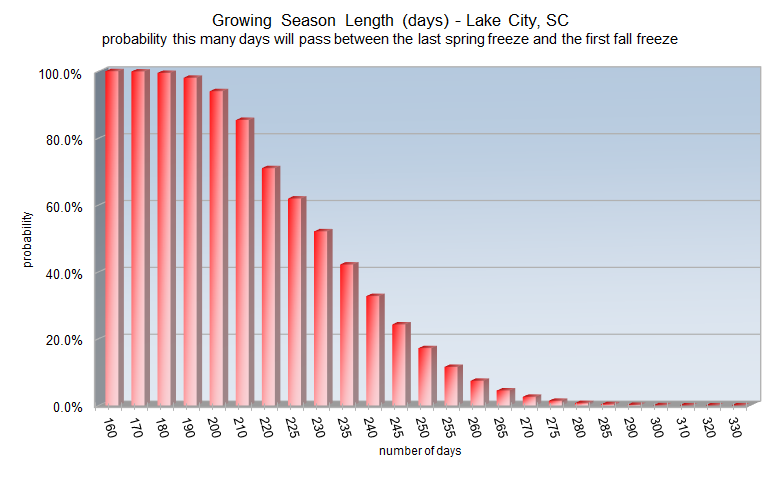
Lake City's average growing season length is 231 days
Growing season statistics sorted by probability
| Probability |
Days |
| 1% |
278 |
| 5% |
264 |
| 10% |
257 |
| 25% |
245 |
| 50% |
231 |
| 75% |
218 |
| 90% |
205 |
| 95% |
198 |
| 99% |
185 |
Shortest growing season: 190 days in 1976
Longest growing season: 282 days in 1961
|
Growing season statistics sorted by days
| Days |
Probability |
| 160 |
100.0% |
| 170 |
99.9% |
| 180 |
99.5% |
| 190 |
98.0% |
| 200 |
94.0% |
| 210 |
85.4% |
| 220 |
71.0% |
| 225 |
61.9% |
| 230 |
52.1% |
| 235 |
42.1% |
| 240 |
32.7% |
| 245 |
24.2% |
| 250 |
17.1% |
| 255 |
11.5% |
| 260 |
7.4% |
| 270 |
2.6% |
| 280 |
0.7% |
| 290 |
0.2% |
| 300 |
0.0% |
|
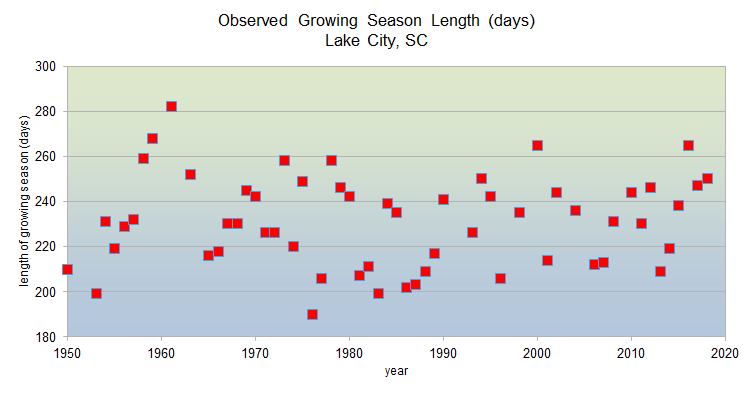
Since 1950, Lake City has 14 years of missing climate data. This makes it difficult to determine a statistically accurate change in growing season length.
|
Research and Page Author: Tim Armstrong
Last Updated: March 5, 2021


 Coastal Flood