North Myrtle Beach, South Carolina Spring and Fall Freeze Statistics
|
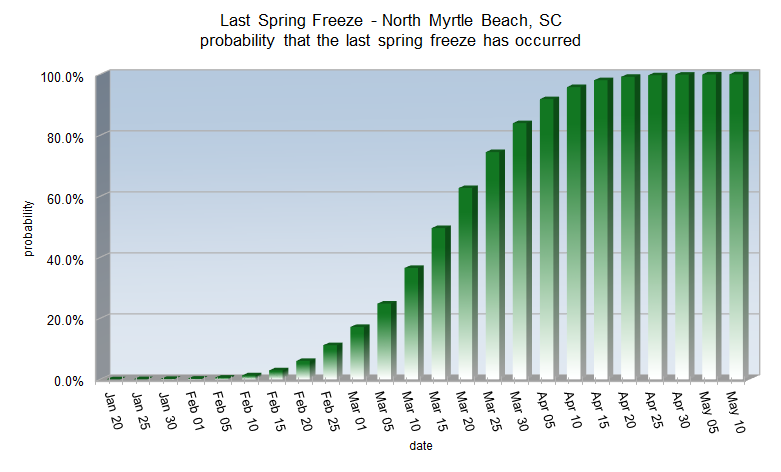
North Myrtle Beach's average date for the last spring freeze is March 15
Spring freeze statistics sorted by probability
| Probability |
Date |
| 1% |
Feb 8 |
| 5% |
Feb 18 |
| 10% |
Feb 24 |
| 25% |
Mar 5 |
| 50% |
Mar 15 |
| 75% |
Mar 25 |
| 90% |
Apr 3 |
| 95% |
Apr 8 |
| 99% |
Apr 18 |
Earliest last spring freeze: Feb 9, 1945
Latest last spring freeze: April 22, 1943
|
Spring freeze statistics sorted by date
| Date |
Probability |
| Jan 25 |
0.0% |
| Feb 1 |
0.2% |
| Feb 5 |
0.5% |
| Feb 10 |
1.3% |
| Feb 15 |
3.0% |
| Feb 20 |
6.1% |
| Feb 25 |
11.2% |
| Mar 1 |
17.2% |
| Mar 5 |
24.8% |
| Mar 10 |
35.6% |
| Mar 15 |
49.6% |
| Mar 20 |
62.7% |
| Mar 25 |
74.5% |
| Mar 30 |
84.0% |
| Apr 5 |
91.9% |
| Apr 10 |
95.8% |
| Apr 15 |
98.1% |
| Apr 20 |
99.2% |
| Apr 25 |
99.7% |
| Apr 30 |
99.9% |
| May 5 |
100.0% |
| May 10 |
100.0% |
|
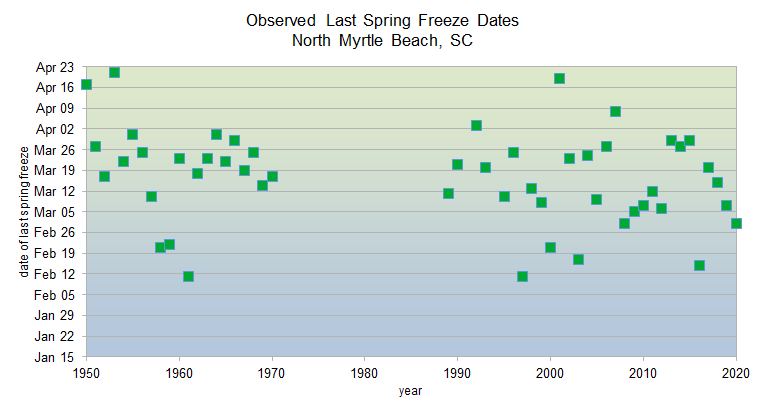
Since 1950, North Myrtle Beach has 20 years of missing climate data. This makes it difficult to determine a statistically accurate change in spring freeze dates.
|
|
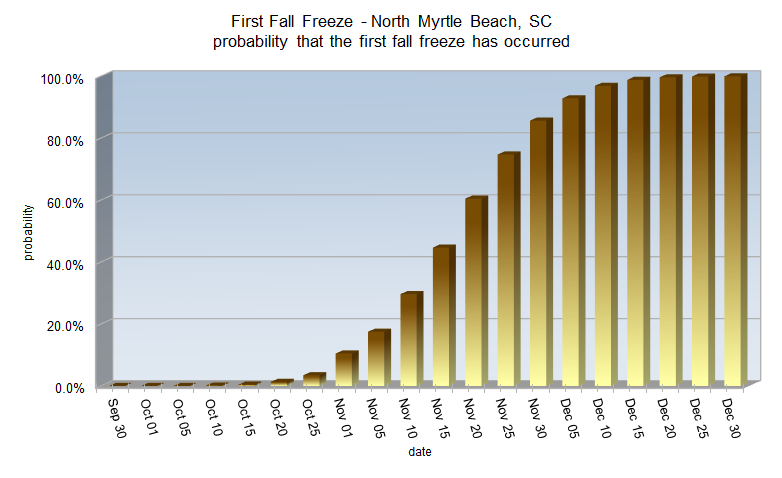
North Myrtle Beach's average date for the first fall freeze is November 16
Fall freeze statistics sorted by probability
| Probability |
Date |
| 1% |
Oct 18 |
| 5% |
Oct 27 |
| 10% |
Oct 31 |
| 25% |
Nov 8 |
| 50% |
Nov 16 |
| 75% |
Nov 25 |
| 90% |
Dec 2 |
| 95% |
Dec 7 |
| 99% |
Dec 15 |
Earliest first fall freeze: October 26, 1962
Latest first fall freeze: December 22, 1948
|
Fall freeze statistics sorted by date
| Date |
Probability |
| Oct 1 |
0.0% |
| Oct 5 |
0.0% |
| Oct 10 |
0.1% |
| Oct 15 |
0.4% |
| Oct 20 |
1.3% |
| Oct 25 |
3.5% |
| Nov 1 |
10.5% |
| Nov 5 |
17.5% |
| Nov 10 |
29.7% |
| Nov 15 |
44.7% |
| Nov 20 |
60.5% |
| Nov 25 |
74.7% |
| Nov 30 |
85.7% |
| Dec 5 |
92.9% |
| Dec 10 |
96.9% |
| Dec 15 |
98.9% |
| Dec 20 |
99.6% |
| Dec 25 |
99.9% |
| Dec 30 |
100.0% |
|
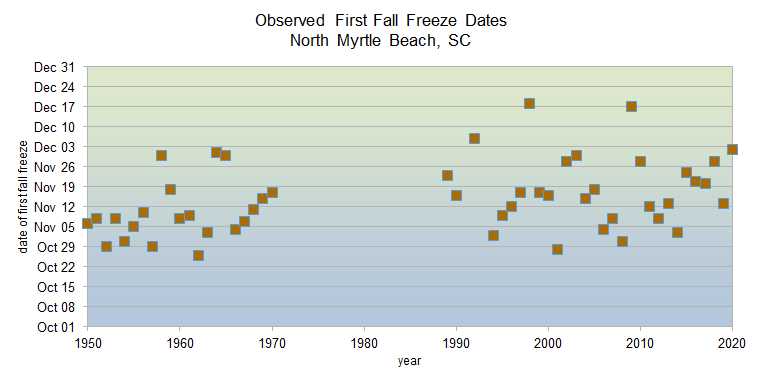
Since 1950, North Myrtle Beach has 20 years of missing climate data. This makes it difficult to determine a statistically accurate change in fall freeze dates.
|
|
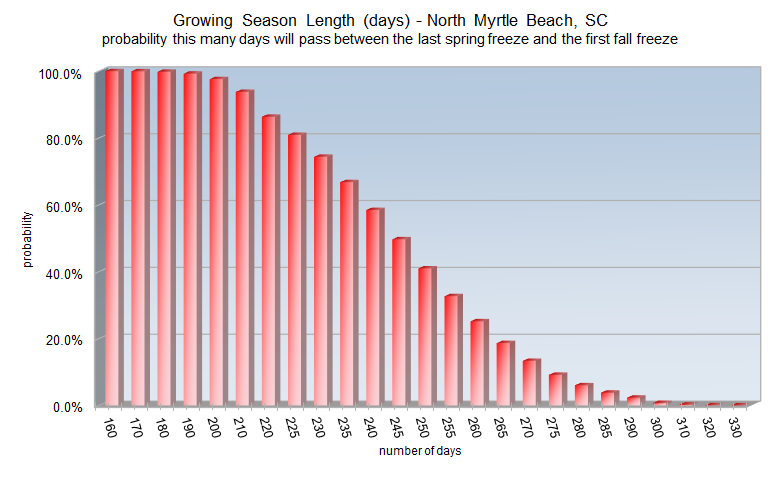
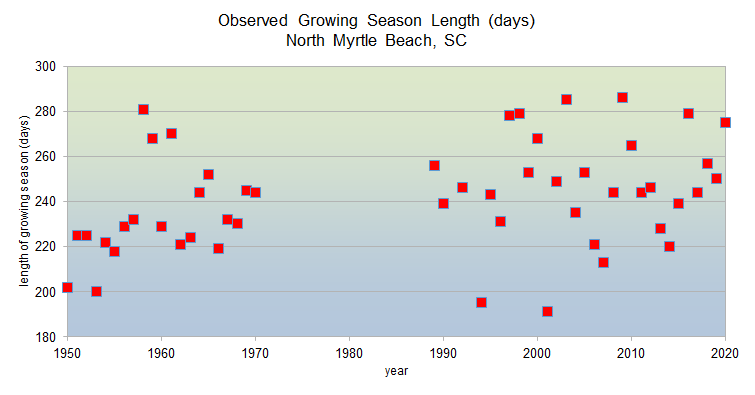
North Myrtle Beach's average growing season length is 245 days
Growing season statistics sorted by probability
| Probability |
Days |
| 1% |
298 |
| 5% |
282 |
| 10% |
274 |
| 25% |
260 |
| 50% |
245 |
| 75% |
230 |
| 90% |
216 |
| 95% |
208 |
| 99% |
192 |
Shortest growing season: 191 days in 2001
Longest growing season: 286 days in 2009
|
Growing season statistics sorted by days
| Days |
Probability |
| 160 |
100.0% |
| 170 |
100.0% |
| 180 |
99.8% |
| 190 |
99.2% |
| 200 |
97.6% |
| 210 |
93.8% |
| 220 |
86.3% |
| 225 |
80.9% |
| 230 |
74.4% |
| 235 |
66.8% |
| 240 |
58.4% |
| 245 |
49.7% |
| 250 |
41.0% |
| 255 |
32.7% |
| 260 |
25.1% |
| 270 |
13.3% |
| 280 |
6.0% |
| 290 |
2.3% |
| 300 |
0.7% |
|
Since 1950, North Myrtle Beach has 20 years of missing climate data. This makes it difficult to determine a statistically accurate change in growing season length.
|
Research and Page Author: Tim Armstrong
Last Updated: March 4, 2021


 Coastal Flood