Whiteville, North Carolina Spring and Fall Freeze Statistics
|
Whiteville's average date for the last spring freeze is March 29
Spring freeze statistics sorted by probability
| Probability |
Date |
| 1% |
Feb 23 |
| 5% |
Mar 5 |
| 10% |
Mar 11 |
| 25% |
Mar 19 |
| 50% |
Mar 29 |
| 75% |
Apr 8 |
| 90% |
Apr 17 |
| 95% |
Apr 22 |
| 99% |
May 2 |
Earliest last spring freeze: February 23, 2000
Latest last spring freeze: May 2, 1963
|
Spring freeze statistics sorted by date
| Date |
Probability |
| Jan 25 |
0.0% |
| Feb 1 |
0.0% |
| Feb 5 |
0.0% |
| Feb 10 |
0.1% |
| Feb 15 |
0.2% |
| Feb 20 |
0.5% |
| Feb 25 |
1.2% |
| Mar 1 |
2.4% |
| Mar 5 |
4.5% |
| Mar 10 |
8.8% |
| Mar 15 |
15.6% |
| Mar 20 |
25.3% |
| Mar 25 |
37.5% |
| Mar 30 |
51.0% |
| Apr 5 |
67.0% |
| Apr 10 |
78.4% |
| Apr 15 |
87.1% |
| Apr 20 |
93.0% |
| Apr 25 |
96.6% |
| Apr 30 |
98.5% |
| May 5 |
99.4% |
| May 10 |
99.8% |
|
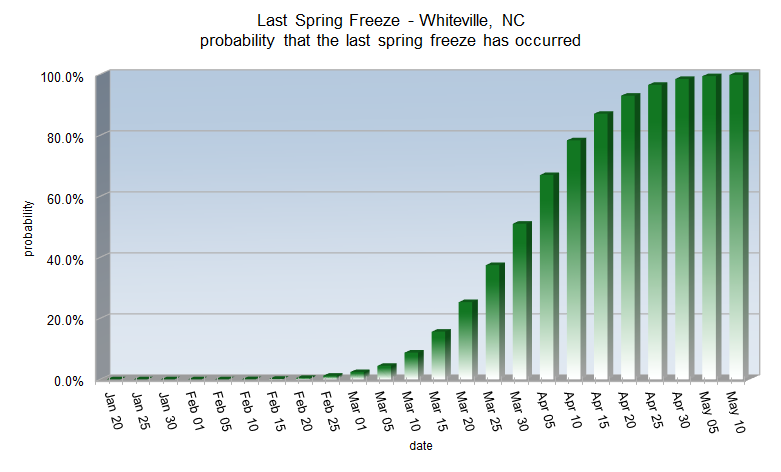

Since 1950, the date of Whiteville's last spring freeze has shifted 2.1 days earlier per decade.
|
|
Whiteville's average date for the first fall freeze is November 2
Fall freeze statistics sorted by probability
| Probability |
Date |
| 1% |
Oct 5 |
| 5% |
Oct 13 |
| 10% |
Oct 18 |
| 25% |
Oct 25 |
| 50% |
Nov 2 |
| 75% |
Nov 10 |
| 90% |
Nov 18 |
| 95% |
Nov 22 |
| 99% |
Dec 1 |
Earliest first fall freeze: October 4, 1974
Latest first fall freeze: November 29, 2009
|
Fall freeze statistics sorted by date
| Date |
Probability |
| Oct 1 |
0.4% |
| Oct 5 |
0.9% |
| Oct 10 |
2.6% |
| Oct 15 |
6.3% |
| Oct 20 |
13.1% |
| Oct 25 |
23.8% |
| Nov 1 |
44.4% |
| Nov 5 |
57.4% |
| Nov 10 |
72.5% |
| Nov 15 |
84.3% |
| Nov 20 |
92.2% |
| Nov 25 |
96.6% |
| Nov 30 |
98.7% |
| Dec 5 |
99.6% |
| Dec 10 |
99.9% |
| Dec 15 |
100.0% |
| Dec 20 |
100.0% |
| Dec 25 |
100.0% |
| Dec 30 |
100.0% |
|
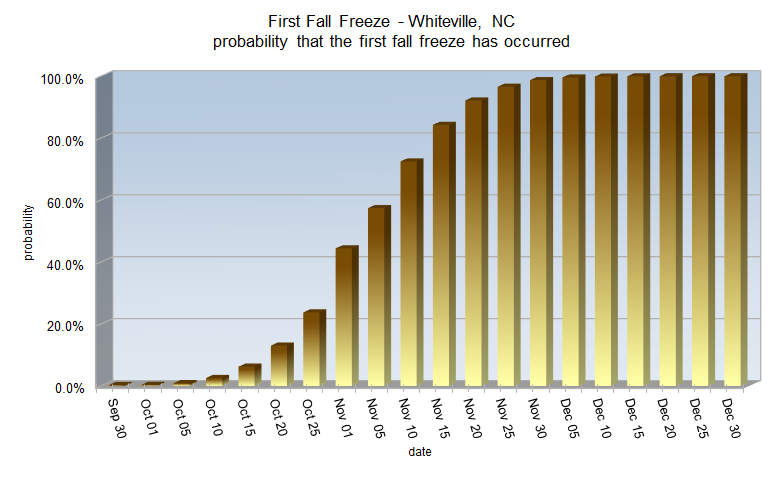
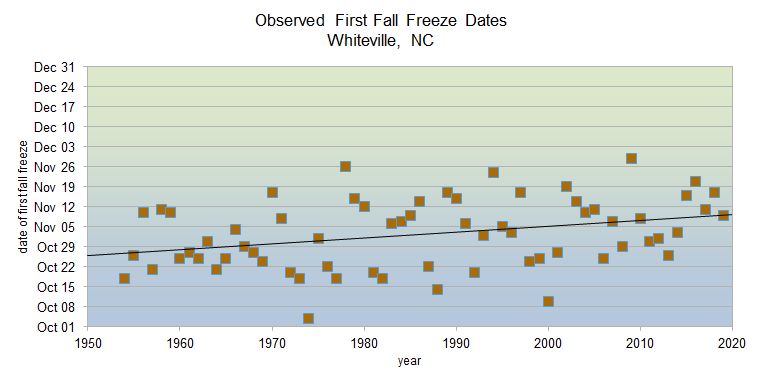
Since 1950, the date of Whiteville's first fall freeze has shifted 2.1 days later per decade.
|
|
Whiteville's average growing season length is 217 days
Growing season statistics sorted by probability
| Probability |
Days |
| 1% |
262 |
| 5% |
249 |
| 10% |
242 |
| 25% |
230 |
| 50% |
217 |
| 75% |
204 |
| 90% |
192 |
| 95% |
185 |
| 99% |
172 |
Shortest growing season: 176 days in 1974
Longest growing season: 259 days in 1978
|
Growing season statistics sorted by days
| Days |
Probability |
| 160 |
99.8% |
| 170 |
99.3% |
| 180 |
97.3% |
| 190 |
92.0% |
| 200 |
81.2% |
| 210 |
64.4% |
| 220 |
44.0% |
| 225 |
34.1% |
| 230 |
25.2% |
| 235 |
17.7% |
| 240 |
11.7% |
| 245 |
7.4% |
| 250 |
4.4% |
| 255 |
2.5% |
| 260 |
1.3% |
| 270 |
0.3% |
| 280 |
0.1% |
| 290 |
0.0% |
| 300 |
0.0% |
|

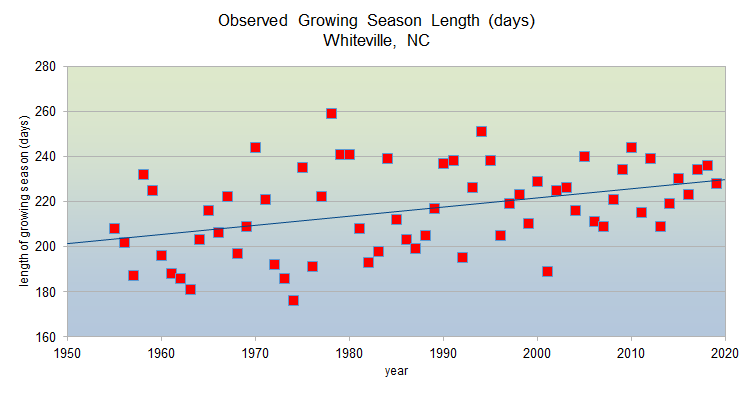
Since 1950, Whiteville's growing season has become 4.0 days longer per decade.
|
Research and Page Author: Tim Armstrong
Last Updated: February 28, 2021


 Coastal Flood