Virtual Tour Navigation: Go Back | Go Forward | Tour Directory
Page: 1 2 3 4 5 6 7 8 9 10 11 12 13 14 15 16 17 18
 Probably the most important observational tool we use at a NWS forecast office is the radar. Radar, which stands for RAdio Detection And Ranging, has been utilized to detect precipitation, and especially thunderstorms, since the 1940's. Radar enhancements have enabled NWS forecasters to examine storms with increased precision. Because of its high resolution and ability to detect intra-cloud motions, the Doppler radar is now the cornerstone of NWS severe weather warning operations.
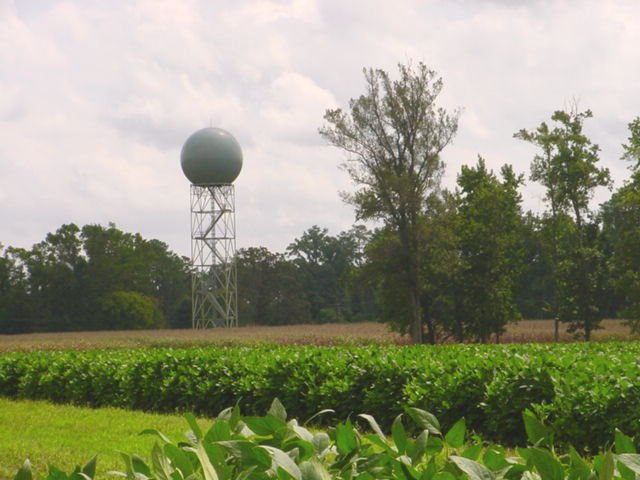
The radar used by the National Weather Service is called the WSR-88D, which stands for Weather Surveillance Radar - 1988 Doppler (the prototype radar was built in 1988). As its name suggests, the WSR-88D is a Doppler radar, meaning it can detect motions toward or away from the radar as well as the location of precipitation areas. There are 158 WSR-88D Doppler radars in the nation, including the U.S. Territory of Guam and the Commonwealth of Puerto Rico. The radars are operated by the National Weather Service and the Department of Defense. Our radar (see photo above and latest image to the right) is located near Clayton, North Carolina which is located about 10 miles southeast of Raleigh. Click here to see the current NWS Raleigh radar data.
As the radar antenna turns, it emits extremely short bursts of radio waves, called pulses. Each pulse lasts about 0.0000016 second, with a 0.00019-second "listening period" in between. The transmitted radio waves move through the atmosphere at about the speed of light.
By recording the direction in which the antenna was pointed, the direction of the target is known as well. Generally, the better the target is at reflecting radio waves (i.e., more raindrops, larger hailstones, etc.), the stronger the reflected radio waves, or echo, will be. This information is observed within the 0.00019-second listening period with the process repeated up to 1,300 times per second. By keeping track of the time it takes the radio waves to leave the antenna, hit the target, and return to the antenna, the radar can calculate the distance to the target.
By their design, Doppler radar systems can provide information regarding the movement of targets as well their position. When the WSR-88D transmits a pulse of radio waves, the system keeps track of the phase (shape, position, and form) of the transmitted radio waves. By measuring the shift in phase between a transmitted pulse and a received echo, the target's radial velocity (the movement of the target directly toward or away from the radar) can be calculated. Our Doppler radar continually scans the skies up to 250 miles in every direction from the radar and beams back information on the intensity of the storms it detects.
Most people are familiar with the "reflectivity" data (example image just below) that the radar produces. This data is the colorful picture most people see on TV and on the internet that shows where the storms are and how strong they are.
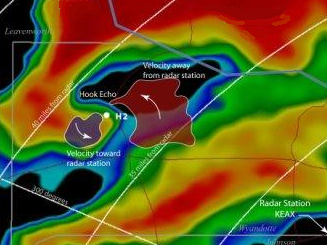
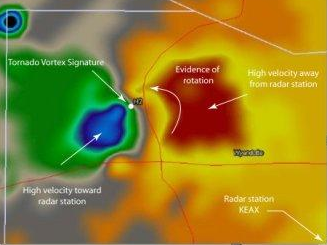
Another useful product the radar produces is the "velocity" or Doppler data (example image just below), which shows which way the winds are blowing in the atmosphere. Areas that are colored yellow and red indicate winds that are blowing away from the radar site. Areas that are colored in green and blue indicate winds that are blowing toward the radar site. The radar site in the pictures below is located to the southeast of these images. The brighter the color, the faster the wind is moving.


 Heat Safety
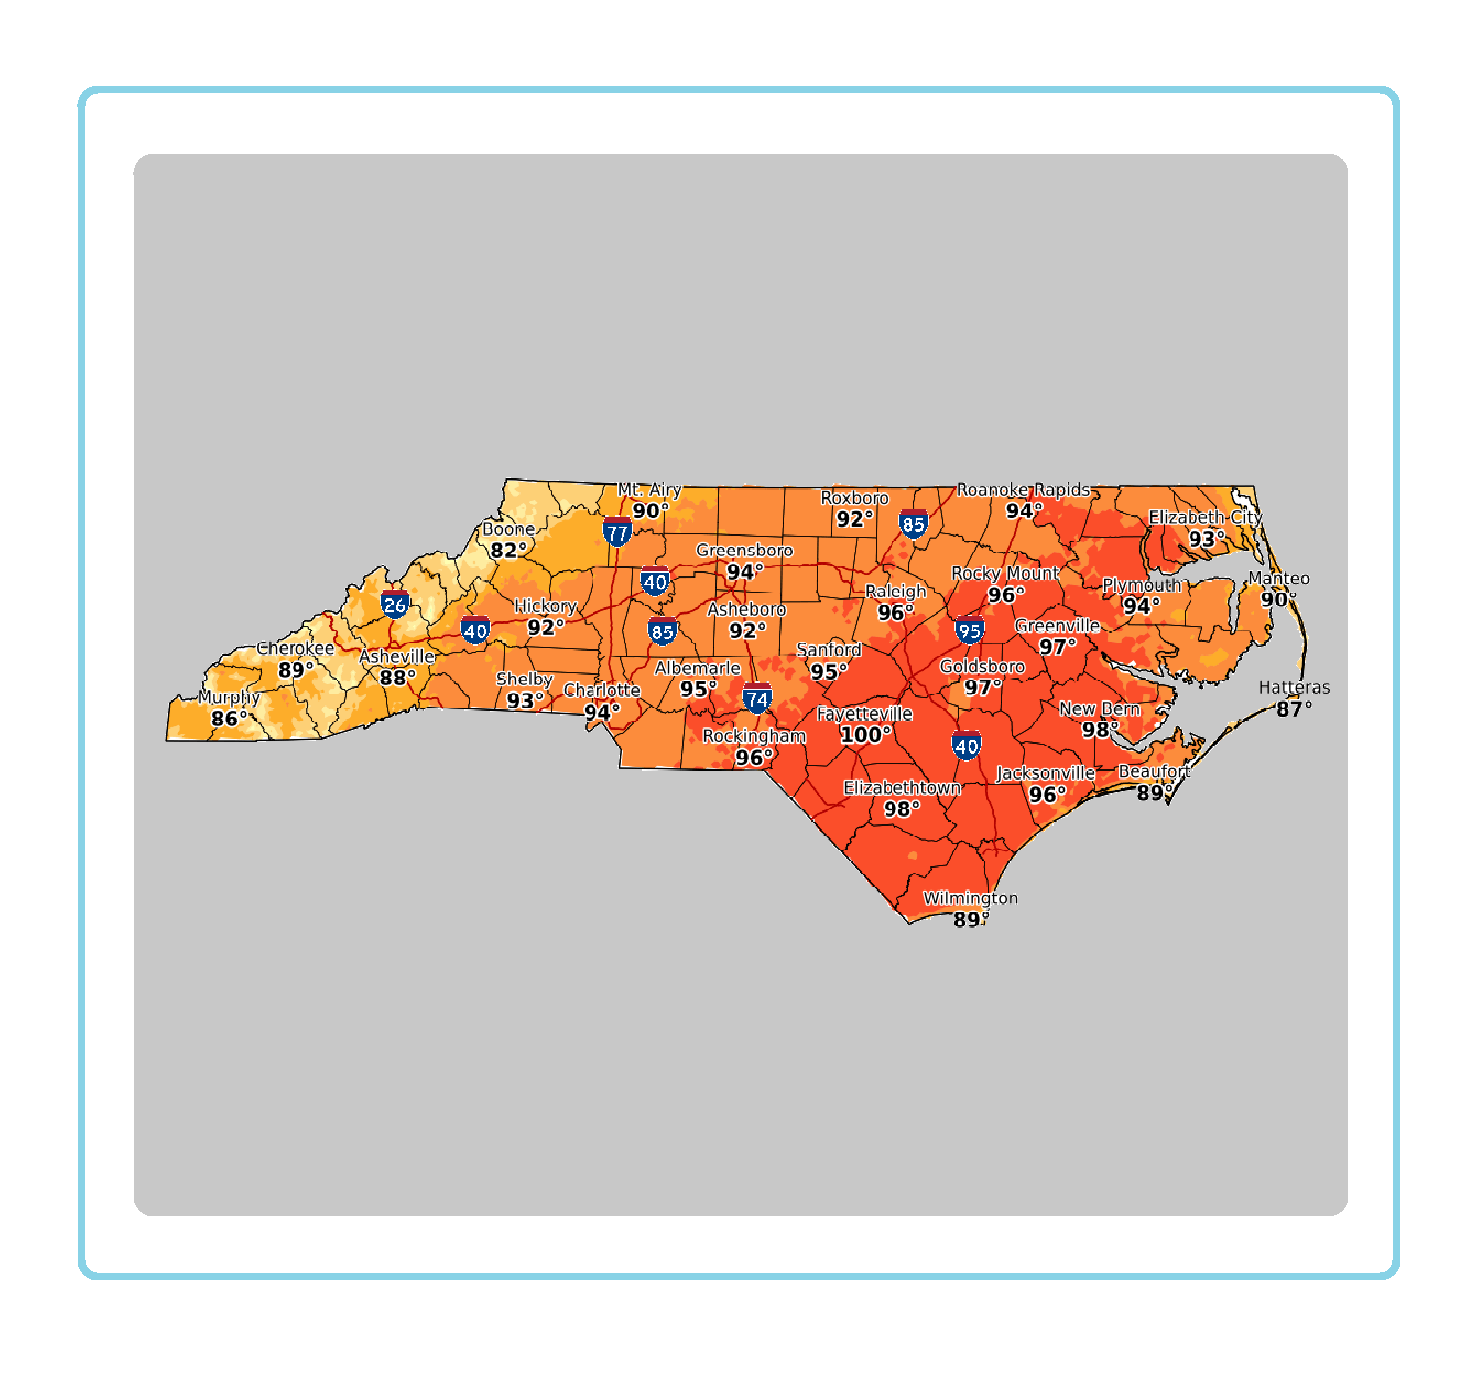 Statewide Maps
 Forecaster Discussion