|
JANUARY
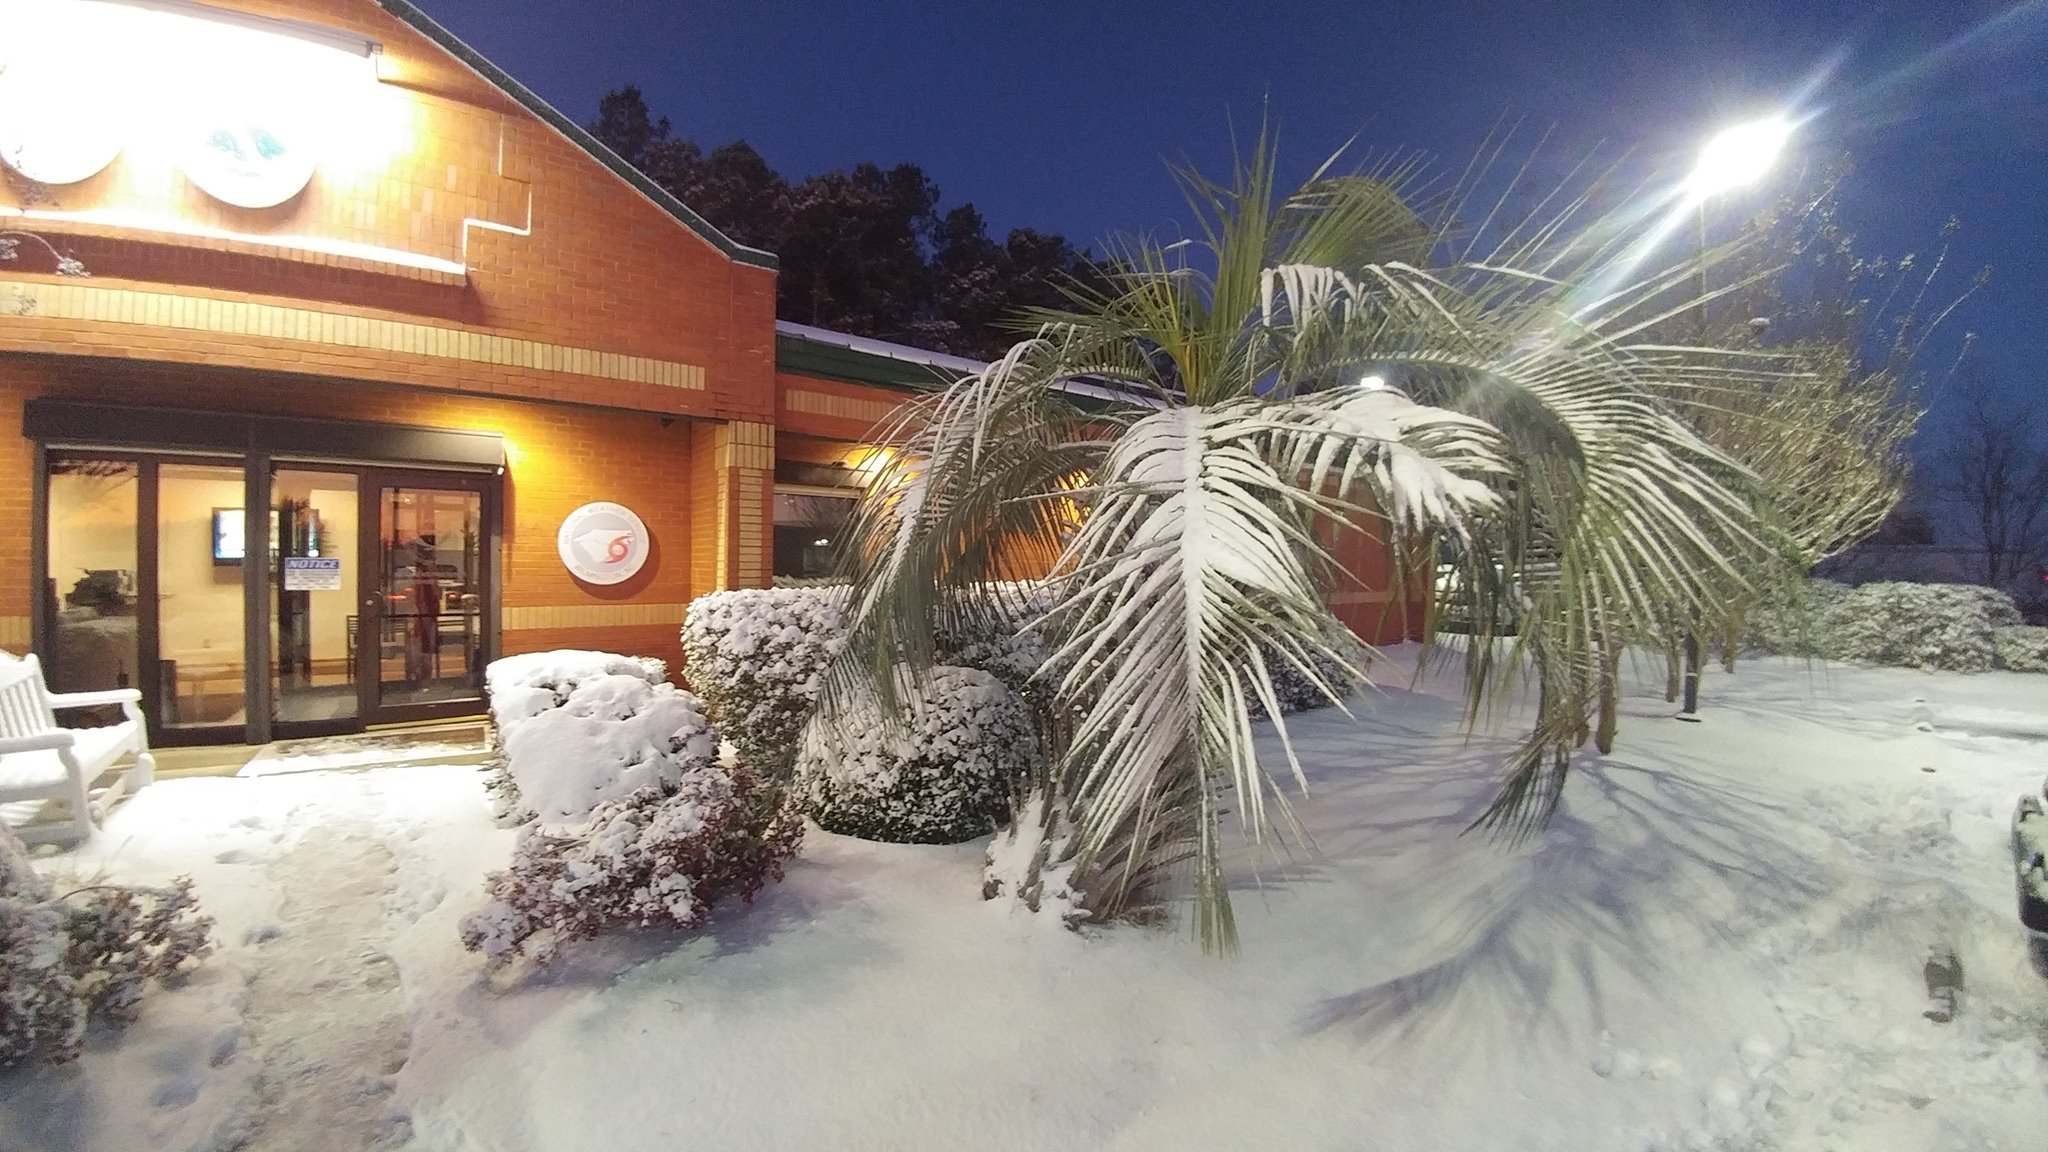 3.8 inches of snow fell in Wilmington during the Jan 3-4 storm |
2018 began with one of the longest stretches of arctic cold in local history. The seven day period beginning January 1 was the third coldest ever recorded in Wilmington, exceeded only by cold waves in February 1899 and January 1918. This same period was the all-time coldest on record for Florence and Myrtle Beach. Temperatures dipped to as cold as 6 degrees in Dillon, SC and Surf City, NC; and 8 degrees in Florence, SC. The 11 degree temperature recorded on January 6th in Wilmington was the coldest in almost 22 years. As if the cold weather wasn't enough, a storm system moving northward just offshore on January 3 dropped up to five inches of snow with up to a quarter inch of freezing rain accumulating in the Myrtle Beach/Grand Strand area. The extended period of frigid temperatures kept measurable snow on the ground in Wilmington for five days, the third longest period of snow on the ground in local history. Lake Waccamaw in Columbus County, NC froze over for the first time since the historic snowstorm and cold outbreak at Christmas 1989. More information on this exceptional period of cold and snow is at https://www.weather.gov/ilm/Jan2018snow.
Arctic air finally left the area on January 9th, and by the 11th temperatures had warmed back into the 70s along with much higher humidity. Along with this change in airmass came thunderstorms; one cluster of severe thunderstorms produced strong winds near Pembroke, NC (Robeson County) during the evening of January 12th, damaging two mobile homes, an outbuilding, and one vehicle. Later that same evening a weather buoy off Cape Fear, NC reported a wind gust to 62 mph during severe thunderstorms.
Winter wasn't quite done with the area: a cold front brought a mix of rain and snow to the area on January 17th. Across our portion of the Carolinas only trace amounts of snow fell, but 6 to 10 inches of snow fell across the northeastern portions of North Carolina.
FEBRUARY
|
|
In astounding opposition to January's cold, temperatures in February were extremely warm relative to normal. Florence had its warmest February on record, and in Wilmington the month's average temperature of 57.5 degrees was the third warmest ever recorded, exceeded only by slightly warmer Februarys in 1890 and 1927. The Southeast Regional Climate Center reported "...the Southeast region observed its warmest Februrary since records began in 1895." Locally, temperatures ran 9 to 10 degrees above normal for the month. Florence racked up eight days this month with highs in the 80s while Wilmington had four days 80 degrees or warmer, the most ever recorded in the month of February in either city.
Rainfall amounts during February were generally light, and the month's precipitation totals ran well below normal. The most substantial rain occurred on February 4th when about one-half inch of rain fell across the area. The winter of 2017-2018 saw weak La Nina conditions occurring in the Pacific Ocean, a pattern that typically favors somewhat drier weather across the Southeastern United States.
The warmest temperatures of the month occurred between the 20th and 25th. Very warm daytime temperatures were supplemented by overnight lows in the 50s and 60s, some 20 to 25 degrees above normal. This triggered an early spring bloom of many trees and bushes.
MARCH
March came in with a bang as strong winds accompanied a line of showers, producing damage to trees and power lines from Florence and the Pee Dee region all the way into Whiteville, NC. Virtually no lightning occurred with these showers even though they were certainly convective in nature. These "severe shower" events are most common during the winter and early spring across the Carolinas and occur when wind shear is very strong but instability is limited. Severe weather of a different sort, large hail, developed on March 21st in the Grand Strand area. A cluster of thunderstorms moving northeastward near the coast intensified as it reached Socastee and dropped golf ball size hail during the evening. Hailstones up to 1 inch in diameter were also reported from Myrtle Beach, North Myrtle Beach and Longs.
There were very few warm days in March. Unlike in February there were only a handful of 80 degree days in Florence and none in Lumberton, Wilmington or Myrtle Beach. Monthly average temperatures across the area ran 4 to 6 degrees below normal. Coupled with the exceptionally warm February, this led to March actually running colder than February. In Wilmington the temperature difference between March and February was -6.1 degrees, and in Florence the difference was -5.8 degrees, the largest February-to-March monthly temperature falls ever recorded in each city's weather history.
A shot of chilly Canadian air brought the coldest temperatures of the month on March 14th and 15th. The morning of the 15th saw low temperatures in the mid 20s even down to the North Carolina beaches. This was the last freeze of the spring for most South Carolina areas and signaled the start of the growing season in Florence and North Myrtle Beach. Another chilly airmass on March 24th brought the final spring freeze in Wilmington.
APRIL
Temperatures continued to run several degrees below normal in April, although there were two periods (April 2-3 and 18-19) where high temperatures rose into the 80s. Nighttime low temperatures were particularly on the cool side: this March and April had the largest number of nights 40 degrees or colder recorded since 1971 in Wilmington. On April 15th a squall line of severe thunderstorms developed across the eastern Carolinas, knocking down numerous trees and power lines. Damage was most concentrated near Blenheim in Marlboro County, SC where law enforcement reported multiple trees down on area roads. Damage extended down into Williamsburg and Georgetown counties, and also across the state line into Bladen County, NC where trees were damaged near Tolarsville.
The final freeze of the year in Lumberton occurred surprisingly late, April 17th. Temperatures in most other locations remained in the mid 30s to around 40. This was over two weeks later than the typical last spring freeze in Lumberton and was the latest spring freeze recorded there since 2005.
MAY
| May Rainfall Records in Wilmington |
| #1 14.36" in 2018 |
| #2 9.12" in 1956 |
| #3 8.68" in 1963 |
| #4 8.63" in 1873 |
| #5 8.58" in 1885 |
May began rather dry. In Florence there was actually a 12-day stretch with no measurable rainfall at all from April 28th through May 9th, the longest dry stretch of the year. Bermuda high pressure offshore brought the first 90-degree temperatures of the year to the area May 10th and 11th. A plume of tropical moisture during the middle of May produced persistent heavy rainfall which led to flooding across the Cape Fear region. On May 19th, flood waters rose 12 to 18 inches deep along Putnam Road and other roads near Ogden Park in Wilmington. Flooding was also reported along South College Road near Oleander Drive, and on Darlington Avenue. In Brunswick County, Funston Road near Silver Lake was inundated by flooding. Rainfall totals for May 19th at the Wilmington airport exceeded 5.5 inches, with numerous reports from volunteer CoCoRaHS observers of 3 to 5 inches across the city.
Subtropical Storm Alberto made landfall along the Florida Gulf Coast during the afternoon of May 28th, spreading a plume of tropical moisture and heavy rain across the Carolinas. Flooding reports were particularly widespread across Horry and Columbus counties from Little River to Garden City, and from Tabor City to Chadbourn. Volunteer rainfall observations included 5.18 inches at Debordieu Plantation near Georgetown, 4.46 inches in Loris, and 3.75 inches in Longs, SC. Heavy rain across the Wilmington metro area was measured at 6.14 inches in Rocky Point, 5.04 inches in Monkey Junction, and 4.55 inches in Bayshore.
These two heavy rainfall events plus more substantial rain on May 5-6 and May 22-24 helped boost the monthly rainfall total at the Wilmington airport to 14.36 inches, breaking the record for the wettest May ever recorded. Southeastern North Carolina's local blueberry farmers suffered impacts from the heavy rain including an inability to drive machinery into the wet fields, and the berries themselves bursting on the bushes.
JUNE
A cluster of strong thunderstorms moved across Wilmington during the afternoon of June 14th. When the storms reached the beaches, a pair of waterspouts developed near the north end of Masonboro Island and moved east out to sea. More strong to severe thunderstorms in the Grand Strand area produced strong winds which knocked trees down in Surfside Beach and damaged a restaurant and a residence in Socastee.
More thunderstorms developed during the afternoon of June 15th, producing large hail in a number of locations across Brunswick and Horry counties. Hail up to the size of quarters was reported from Leland, Socastee, and Garden City. Active weather resumed on June 18th when a cluster of severe thunderstorms across Robeson County, NC blew down trees on Hestertown Road Winds at the Lumberton airport gusted to 59 mph at 4:48 pm. Trees were blown down in the St. Pauls community, and a mobile home was seriously damaged by thunderstorm winds along Alamac Road south of Lumberton shortly after 5 pm.
Although temperatures in June ran three to four degrees above normal, there were very few extremely hot days. Instead, high and low temperatures consistently ran above normal for almost the entire month. The period of June 14th through June 25th was particularly warm, where in Florence each day's temperature reached the mid to upper 90s. June 19th was the hottest day of the year in Florence when the temperature climbed to 98 degrees. Wilmington high on June 17th reached 97, the warmest reading of the year in the Port City.
JULY
Persistent daily thunderstorms dropped heavy rainfall totals across coastal sections of North and South Carolina in July. Wilmington recorded its fourth wettest July in history with an astounding 17.10 inches of rain, nearly 10 inches above normal. This Wilmington total is exceeded only by larger amounts in 1950, 1946, and 1886. Measurable rain fell in Wilmington for 14 consecutive days from July 22 to August 4, the longest streak of rainy days ever recorded in Wilmington's history. Other noteworthy rainfall totals across the area in July include 17.36 inches in Georgetown; 13.01 inches at Brookgreen Gardens, SC; and 12.09 inches at Surf City, NC.
While the summer of 2018 was typically warm and humid, there were no extremely hot temperatures. In fact temperatures never reached 100 degrees at any of our four long-term climate sites (Wilmington, North Myrtle Beach, Florence, or Lumberton) this year. On July 11th and 12th high temperatures in both Florence and Lumberton reached 97 and 98 degrees, respectively. An NWS volunteer observer in Dillon, SC reported a high temperature of 100 degrees on July 12th, the hottest official measurement anywhere across northeastern South Carolina. The consistently hot weather plus onshore winds helped warm the surf water temperature up to 89 degrees at Wrightsville Beach on July 6th. This is the warmest the ocean water has been since the new Johnnie Mercer pier tide and weather gauge was installed in 2004.
A tropical airmass helped produce showers and thunderstorms with locally heavy rain across the area on July 23rd. One of these showers just off the coast of Myrtle Beach, SC developed a fair-weather waterspout, which then moved onshore as a brief tornado. There were no injuries and no damage reported to structures. This 15-yard wide waterspout-turned-tornado is estimated to have produced wind speeds as high as 65 mph, ranking it an EF-0 on the Enhanced Fujita Scale. The funnel dissipated after traveling less than 100 yards inland. Fair-weather waterspouts such as these typically dissipate very quickly after leaving the smooth ocean surface.
|
Tropical Depression #3 developed on July 6 off the North Carolina coast. Shown here on July 7th, the system later became Hurricane Chris with winds up to 105 mph as it moved northeastward along the Gulf Stream and away from land. |
This waterspout came ashore as a weak tornado in Myrtle Beach on July 23rd. Wind speeds are estimated to have reached 65 mph, making this an EF-0 tornado at landfall. |
Stormy weather returned at the end of July. On the 28th a waterspout was sighted approximately eight miles south of Sunset Beach, NC. Thunderstorms that evening across Pender County produced very heavy rain which flooded portions of Penderlea Highway and Shiloh Rd. near Burgaw, and Willard Railroad Rd near Wallace. Flash flooding in Florence, SC early in the morning on July 29th flooded several vehicles and closed a portion of East Palmetto Drive. Heavy rain continued into the morning of July 30th in Carolina Beach where a house on Carolina Beach Drive was inundated with up to two feet of water, with lesser flooding reported from Canal Drive and South Lake Park Drive.
AUGUST
In contrast to July, weather conditions throughout August were much more benign. Although scattered thunderstorms popped up most days, overall rainfall for the month was below normal at all stations. This was particularly true in Florence where August only brought 2.14 inches of rain. Over half of that total, 1.10 inches, came down on August 8th. Although no extreme heat occurred, temperatures ended up around two degrees above normal. In Myrtle Beach the 11-day stretch between August 22nd and September 1st had no measurable rainfall, the longest dry stretch of the entire year. In Lumberton the dry period lasted 19 days from August 23rd through September 10th.
SEPTEMBER
|
Radar loop of Hurricane Florence making landfall along the North Carolina coast on September 14, 2018. |
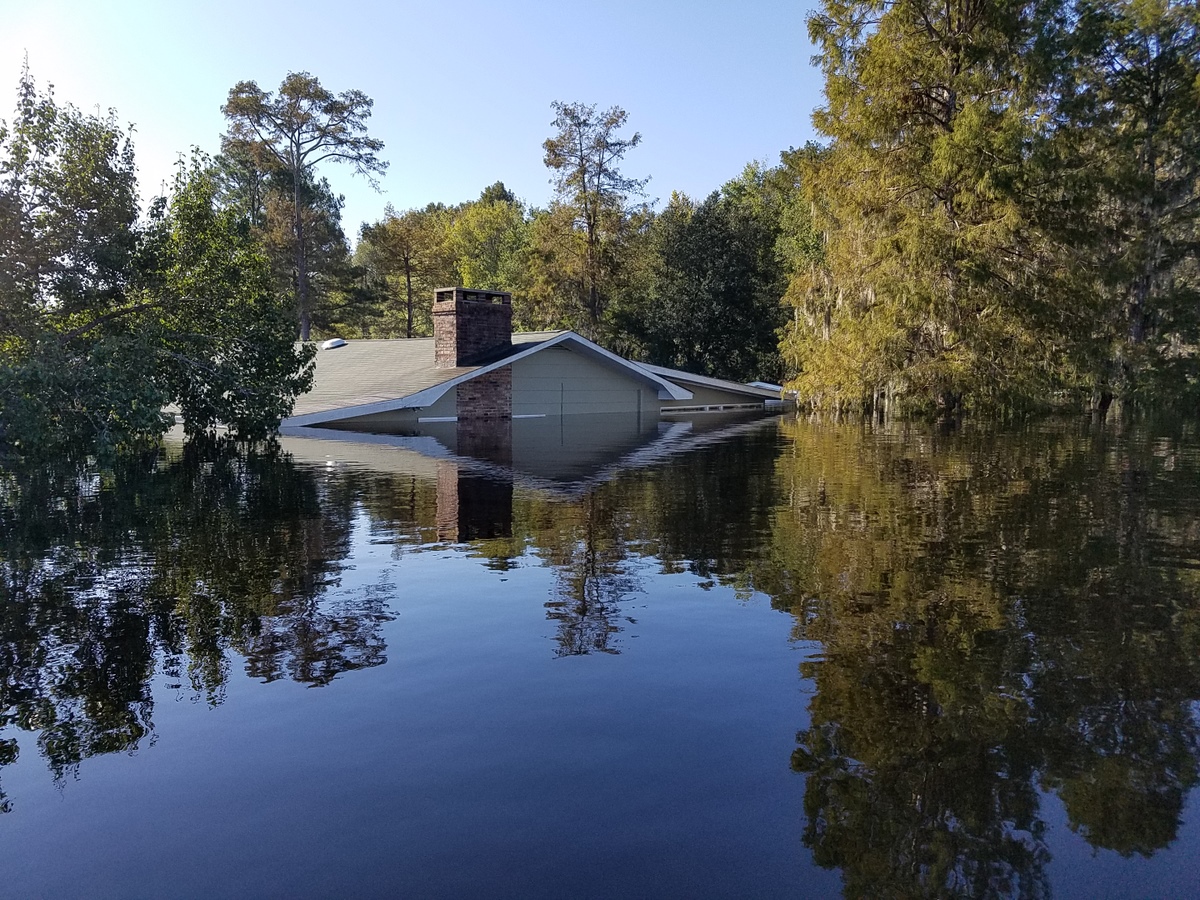
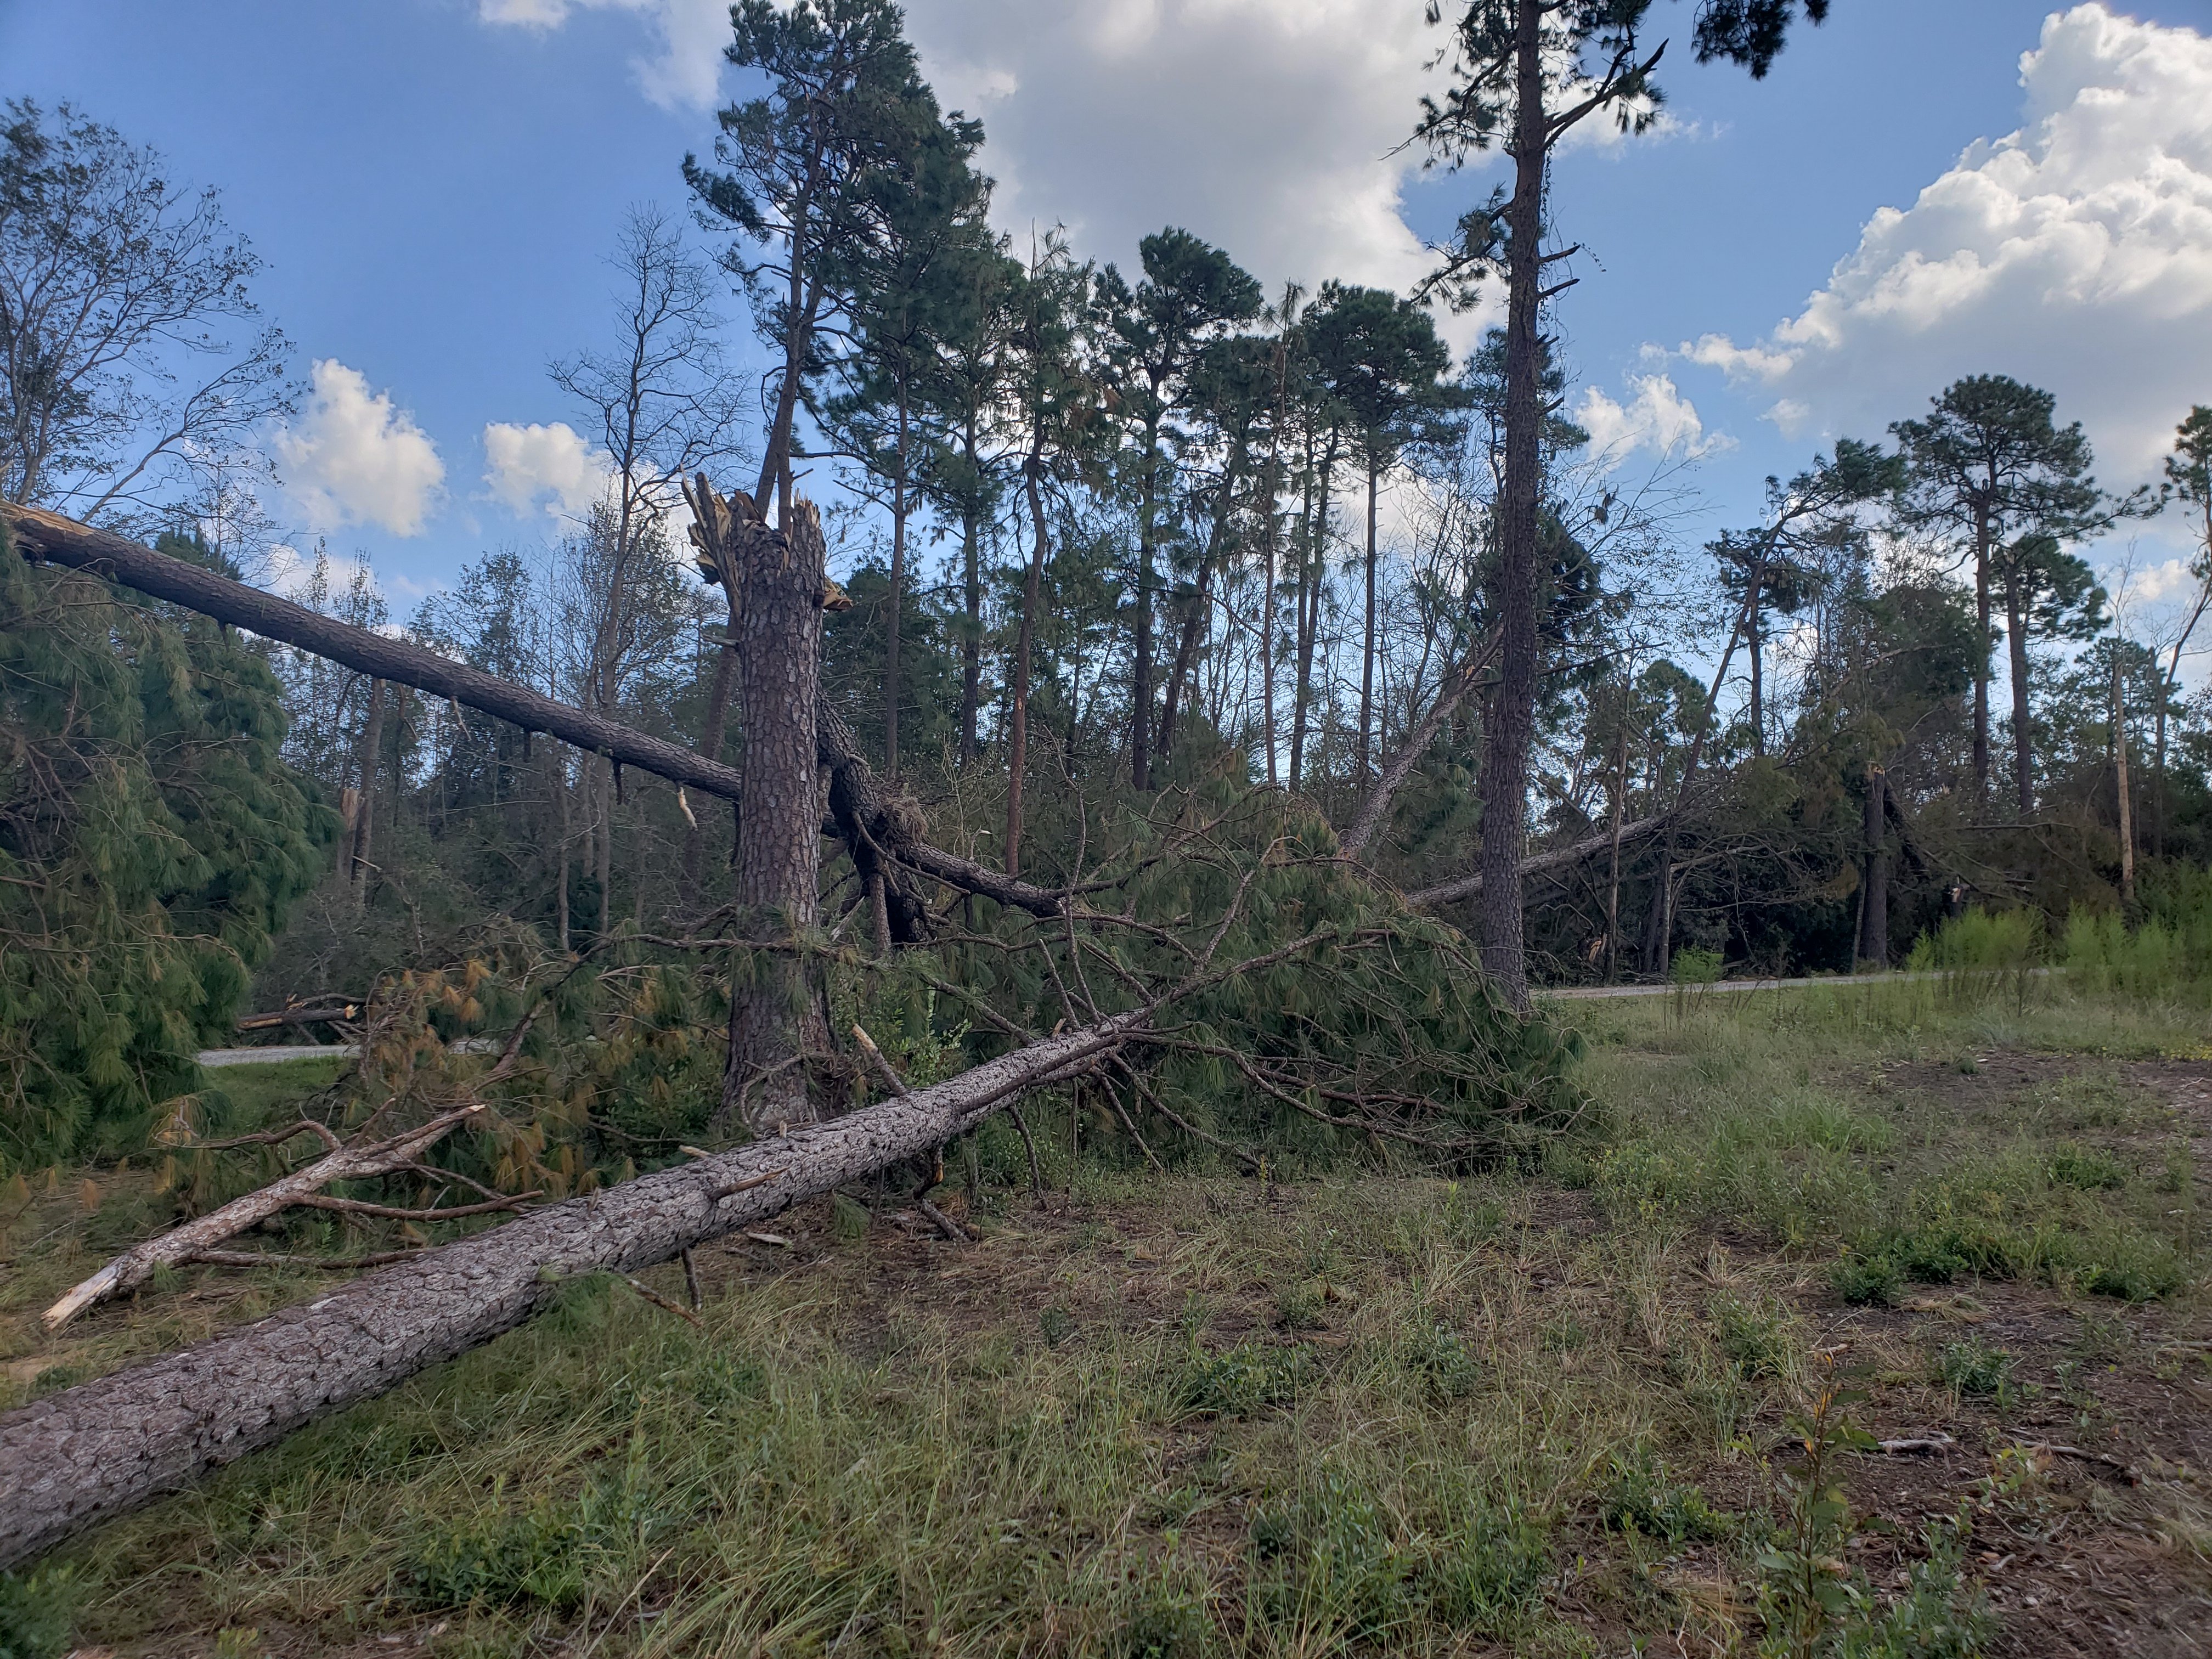
The major weather story for September (and for the entire year) was the deadly flooding and damaging winds produced by Hurricane Florence. Florence made landfall at Wrightsville Beach during the morning of September 14 as a category one hurricane with maximum sustained winds around 90 mph. Wind gusts measured as high as 105 mph at the ILM airport were the strongest winds measured in Wilmington since Hurricane Helene passed by the Cape Fear area in 1958. These powerful winds produced widespread damage to trees, roofs, and electrical power infrastructure across the Cape Fear area. As the center of Florence moved slowly inland on September 15th and 16th, torrential rainfall spread across large sections of eastern North Carolina and portions of northern South Carolina. Flash flooding caused significant property damage and multiple fatalities, followed by long-term river flooding for most of the remainder of September along the Cape Fear, Northeast Cape Fear, Lumber, and Waccamaw Rivers. Florence's flooding damaged many of the same communities that had only recent rebuilt after Hurricane Matthew's devastating floods in 2016 including Lumberton, Fair Bluff, and the many Conway-area neighborhoods near the Waccamaw River. Florence also produced multiple confirmed tornadoes after landfall, many of which affected areas already damaged by strong winds from the core of the storm during landfall.
Rainfall of 20 to 30 inches occurred across wide swaths of the eastern Carolinas, with a few locations reporting totals over 30 inches. In Wilmington 23.02 inches of rain fell at the airport during the storm making Florence the single largest rain event in Wilmington's history, exceeding even Hurricane Floyd's flooding rain back in 1999. According to the NOAA Precipitation Frequency Atlas, this much rain falling in just four days in Wilmington should occur, on average, once every 1,000 years. The all-time annual rainfall record for Wilmington, 83.65 inches set in 1877, was broken during Hurricane Florence, with three and a half months still left in the year.
Detailed information on Hurricane Florence and its exceptional path of destruction across the eastern Carolinas is available at https://www.weather.gov/ilm/HurricaneFlorence
|
Washout on NC Highway 210 at Moore's Creek. Photo credit: Carl Morgan/NWS) |
Severe flooding in Socastee, SC. (Photo credit: Jonathan Lamb/NWS) |
A pair of tornadoes touched down in the Bayshore community in New Hanover County during the evening hours of September 15th (Photo credit: NWS) |
A cold front moving across the Carolinas on September 27th spawned thunderstorms during the evening, one of which became severe in northern Florence County, SC. Trees blown down on power lines knocked out power to 13 homes in Quinby.
As a whole, the month of September had far-above normal temperatures due to the tropical airmass that persisted most of the month. In Wilmington it was the second warmest September on record with an average temperature of 79.2 degrees, only one-tenth of a degree behind September 1921's record of 79.3 degrees.
OCTOBER
On October 10th Hurricane Michael made landfall near the town of Mexico Beach on the Florida Gulf Coast with winds up to 155 mph. This made Michael the strongest hurricane to make a mainland U.S. landfall since 1992's Hurricane Andrew. After landfall, Michael passed across Georgia, then weakened to a tropical storm as it moved through western South and North Carolina on October 11th. Even with the center of the storm remaining well west of our area, winds still gusted to tropical storm force. Local peak wind gusts from Michael included 48 mph in Florence, 49 mph in Lumberton, 51 mph at Myrtle Beach, 54 mph in Wilmington, and 63 mph at Wrightsville Beach. Rainfall amounted to 2 to 3 inches across the Pee Dee region with less near the coast.
Behind Michael, a period of dry weather developed. In Wilmington the 9-day dry stretch between October 17th and October 25th was the longest period without measurable rain the entire year.
NOVEMBER
 |
Strong onshore winds coincided with large tides associated with November's full moon to produce significant coastal flooding during the morning of November 24th. Flooding was worst along the South Carolina coast where road closures and inundated structures were reported from Garden City, Murrells Inlet, Pawleys Island, Myrtle Beach, and North Myrtle Beach. North Myrtle Beach Fire and Rescue reported significant flooding on Highway 17, Ocean Blvd, and numerous side streets. The Pawleys Island Police Department reported many sections of Myrtle Avenue were flooded and advised residents to avoid that road or else risk becoming stranded. WPDE relayed a report that homes on Inland Drive had several inches of water enter their homes. Even in Georgetown high water rose to cover portions of Front Street, although the road itself remained open.
The tide gauge in Myrtle Beach reached an astounding 8.71 feet MLLW. This is the fourth highest tide ever measured at this location, exceeded only by Hurricanes Hugo (1989) and Matthew (2016) and a major winter storm in January 1987. Farther down the coast in Charleston, water rose to 8.76 feet MLLW at the Charleston Harbor tide gauge, the sixth highest reading recorded there since measurements began in the 1930s. Flooding also expanded up the Cape Fear River affecting downtown Wilmignton, the Battleship area, and neighborhoods along River Road.
Temperatures in November ran 1 to 2 degrees below normal as there were several outbreaks of cool, dry Canadian air during the month. The first freeze of the fall occurred in Wilmington and Lumberton on November 23rd, and in Florence and Myrtle Beach on November 28th. This year's growing season was 243 days long in Wilmington and 257 days long in Florence.
DECEMBER
As the year drew to an end, water temperatures in the tropical east Pacific warmed and the climate system was approaching El Nino levels. Several heavy rain events in December drew upon moisture lifted out of the Pacific Ocean and transported to the Carolinas by a strong subtropical jet stream, a hallmark of a developing El Nino pattern. After a series of significant rainfall events in November and December, Wilmington officially reached 100 inches of rain for the year during the morning of Saturday, December 15th. Our meteorologists first began to discuss the potential the city could reach this unprecedented rainfall total after breaking the previous annual record in September. Wilmington has such a long record of continuous rainfall records (stretching back to 1871) it was statistically unlikely that the annual record would be broken by such a shockingly large margin.
|
|
Strong low pressure moved across the Carolinas on December 21st bringing wind gusts of 40 to 50 mph and several inches of rain. Showers and strong thunderstorms that evening prompted the issuance of special marine warnings for offshore mariners. One of these showers spun up a brief tornado as it moved ashore in the Oxford Place neighborhood of Wilmington at 5:10 pm. Based on observed damage, our storm survey team determined the tornado had winds of 85 mph and was on the ground for about one-third of a mile. Numerous trees and fences were knocked down damaging a vehicle, a large wooden shed, and a small boat.
The year ended with unseasonable warmth; each day from December 27 through the 31st had highs in the 60s or 70s.
City Climate Summaries for 2018

WILMINGTON NC
Avg Hi/Dep Avg Lo/Dep Avg T/Dep Warmest Coolest Precip/Dep
JAN 52.6/-3.8 30.3/-5.3 41.5/-4.5 72/23rd 11/6th 6.82/+3.06
FEB 69.0/+9.1 46.1/+8.2 57.5/+8.6 82/25th 25/3rd 1.83/-1.79
MAR 62.3/-4.1 40.1/-3.7 51.2/-3.9 79/28th 26/15th 3.25/-0.96
APR 72.0/-2.2 48.9/-2.7 60.5/-2.4 85/19th 37/8th 5.37/+2.55
MAY 82.9/+2.2 66.7/+6.7 74.8/+4.4 90/12th 53/1st 14.36/+9.87(R)
JUN 89.8/+2.9 71.8/+3.1 80.8/+3.0 97/19th 64/6th 8.41/+3.23
JUL 87.4/-2.3 71.6/-1.0 79.5/-1.6 96/12th 61/10th 17.10/+9.62
AUG 90.1/+2.0 73.5/+2.2 81.8/+2.1 95/8th 62/24th 5.43/-1.98
SEP 86.5/+2.8 72.0/+6.4 79.2/+4.6 91/28th 64/22nd 24.13/+16.29(R)
OCT 77.7/+2.0 58.1/+3.5 67.9/+2.7 93/5th 38/22nd 2.50/-1.39
NOV 65.9/-2.1 46.1/+0.7 56.0/-0.7 82/6th 27/29th 6.12/+2.83
DEC 59.9/+0.6 42.1/+4.3 51.0/+2.4 72/3rd 28/6th 7.08/+3.46
---------------------------------------------------------------------
ANN 74.7/+0.6 55.6/+1.8 65.1/+1.1 97 11 102.40/+44.79
Number of days with Temperatures...
90 degrees of higher: 52 (12 more than normal)
32 degrees or lower: 38 (3 more than normal)
Heating degree days: 2371 (41 fewer than normal)
Cooling degree days: 2517 (473 more than normal)
Number of days with precipitation...
0.01" or greater: 144 (9 more than normal)
0.10" or greater: 103 (25 more than normal)
0.50" or greater: 45 (10 more than normal)
1.00" or greater: 28 (11 more than normal)
Thunderstorms occurred on 64 days.
Snow or sleet fell on 4 days.
Measurable snow or sleet: 3.8 inches.
Average wind speed: 7.9 MPH
Maximum 2-minute wind speed: 66 mph on September 14th (Hurricane Florence)
Maximum 5-second wind gust: 105 mph on September 14th (Hurricane Florence)
 FLORENCE SC
Avg Hi/Dep Avg Lo/Dep Avg T/Dep Warmest Coolest Precip/Dep
JAN 53.4/-1.9 29.2/-5.4 41.3/-3.6 77/11th 8/7th 2.17/-1.06
FEB 69.4/+9.8 47.4/+9.9 58.4/+9.9 83/25th 26/3rd 0.87/-2.05
MAR 63.7/-3.9 41.6/-2.0 52.6/-3.0 81/29th 26/15th 2.90/-0.43
APR 74.5/-1.3 48.5/-2.2 61.5/-1.8 87/18th 35/17th 5.90/+3.28
MAY 86.3/+3.6 65.5/+6.1 75.9/+4.8 95/13th 48/1st 4.19/+0.93
JUN 91.9/+3.5 72.0/+4.0 81.9/+3.7 98/19th 63/6th 6.61/+1.99
JUL 91.6/+0.6 72.0/+0.6 81.8/+0.6 98/12th 64/10th 7.09/+1.83
AUG 91.6/+2.2 72.1/+1.6 81.9/+2.0 96/31st 61/24th 2.14/-3.10
SEP 90.4/+6.2 71.8/+7.5 81.1/+6.9 97/2nd 66/30th 10.44/+6.77
OCT 77.7/+2.2 57.4/+4.3 67.5/+3.2 93/5th 38/22nd 4.87/+1.79
NOV 62.8/-4.3 44.3/+0.6 53.5/-1.9 82/6th 26/29th 4.34/+1.67
DEC 59.8/+2.0 41.4/+4.9 50.6/+3.5 76/28th 26/6th 6.61/+3.60
---------------------------------------------------------------------
ANN 76.1/+1.5 55.3/+2.5 65.7/+2.0 98 8 58.13/+15.22
Number of days with Temperatures...
90 degrees of higher: 100 (44 more than normal)
32 degrees or lower: 37 (3 fewer than normal)
Heating degree days: 2389 (135 fewer than normal)
Cooling degree days: 2733 (671 more than normal)
Number of days with precipitation...
0.01" or greater: 120 (14 more than normal)
0.10" or greater: 80 (10 more than normal)
0.50" or greater: 39 (10 more than normal)
1.00" or greater: 20 (8 more than normal)
Thunderstorms occurred on 53 days.
Snow or sleet fell on 3 days.
Average wind speed: 7.0 MPH
Maximum 2-minute wind speed: 45 mph on September 14th (Hurricane Florence)
Maximum 5-second wind gust: 59 mph on September 14th (Hurricane Florence)
FLORENCE SC
Avg Hi/Dep Avg Lo/Dep Avg T/Dep Warmest Coolest Precip/Dep
JAN 53.4/-1.9 29.2/-5.4 41.3/-3.6 77/11th 8/7th 2.17/-1.06
FEB 69.4/+9.8 47.4/+9.9 58.4/+9.9 83/25th 26/3rd 0.87/-2.05
MAR 63.7/-3.9 41.6/-2.0 52.6/-3.0 81/29th 26/15th 2.90/-0.43
APR 74.5/-1.3 48.5/-2.2 61.5/-1.8 87/18th 35/17th 5.90/+3.28
MAY 86.3/+3.6 65.5/+6.1 75.9/+4.8 95/13th 48/1st 4.19/+0.93
JUN 91.9/+3.5 72.0/+4.0 81.9/+3.7 98/19th 63/6th 6.61/+1.99
JUL 91.6/+0.6 72.0/+0.6 81.8/+0.6 98/12th 64/10th 7.09/+1.83
AUG 91.6/+2.2 72.1/+1.6 81.9/+2.0 96/31st 61/24th 2.14/-3.10
SEP 90.4/+6.2 71.8/+7.5 81.1/+6.9 97/2nd 66/30th 10.44/+6.77
OCT 77.7/+2.2 57.4/+4.3 67.5/+3.2 93/5th 38/22nd 4.87/+1.79
NOV 62.8/-4.3 44.3/+0.6 53.5/-1.9 82/6th 26/29th 4.34/+1.67
DEC 59.8/+2.0 41.4/+4.9 50.6/+3.5 76/28th 26/6th 6.61/+3.60
---------------------------------------------------------------------
ANN 76.1/+1.5 55.3/+2.5 65.7/+2.0 98 8 58.13/+15.22
Number of days with Temperatures...
90 degrees of higher: 100 (44 more than normal)
32 degrees or lower: 37 (3 fewer than normal)
Heating degree days: 2389 (135 fewer than normal)
Cooling degree days: 2733 (671 more than normal)
Number of days with precipitation...
0.01" or greater: 120 (14 more than normal)
0.10" or greater: 80 (10 more than normal)
0.50" or greater: 39 (10 more than normal)
1.00" or greater: 20 (8 more than normal)
Thunderstorms occurred on 53 days.
Snow or sleet fell on 3 days.
Average wind speed: 7.0 MPH
Maximum 2-minute wind speed: 45 mph on September 14th (Hurricane Florence)
Maximum 5-second wind gust: 59 mph on September 14th (Hurricane Florence)
 NORTH MYRTLE BEACH SC
Avg Hi/Dep Avg Lo/Dep Avg T/Dep Warmest Coolest Precip/Dep
JAN 52.0/-3.1 32.0/-4.2 42.0/-3.7 70/11th 16/7th 4.22/+0.53
FEB 65.7/+8.3 48.2/+9.6 57.0/+9.0 81/16th 29/3rd 1.49/-1.93
MAR 62.0/-2.1 41.9/-2.4 51.9/-2.3 77/16th 27/15th 2.00/-1.92
APR 69.2/-2.1 50.3/-1.6 59.8/-1.8 84/19th 38/17th 5.07/+2.11
MAY 79.5/+0.9 67.2/+6.4 73.3/+3.6 88/11th 50/1st 5.64/+2.23
JUN 86.6/+2.1 72.8/+3.5 79.7/+2.8 92/19th 63/6th 5.19/+0.55
JUL 86.5/-1.1 72.4/-0.7 79.4/-0.9 91/11th 60/10th 11.07/+5.17(R)
AUG 87.0/+0.9 74.4/+2.7 80.7/+1.8 92/8th 67/24th 3.08/-4.33
SEP 86.4/+3.0 73.4/+6.5 79.9/+4.8 90/12th 67/22nd 13.12/+6.84
OCT 77.7/+2.6 60.0/+4.3 68.9/+3.5 91/5th 42/22nd 3.83/-0.05
NOV 64.9/-1.7 47.8/+1.4 56.3/-0.2 78/1st 29/29th 6.37/+3.33
DEC 58.7/+0.2 43.0/+4.0 50.8/+2.0 71/3rd 28/6th 7.42/+3.96
---------------------------------------------------------------------
ANN 73.0/+0.6 57.0/+2.4 65.0/+1.5 92 16 68.50/+16.49
Number of days with Temperatures...
90 degrees of higher: 10 (6 fewer than normal)
32 degrees or lower: 30 (exactly normal)
Heating degree days: 2311 (137 fewer than normal)
Cooling degree days: 2409 (506 more than normal)
Number of days with precipitation...
0.01" or greater: 131
0.10" or greater: 93
0.50" or greater: 45
1.00" or greater: 19
Thunderstorms occurred on 62 days.
Snow or sleet fell on 2 days.
Average wind speed: 8.2 MPH
Maximum 2-minute wind speed: 41 mph on October 11th (Tropical Storm Michael)
Maximum 5-second wind gust: 59 mph on September 14th (Hurricane Florence)
NORTH MYRTLE BEACH SC
Avg Hi/Dep Avg Lo/Dep Avg T/Dep Warmest Coolest Precip/Dep
JAN 52.0/-3.1 32.0/-4.2 42.0/-3.7 70/11th 16/7th 4.22/+0.53
FEB 65.7/+8.3 48.2/+9.6 57.0/+9.0 81/16th 29/3rd 1.49/-1.93
MAR 62.0/-2.1 41.9/-2.4 51.9/-2.3 77/16th 27/15th 2.00/-1.92
APR 69.2/-2.1 50.3/-1.6 59.8/-1.8 84/19th 38/17th 5.07/+2.11
MAY 79.5/+0.9 67.2/+6.4 73.3/+3.6 88/11th 50/1st 5.64/+2.23
JUN 86.6/+2.1 72.8/+3.5 79.7/+2.8 92/19th 63/6th 5.19/+0.55
JUL 86.5/-1.1 72.4/-0.7 79.4/-0.9 91/11th 60/10th 11.07/+5.17(R)
AUG 87.0/+0.9 74.4/+2.7 80.7/+1.8 92/8th 67/24th 3.08/-4.33
SEP 86.4/+3.0 73.4/+6.5 79.9/+4.8 90/12th 67/22nd 13.12/+6.84
OCT 77.7/+2.6 60.0/+4.3 68.9/+3.5 91/5th 42/22nd 3.83/-0.05
NOV 64.9/-1.7 47.8/+1.4 56.3/-0.2 78/1st 29/29th 6.37/+3.33
DEC 58.7/+0.2 43.0/+4.0 50.8/+2.0 71/3rd 28/6th 7.42/+3.96
---------------------------------------------------------------------
ANN 73.0/+0.6 57.0/+2.4 65.0/+1.5 92 16 68.50/+16.49
Number of days with Temperatures...
90 degrees of higher: 10 (6 fewer than normal)
32 degrees or lower: 30 (exactly normal)
Heating degree days: 2311 (137 fewer than normal)
Cooling degree days: 2409 (506 more than normal)
Number of days with precipitation...
0.01" or greater: 131
0.10" or greater: 93
0.50" or greater: 45
1.00" or greater: 19
Thunderstorms occurred on 62 days.
Snow or sleet fell on 2 days.
Average wind speed: 8.2 MPH
Maximum 2-minute wind speed: 41 mph on October 11th (Tropical Storm Michael)
Maximum 5-second wind gust: 59 mph on September 14th (Hurricane Florence)
 LUMBERTON NC
Avg Hi/Dep Avg Lo/Dep Avg T/Dep Warmest Coolest Precip/Dep
JAN 51.8/-1.9 27.3/-5.9 39.5/-3.9 75/11th 6/5th 1.90/-1.07
FEB 68.0/+10.0 45.4/+9.8 56.7/+9.9 83/25th 24/3rd 1.11/-1.79
MAR 61.2/-5.1 38.7/-3.3 50.0/-4.1 79/29th 23/15th 2.32/-1.01
APR 72.6/-1.9 45.8/-3.2 59.2/-2.5 85/3rd 32/17th 3.50/+2.82
MAY 86.4/+4.3 64.2/+6.6 75.3/+5.5 96/13th 45/1st 2.58/-0.47
JUN 91.7/+3.2 70.4/+3.0 81.0/+3.0 98/24th 59/6th 7.14/+2.80
JUL 90.7/-0.3 71.1/-0.2 80.9/-0.2 98/11th 59/10th 2.50/-2.98
AUG 90.3/+2.0 70.6/+0.9 80.5/+1.5 97/31st 62/26th 4.69/-0.81
SEP 90.6/+6.9 69.7/+7.4 80.3/+7.3 95/7th 63/30th 19.00/+14.20(R)
OCT 77.6/+2.1 56.4/+5.1 67.0/+3.6 94/5th 36/22nd 2.54/-0.03
NOV 63.0/-4.2 44.2/+2.8 53.6/-0.7 83/6th 25/29th 4.82/+1.95
DEC 58.9/+2.1 41.1/+5.5 50.0/+3.8 76/28th 27/6th 6.08/+3.19
---------------------------------------------------------------------
ANN 75.2/+1.3 53.8/+2.4 64.5/+1.9 98 6 58.18/+14.66
Number of days with Temperatures...
90 degrees of higher: 95 (44 more than normal)
32 degrees or lower: 47 (2 fewer than normal)
Heating degree days: 2634 (127 fewer than normal)
Cooling degree days: 2524 (614 more than normal)
Number of days with precipitation...
0.01" or greater: 126 (16 more than normal)
0.10" or greater: 82 (7 more than normal)
0.50" or greater: 33 (2 more than normal)
1.00" or greater: 13 (exactly normal)
Thunderstorms occurred on 69 days.
Snow or sleet fell on 4 days.
Average wind speed: 6.2 MPH
Maximum 2-minute wind speed: 44 mph on August 2nd (severe thunderstorm)
Maximum 5-second wind gust: 69 mph on September 14th (Hurricane Florence)
LUMBERTON NC
Avg Hi/Dep Avg Lo/Dep Avg T/Dep Warmest Coolest Precip/Dep
JAN 51.8/-1.9 27.3/-5.9 39.5/-3.9 75/11th 6/5th 1.90/-1.07
FEB 68.0/+10.0 45.4/+9.8 56.7/+9.9 83/25th 24/3rd 1.11/-1.79
MAR 61.2/-5.1 38.7/-3.3 50.0/-4.1 79/29th 23/15th 2.32/-1.01
APR 72.6/-1.9 45.8/-3.2 59.2/-2.5 85/3rd 32/17th 3.50/+2.82
MAY 86.4/+4.3 64.2/+6.6 75.3/+5.5 96/13th 45/1st 2.58/-0.47
JUN 91.7/+3.2 70.4/+3.0 81.0/+3.0 98/24th 59/6th 7.14/+2.80
JUL 90.7/-0.3 71.1/-0.2 80.9/-0.2 98/11th 59/10th 2.50/-2.98
AUG 90.3/+2.0 70.6/+0.9 80.5/+1.5 97/31st 62/26th 4.69/-0.81
SEP 90.6/+6.9 69.7/+7.4 80.3/+7.3 95/7th 63/30th 19.00/+14.20(R)
OCT 77.6/+2.1 56.4/+5.1 67.0/+3.6 94/5th 36/22nd 2.54/-0.03
NOV 63.0/-4.2 44.2/+2.8 53.6/-0.7 83/6th 25/29th 4.82/+1.95
DEC 58.9/+2.1 41.1/+5.5 50.0/+3.8 76/28th 27/6th 6.08/+3.19
---------------------------------------------------------------------
ANN 75.2/+1.3 53.8/+2.4 64.5/+1.9 98 6 58.18/+14.66
Number of days with Temperatures...
90 degrees of higher: 95 (44 more than normal)
32 degrees or lower: 47 (2 fewer than normal)
Heating degree days: 2634 (127 fewer than normal)
Cooling degree days: 2524 (614 more than normal)
Number of days with precipitation...
0.01" or greater: 126 (16 more than normal)
0.10" or greater: 82 (7 more than normal)
0.50" or greater: 33 (2 more than normal)
1.00" or greater: 13 (exactly normal)
Thunderstorms occurred on 69 days.
Snow or sleet fell on 4 days.
Average wind speed: 6.2 MPH
Maximum 2-minute wind speed: 44 mph on August 2nd (severe thunderstorm)
Maximum 5-second wind gust: 69 mph on September 14th (Hurricane Florence)
2018 Annual Rainfall Map estimated from Doppler radar data

Research and Page Author: Tim Armstrong
Page Created: January 1, 2019
Last Updated: January 1, 2019


.jpg)

 Coastal Flood