 |
|
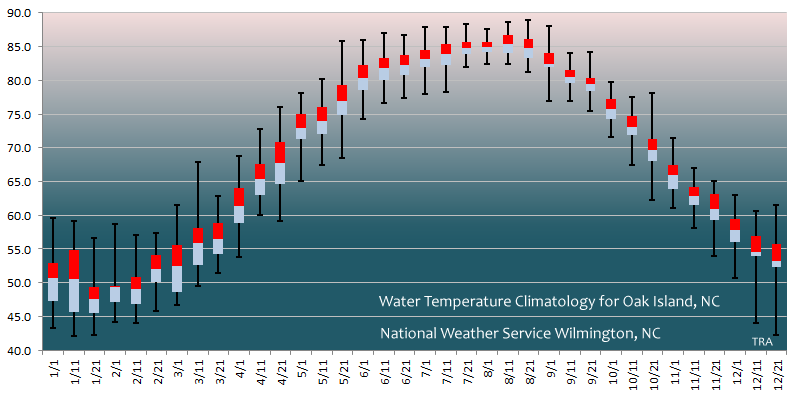
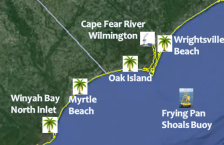
Oak Island is a barrier island along the coast of Brunswick County, NC. Stretching almost 13 miles from the mouth of the Cape Fear River to Lockwoods Folly Inlet, Oak Island is one of the few south-facing beaches in North Carolina. From late May through September water temperatures are practically tropical making this area perfect for swimming and beach activities. The water cools significantly during the winter months due to cold offshore winds and longer nights. Water temperatures here tend to be both hotter during the summer and cooler during the winter than at Wrightsville Beach, likely due to shallower water depth atop the broad continental shelf. The other beaches of Brunswick County have very similar water temperatures including Bald Head Island, Caswell Beach, Long Beach, Holden Beach, Ocean Isle Beach, Sunset Beach, and Bird Island.
Average Water Temperartures for Oak Island, NC
|
January |
February |
March |
April |
May |
June |
||||||||||||
|
1-10 |
11-20 |
21-31 |
1-10 |
11-20 |
21-29 |
1-10 |
11-20 |
21-31 |
1-10 |
11-20 |
21-30 |
1-10 |
11-20 |
21-31 |
1-10 |
11-20 |
21-30 |
|
51 |
51 |
48 |
49 |
49 |
52 |
52 |
56 |
57 |
61 |
65 |
68 |
73 |
74 |
77 |
80 |
82 |
82 |
|
July |
August |
September |
October |
November |
December |
||||||||||||
|
1-10 |
11-20 |
21-31 |
1-10 |
11-20 |
21-31 |
1-10 |
11-20 |
21-30 |
1-10 |
11-20 |
21-31 |
1-10 |
11-20 |
21-30 |
1-10 |
11-20 |
21-31 |
|
83 |
84 |
85 |
85 |
85 |
85 |
82 |
81 |
79 |
76 |
73 |
70 |
66 |
63 |
61 |
58 |
54 |
53 |
Average values are given for early (1st-10th), mid (11th-20th), and late (21st-31st) each month.
Detailed Water Temperature Statistics for Oak Island, NC
Box and Whisker statistical plot. Colored boxes indicate the 25th through 75th percentiles, with the red/blue center of each box indicating the mean (average) value. The black whiskers indicate the highest and lowest temperatures ever observed during each roughly 10 day time period throughout the year.
Statistical table of water temperature data. In addition to mean, highest and lowest values for each time period, various percentiles are displayed. Sigma (σ, standard deviation) values help define the distribution of the data.
|
|
January |
February |
March |
April |
May |
June |
|||||||||||||
|
|
1-10 |
11-20 |
21-31 |
1-10 |
11-20 |
21-29 |
1-10 |
11-20 |
21-31 |
1-10 |
11-20 |
21-30 |
1-10 |
11-20 |
21-31 |
1-10 |
11-20 |
21-30 |
|
|
Highest |
59.6 |
59.2 |
56.7 |
58.6 |
57.1 |
57.3 |
61.5 |
67.9 |
62.8 |
68.8 |
72.8 |
76.1 |
78.1 |
80.2 |
85.8 |
86.0 |
87.1 |
86.7 |
|
|
+2σ |
56.3 |
58.0 |
51.0 |
57.0 |
56.5 |
56.2 |
59.8 |
66.4 |
61.9 |
67.4 |
71.8 |
75.3 |
77.0 |
78.0 |
84.2 |
85.1 |
86.2 |
85.8 |
|
|
Upper 5% |
55.2 |
56.8 |
50.3 |
56.1 |
55.8 |
55.9 |
58.6 |
65.4 |
61.3 |
66.8 |
70.4 |
74.7 |
76.5 |
77.5 |
83.5 |
84.6 |
85.6 |
85.3 |
|
|
Upper 10% |
54.1 |
55.8 |
50.0 |
55.4 |
54.6 |
55.4 |
57.3 |
63.1 |
60.4 |
66.1 |
69.8 |
74.1 |
76.0 |
76.9 |
81.9 |
84.0 |
85.0 |
84.8 |
|
|
+1σ |
53.5 |
55.3 |
49.6 |
54.9 |
53.8 |
55.0 |
56.6 |
60.1 |
59.9 |
65.3 |
68.9 |
73.1 |
75.6 |
76.6 |
81.0 |
83.5 |
84.2 |
84.3 |
|
|
Upper 25% |
53.0 |
54.8 |
49.4 |
49.5 |
50.9 |
54.1 |
55.5 |
58.1 |
58.8 |
64.0 |
67.6 |
70.8 |
74.9 |
76.0 |
79.3 |
82.3 |
83.4 |
83.8 |
|
|
MEAN |
50.7 |
50.6 |
47.5 |
49.3 |
49.1 |
52.0 |
52.5 |
55.8 |
56.5 |
61.3 |
65.3 |
67.8 |
73.0 |
74.0 |
76.9 |
80.3 |
81.8 |
82.3 |
|
|
Lower 25% |
47.3 |
45.7 |
45.6 |
47.1 |
46.9 |
50.2 |
48.6 |
52.6 |
54.3 |
58.9 |
63.0 |
64.6 |
71.3 |
72.1 |
74.8 |
78.6 |
80.0 |
80.8 |
|
|
-1σ |
46.2 |
45.1 |
45.0 |
46.9 |
46.2 |
49.1 |
47.9 |
51.6 |
53.8 |
58.1 |
61.9 |
63.5 |
70.1 |
71.2 |
73.5 |
77.8 |
79.0 |
79.8 |
|
|
Lower 10% |
45.9 |
44.1 |
44.4 |
46.6 |
45.8 |
48.2 |
47.7 |
51.1 |
53.4 |
57.5 |
61.3 |
62.8 |
69.2 |
69.9 |
71.7 |
77.0 |
78.4 |
79.3 |
|
|
Lower 5% |
45.7 |
43.3 |
43.9 |
46.1 |
45.3 |
47.6 |
47.5 |
50.9 |
53.0 |
55.6 |
60.8 |
60.8 |
68.6 |
69.2 |
70.1 |
76.3 |
77.9 |
78.8 |
|
|
-2σ |
45.1 |
42.8 |
43.5 |
45.9 |
45.0 |
47.3 |
47.3 |
50.7 |
52.5 |
55.3 |
60.3 |
60.0 |
67.9 |
68.5 |
69.5 |
75.8 |
77.5 |
78.0 |
|
|
Lowest |
43.3 |
42.1 |
42.3 |
44.2 |
44.0 |
45.8 |
46.7 |
49.6 |
51.4 |
53.8 |
60.1 |
59.2 |
65.1 |
67.5 |
68.6 |
74.3 |
76.7 |
77.3 |
|
|
|
July |
August |
September |
October |
November |
December |
Ann. |
||||||||||||
|
|
1-10 |
11-20 |
21-31 |
1-10 |
11-20 |
21-31 |
1-10 |
11-20 |
21-30 |
1-10 |
11-20 |
21-31 |
1-10 |
11-20 |
21-30 |
1-10 |
11-20 |
21-31 |
|
|
Highest |
88.0 |
87.9 |
88.4 |
87.6 |
88.7 |
88.9 |
88.0 |
84.0 |
84.2 |
79.7 |
77.5 |
78.1 |
71.5 |
67.1 |
65.1 |
63.0 |
60.6 |
61.6 |
88.9 |
|
+2σ |
86.5 |
87.0 |
87.3 |
86.9 |
88.3 |
88.2 |
86.4 |
83.5 |
83.3 |
79.2 |
76.5 |
75.4 |
70.6 |
66.9 |
64.8 |
62.2 |
59.4 |
59.6 |
86.2 |
|
Upper 5% |
86.0 |
86.6 |
86.8 |
86.5 |
88.0 |
87.4 |
85.3 |
82.9 |
82.8 |
79.0 |
76.1 |
74.1 |
70.3 |
66.2 |
64.6 |
61.1 |
58.6 |
58.9 |
85.3 |
|
Upper 10% |
85.5 |
86.2 |
86.5 |
86.3 |
87.4 |
87.1 |
84.9 |
82.4 |
82.2 |
78.4 |
75.7 |
72.9 |
69.3 |
64.9 |
64.2 |
60.4 |
57.9 |
57.9 |
84.1 |
|
+1σ |
85.0 |
85.8 |
86.2 |
86.0 |
87.1 |
86.7 |
84.6 |
82.0 |
81.7 |
77.9 |
75.2 |
72.0 |
68.3 |
64.5 |
63.9 |
60.2 |
57.4 |
56.7 |
82.9 |
|
Upper 25% |
84.4 |
85.4 |
85.6 |
85.6 |
86.7 |
86.1 |
84.1 |
81.5 |
80.3 |
77.2 |
74.7 |
71.4 |
67.5 |
64.1 |
63.1 |
59.5 |
56.9 |
55.8 |
80.1 |
|
MEAN |
83.2 |
83.8 |
84.8 |
84.9 |
85.4 |
84.8 |
82.5 |
80.5 |
79.5 |
75.7 |
73.0 |
69.7 |
65.9 |
62.8 |
61.0 |
57.8 |
54.5 |
53.2 |
67.4 |
|
Lower 25% |
82.0 |
82.2 |
83.9 |
84.2 |
84.0 |
83.3 |
81.9 |
79.6 |
78.4 |
74.2 |
71.9 |
68.1 |
63.9 |
61.5 |
59.4 |
56.0 |
54.0 |
52.3 |
55.1 |
|
-1σ |
81.3 |
81.5 |
83.6 |
83.8 |
83.5 |
82.8 |
78.5 |
78.9 |
78.0 |
73.6 |
71.4 |
67.5 |
63.0 |
60.8 |
58.3 |
55.1 |
51.1 |
46.9 |
52.2 |
|
Lower 10% |
80.8 |
81.0 |
83.3 |
83.7 |
83.2 |
82.6 |
78.1 |
78.6 |
77.6 |
73.0 |
70.8 |
66.8 |
62.6 |
60.0 |
57.1 |
54.5 |
46.6 |
45.7 |
48.7 |
|
Lower 5% |
80.2 |
80.3 |
82.9 |
83.3 |
82.9 |
82.2 |
77.7 |
78.0 |
77.2 |
72.5 |
69.0 |
66.0 |
62.3 |
59.4 |
55.5 |
53.2 |
46.0 |
44.8 |
46.8 |
|
-2σ |
79.9 |
79.9 |
82.6 |
82.9 |
82.6 |
81.7 |
77.5 |
77.5 |
76.8 |
72.3 |
68.4 |
64.7 |
62.1 |
59.0 |
54.7 |
52.0 |
45.5 |
43.9 |
45.6 |
|
Lowest |
77.9 |
78.3 |
82.0 |
82.4 |
82.4 |
81.3 |
77.0 |
76.9 |
75.4 |
71.6 |
67.5 |
62.3 |
61.1 |
58.1 |
54.0 |
50.7 |
44.1 |
42.3 |
42.1 |
After quality control, a total of 125,239 individual water temperature observations were available to calculate the values used in this climatology. Data was collected from the CORMP weather station on Ocean Crest Pier over the period 2006 through June, 2014. Current weather data for this site is available at this link.
Page Author and Statistical Analysis: Tim Armstrong
Page Created: July 31, 2014
Last Updated:; July 31, 2014


 Coastal Flood