|
Deadly EF3 Tornado Struck Brunswick County February 15 Moderate to Severe Drought Developed in the Spring, then again in Fall |
January
Low pressure moved across the Southeast states on January 7, reaching the South Carolina coast during the morning of January 8 and moving offshore during the day. A Gale Warning was posted for the coastal waters where wind gusts at Wrightsville Beach and at the Frying Pan Shoals buoy reached 42 mph. Over an inch of rain fell in many locations, including 1.58 inches in Hartsville, SC.
A series of low pressure systems continued to move across the Carolinas all month, dropping light to moderate amounts of rain each time. In Wilmington there were eight individual rainfall events during January, an unusually large number of storms for a winter with La Nina conditions present.
An arctic airmass built in behind a low that moved off the coast on January 28. High temperatures on January 29 remained in the 40s, and the following night lows fell to 26 degrees at North Myrtle Beach and 25 degrees in Wilmington, the coldest observed temperatures of the entire winter season.
The month began wet as a storm system moved across the Southeast, bringing widespread one to two inch rainfall amounts over the eastern Carolinas. Cold air built in as the storm system moved offshore, and as the arctic high moved across the Carolinas during the morning of February 4 temperatures in Florence fell to 22 degrees, the coldest of the winter there.
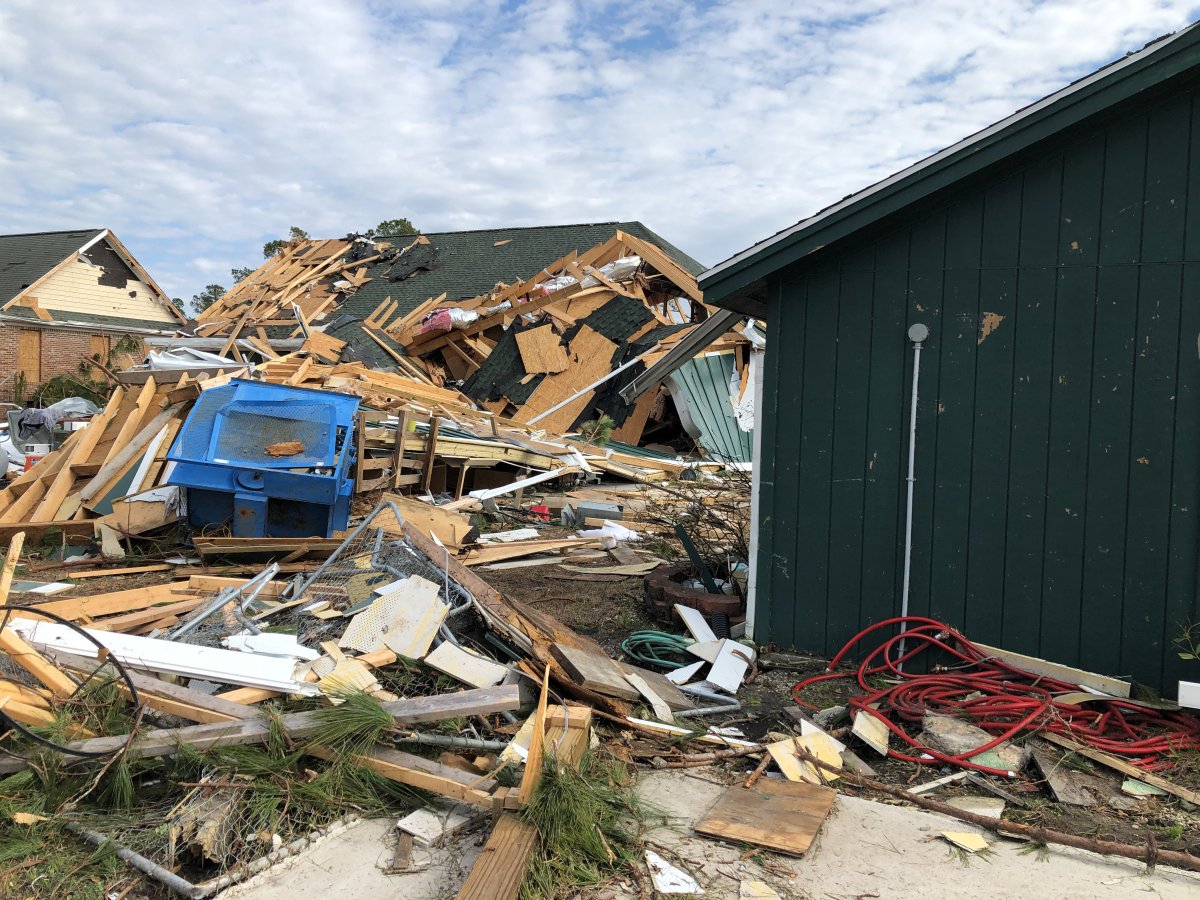
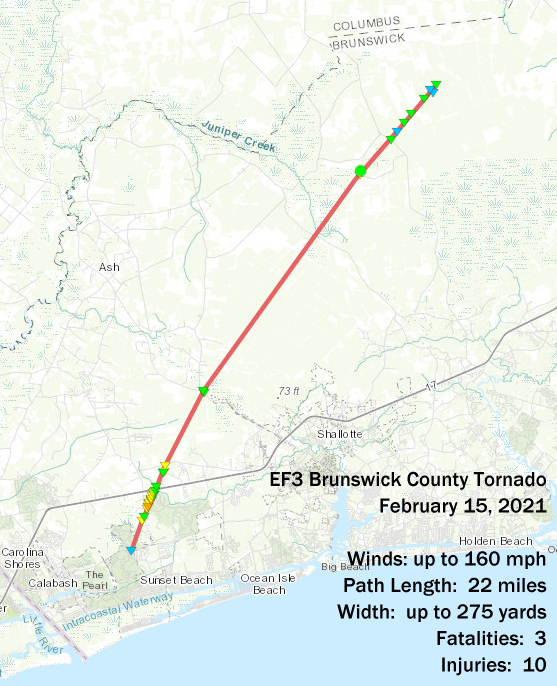
Low pressure developed across the northern Gulf of America early on February 15, then moved northward across Georgia and the central Carolinas. A warm front out ahead of the low lifted north along the Carolina coast, allowing temperatures to soar into the 60s after sunset. This warm and unstable airmass helped developed severe thunderstorms and a single powerful tornado with 160 mph winds that cut a 22 mile long path of destruction across Brunswick County, NC. This tornado killed three people and injured ten others in the Ocean Ridge Plantation community near Sunset Beach. This was the deadliest and most significant weather event of the year across southeastern North Carolina.
|
Damaged homes and storage buildings along Old Shallotte Road |
The NWS storm survey found a 22 mile path of destruction stretching from near Sunset Beach northeastward to beyond the Green Swamp |
|
Radar animation of the deadly tornado on February 15, 2021. The left panel is reflectivity; the right panel is storm-relative velocity. |
|
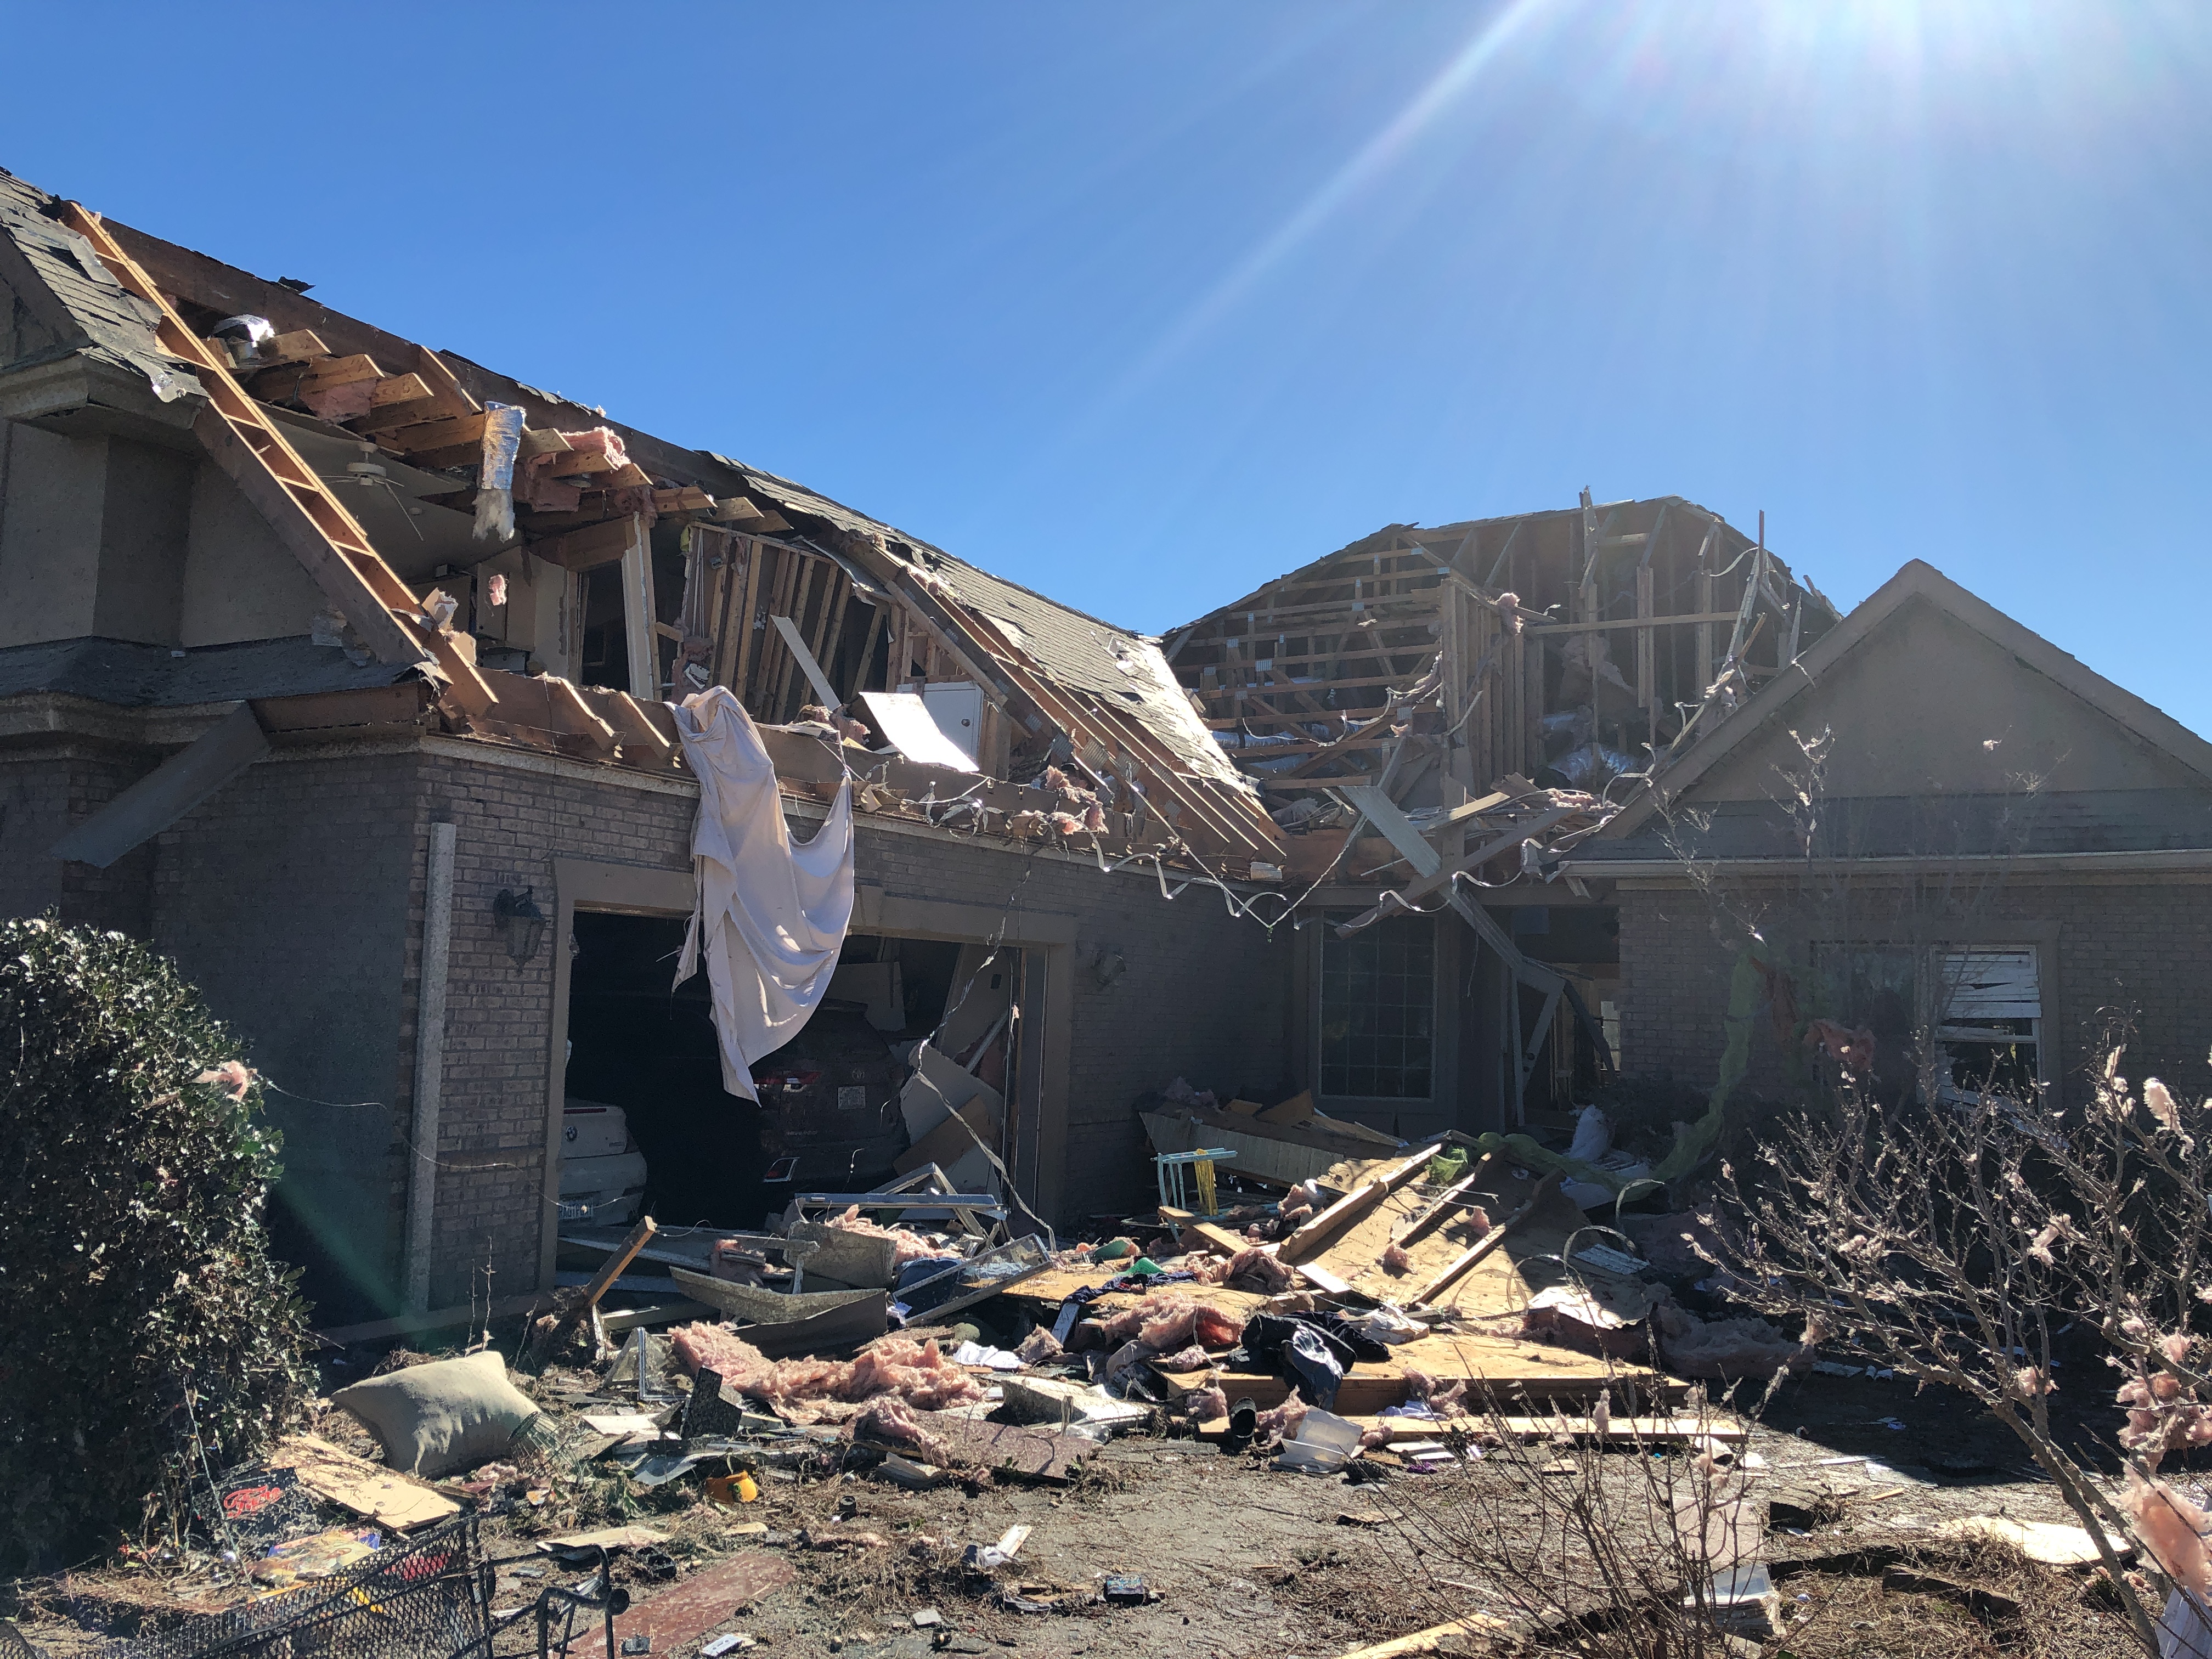
A destroyed home on Cambria Court in Ocean Ridge Plantation, Brunswick County, NC |
A destroyed home on Cambria Court in Ocean Ridge Plantation, Brunswick County, NC |
Additional information about this deadly tornado is available at this link: https://www.weather.gov/ilm/BrunswickTornadoFeb2021
March
This was an unusually warm month with temperatures averaging two to three degrees above normal. Only two nights (March 7 and 8) experienced widespread freezing temperatures, but seven days had high temperatures in the 80s in Wilmington.
An unusual low pressure system developed just off the Carolina coast over the Gulf Stream on March 22. While it never met official tropical cyclone criteria, bands of thunderstorms swirling around the center helped maintain a strong circulation for over 24 hours before it gradually weakened on March 23 and 24. Winds up to 40 knots were estimated by satellite scatterometer, with 40 mph gusts measured at the Frying Pan Shoals buoy.
|
Interesting convectively-driven low pressure off the Carolina coast on March 22-23, 2021. Top-left is infrared satellite, top-right is visible satellite, bottom-left is radar, and bottom-right is water vapor satellite imagery |
On March 28, the warmest day of the month with widespread inland temperatures in the mid to upper 80s, severe thunderstorms developed ahead of an approaching cold front. Wind gusts were measured as high as 51 mph on the UNC-Pembroke campus in Robeson County, NC.
April
A strong cold front pushed through the Carolinas on April 1, ushering in one of the final arctic airmasses of the spring. Even though normal dates for the last spring freeze are mid to late March across most of the eastern Carolinas, widespread freezing temperatures occurred on the morning of April 3 with 29 degrees reported at Lumberton, 30 in Wilmington, and 31 in Florence and Myrtle Beach. This was the final freeze of the spring, and the 2021 growing season began the next day.
Except for widespread showers on April 11 and 25, both associated with frontal systems arriving from the west, April was unusually dry. Rainfall for the month only amounted to 0.15 inches in Florence, the driest April on record here and the driest month overall since September 2005. Other locations across the eastern Carolinas didn’t fare much better with monthly totals 1.5 to 3.0 inches below normal.
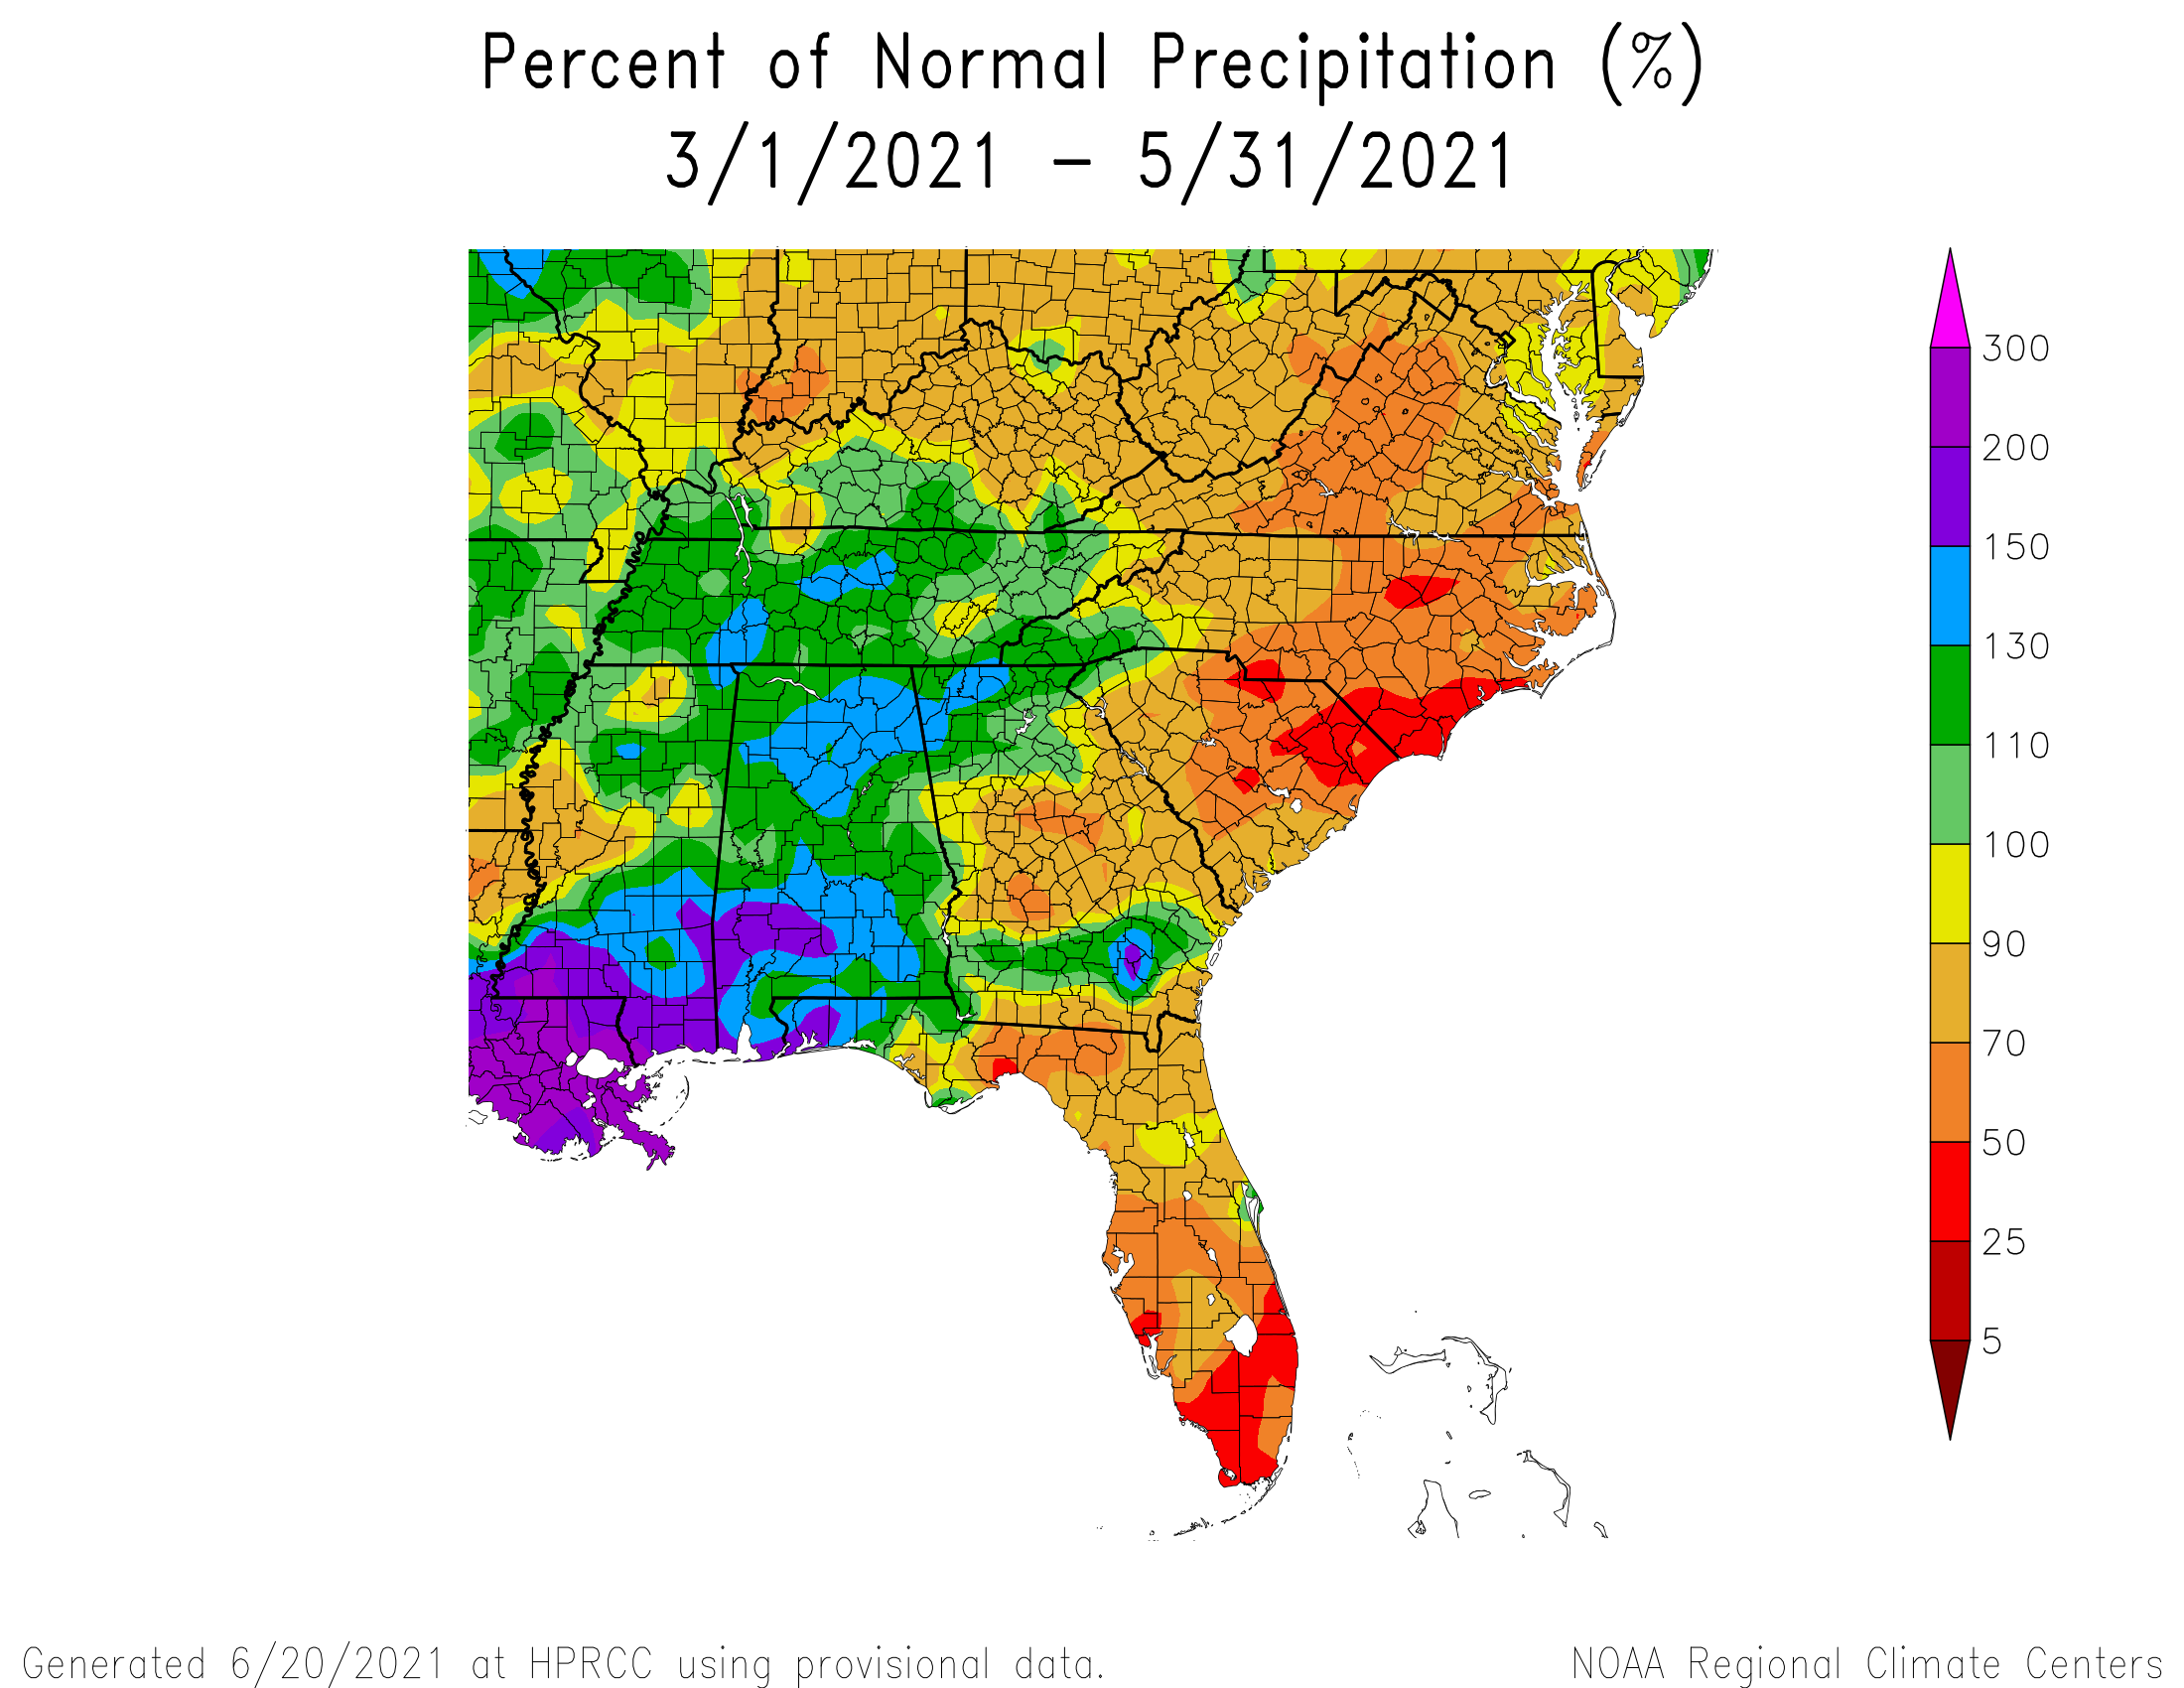
Unusually dry weather continued through May, culminating in a short-lived but severe drought across the eastern Carolinas. Corn was stunted, and farmers had to delay planting some crops until sufficient soil moisture was present.
|
Spring rainfall was well below normal across eastern North and South Carolina. Red shading on this map represents rainfall less than 50 percent of normal. |
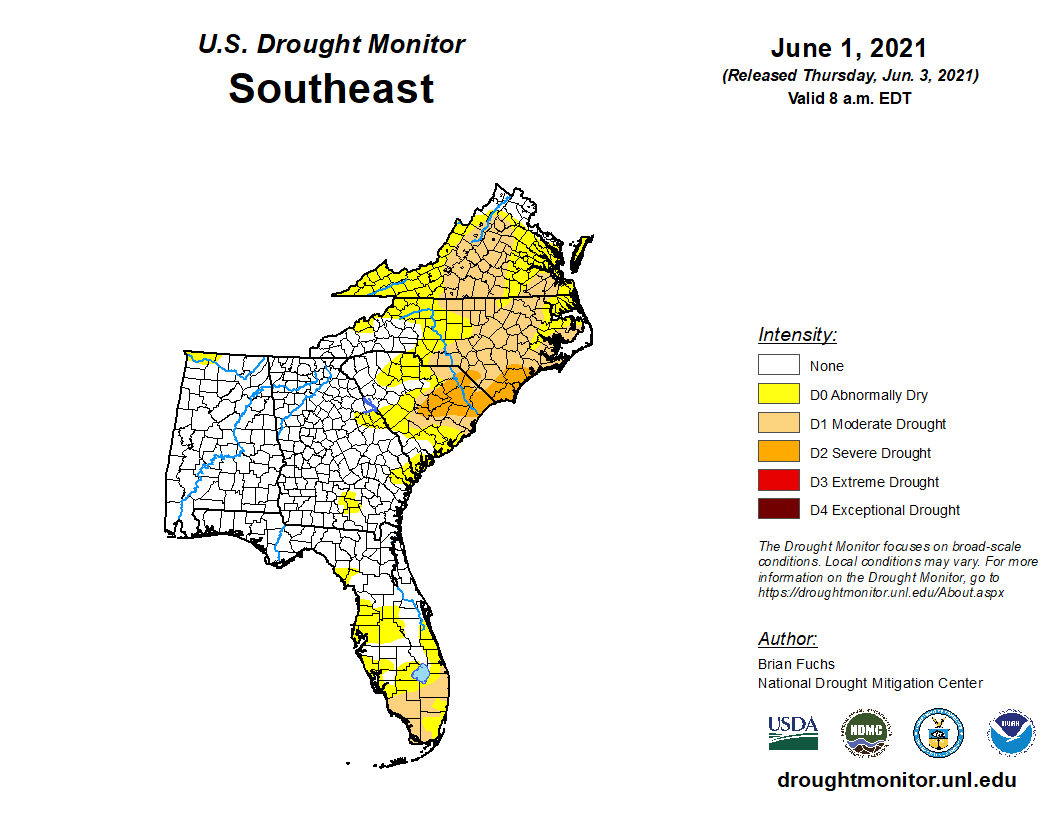
The U.S. Drought Monitor on June 1 showed moderate to severe drought across portions of eastern North and South Carolina, closely matching observed rainfall deficits. |
Some of the hottest temperatures of the entire year occurred near the end of May as a ridge of high pressure moved across the Southeast. Temperatures on May 24 reached 98 in Lumberton, and on May 27 reached 96 in Florence and 98 in Wilmington – all the highest temperatures recorded for these cities during 2021. Despite this heat, average highs for the month were only slightly above normal with average lows 2 to 3 degrees colder than normal. Large day-to-night temperature swings are a clear sign of dry air that prevailed for most of the month.
The only rain during the month fell during brief and occasionally severe thunderstorms. A pair of upper level disturbances moving across the area May 3 and 4 produced severe thunderstorms both days across eastern South Carolina. Hail up to two inches in diameter fell in Timmonsville, SC around 5:00 pm on May 3, and widespread wind damage occurred in Darlington and Marlboro counties on May 4. A particularly strong upper level disturbance that moved across southeastern North Carolina during the morning of May 7 produced widespread hail. While most reports were of small hail, hailstones 1 to 1.75 inches in diameter were reported from Red Springs and Elizabethtown, NC.
|
|
June
The month got off to a chilly start with morning lows in the mid 50s on June 1, the coolest of the whole month. Warmer and more humid air pushed back onshore over the next couple of days as low pressure developed across the Southeast. This led to the first widespread, soaking rain in months with most areas picking up between one and three inches between June 2 and 4. Two weak tornadoes occurred during the evening of June 2. The first tornado touched down near the town of Evergreen in Columbus County, NC at 5:25 pm and had winds up to 80 mph. The second tornado occurred just west of Clarkton in Bladen County, NC shortly after 9 pm and had 60 mph winds. No injuries occurred with either tornado.
Severe thunderstorms developed again on June 15 with widespread hail and wind damage reports across southeastern North Carolina into Horry County, SC. Wind gusts up to 56 mph were measured at a buoy off Wrightsville Beach, NC.
On June 19 Tropical Storm Claudette formed near the Louisiana Gulf coast. The system weakened as it moved across the Southeast states, passing across South and North Carolina on June 20 as a tropical depression with wind gusts of 30 to 40 mph.
|
One day of hot weather built across the Carolinas behind Claudette on June 21 and North Myrtle Beach reached 92 degrees, the hottest reading of the year. This is tied with 2018, 2013, 2003, and 2001 for the coolest annual maximum temperature at North Myrtle Beach.
On June 27, a tropical depression formed off the South Carolina coast. This system strengthened and became Tropical Storm Danny early in the morning of June 28. Danny moved west-northwestward and made landfall later in the day on June 28 in Beaufort County, SC. Impacts across our area were minor, limited to scattered showers and an increased number of rip currents at the beaches. Up to an inch of rain fell in spots.
|
Frequent showers and thunderstorms during most of June helped alleviate the moderate to severe drought that developed during the spring. By the end of June, only a small portion of Bladen, Columbus, and Brunswick counties remained in drought.
The Atlantic Hurricane Season continued its record-breaking pace in July when Tropical Storm Elsa formed on July 1. This was the earliest in the year that the fifth named tropical system had formed in the Atlantic Ocean. Elsa became a hurricane in the Caribbean on July 2, then after weakening to a tropical storm became a hurricane again off the west coast of Florida on July 6. After its landfall on the Florida Panhandle Elsa moved northeastward across the Carolinas on July 8, producing widespread wind gusts of 40 to 50 mph with rainfall amounts over four inches in parts of Horry and Georgetown counties. Trees were blown down across northeastern South Carolina and power outages occurred in Myrtle Beach. Elsa's winds raised coastal water levels one to two feet above normal on July 8, but no tidal flooding or significant beach erosion occurred.
|
Visible satellite and radar composite of Tropical Storm Elsa moving across South and North Carolina. This loops runs from 6:41 am until 2:56 pm EDT on July 8, 2021. Lightning strikes are indicated in yellow. |
More about Tropical Storm Elsa's impact on the Carolinas is available here: https://www.weather.gov/ilm/Elsa2021
After Elsa left the area, a period of hot weather developed across the Carolinas. Florence, SC reached 90 degrees for ten consecutive days between July 9 and July 18. While by historic standards this is not particularly impressive (the record in Florence is 53 days between June 15 and August 6, 1993) it was the longest hot stretch of the year.
A cold front approached the Carolinas on July 18, igniting severe thunderstorms with damaging wind gusts during the afternoon hours across Florence and Marion counties in South Carolina.
August
A cold front stalled across North Carolina on August 1, leading to severe thunderstorms across the area during the afternoon. Wind gusts up to 51 mph were recorded at Wrightsville Beach, and multiple reports of downed trees were received from inland areas. The front settled along the coast during August 2 and 3 helping produce widespread showers and thunderstorms, some with very heavy rainfall. Flash flooding developed on August 3 in Myrtle Beach and Marion, SC. The 3.49 inches of rain measured in North Myrtle Beach on August 3 was the heaviest one-day rainfall of the year there.
Between August 18 and 20 Tropical Storm Henri remained several hundred miles off the Southeast coast as it turned a clockwise loop and lined up for an eventual New England impact several days later. A cold front unrelated to Henri produced scattered thunderstorms across the area on August 20. One of these storms become severe over Wilmington where a wind gust of 59 mph was recorded at the airport, the strongest measured gust of the year.
A hot ridge of high pressure build across the Southeast for the end of August. In Lumberton daily high temperatures soared into the 90s for nine consecutive days between August 23 and August 31. Wilmington's eight consecutive 90 degree days from August 24 through August 31 were the most of the year too. Overall, this summer experienced near normal temperatures, but with no 100 degree readings, even inland.
September
Tropical moisture was pulled northward across the Carolinas on September 21-22 ahead of an approaching cold front. This led to widespread showers and thunderstorms across coastal North Carolina and localized flash flooding. Road closures due to flooding were reported from Winnabow and Bolivia in Brunswick County, and people were rescued from flooded vehicles in Wilmington. On September 21, 3.79 inches of rain fell in Wilmington with an additional 4.31 inches on September 22 -- the highest one-day rainfall total of the year.
As this front pushed offshore on September 23, the first dry airmass of the fall season settled across the eastern Carolinas. Nighttime low temperatures fell into the 50s all the way down to the beaches and some inland locations like Bennettsville and Hartsville, SC reported lows in the upper 40s.
October
Although several fronts stalled across the Carolinas this month, only light and spotty rain resulted from most of these systems. In Wilmington only 0.73 inches of rain was recorded during October, the third time this year with monthly total rainfall less than one inch. This was the first time since 2001 that three months in the same year in Wilmington saw less than an inch of rain. The U.S. Drought Monitor categorized much of eastern North and South Carolina as "abnormally dry" as rainfall deficits began to grow.
High pressure aloft and clear skies most of the month meant temperatures ran two to three degrees above normal.
November
A powerful storm system developed off the Southeast coast in early November, helping produce several days of significant coastal flooding. This was the result of a storm surge due to strong winds plus large astronomical tides that occurred during November's New Moon. Measured water levels at the beaches were some of the highest on record for non-tropical storms. Salt-water flooding and significant beach erosion occurred, particularly on Topsail Island, Carolina Beach, Cherry Grove Beach, Garden City Beach, and Pawleys Island.
|
Infrared satellite animation from November 6 to 8, 2021 of the coastal storm that helped produce significant coastal flooding along the South and North Carolina coastline. |
|
|
Winds at the offshore buoys reached 50 to 70 mph in gusts, but on the coast peak gusts were generally 35 to 50 mph. The system remained just far enough offshore that rainfall was generally one inch or less and did not significantly contribute to flooding.
Rainfall was generally light and spotty through the remainder of the month, again making November a very dry month across the eastern Carolinas. Rainfall deficits of two to three inches were recorded at area weather stations. The U.S. Drought Monitor officially indicated drought conditions began across portions of the eastern Carolinas on November 2, and became severe across portions of the Pee Dee and Sandhills regions by the end of the month.

A strong cold front pushed off the coast on November 22, followed by a chilly arctic airmass. The first freeze of the fall season occurred during the night of November 23-24, ending the growing season at 233 days across most of the eastern Carolinas. Unusually chilly temperatures persisted through the end of November, and monthly temperatures ended up two to almost four degrees below normal.
December
After November's persistently chilly weather, the weather pattern flipped at the beginning of December. Strong high pressure overhead or just offshore brought warm, tropical air northward and well-above normal temperatures developed. December 3rd saw highs in the 80s across most of the eastern Carolinas. Wilmington recorded 80 degree high temperatures on December 11, 17, and 29, and had an amazing 18 days this month with highs 70 degrees or warmer -- the second most on record behind 2015. In Florence, SC the all-time record for the number of 70° or higher December days was tied at 17.
| Most Number of December Days with Highs 70° or Higher | |||
| Wilmington | N. Myrtle Beach | Florence | Lumberton |
| 21 in 2015 | 19 in 2015 | 17 in 2021 | 17 in 2015 |
| 18 in 2021 | 15 in 1956 | 17 in 1956 | 16 in 2021 |
| 16 in 1990 | 13 in 1998 | 16 in 2015 | 16 in 1956 |
| 16 in 1984 | 13 in 1931 | 14 in 1984 | 14 in 1971 |
| 16 in 1971 | 12 in 2021 | 13 in 1998 | 11 in 1998 |
Just as significant was the lack of nighttime cold. Wilmington normally experiences nine nights in December with freezing temperatures, but low temps remained above freezing on all but one night. This is tied for the second fewest number of December freezes on record. Myrtle Beach, SC also recorded only a single freezing night this month, the fewest number of December freezes since records began there in 1931.
As dry weather persisted through the first week of December, severe drought conditions expanded to cover most of the area. Light to moderate rain on December 8, 12, 19, and 21 helped take the edge off the unusually dry conditions, and by the end of the month the "severe drought" designation was confined to just inland areas.
Unusual warmth redeveloped just in time for Christmas with high temperatures in the 70s to near 80 degrees observed on each day through the end of the year. December's average temperature ran 6 to 9 degrees above normal, and in Wilmington it was the second warmest December on record behind 2015.
2021 City Climate Summaries
New climate normals spanning the period 1991-2020 became available for use during May of 2021. All climate data below is computed using the new normals, therefore departure from normals will not match what was reported in real-time January through April.
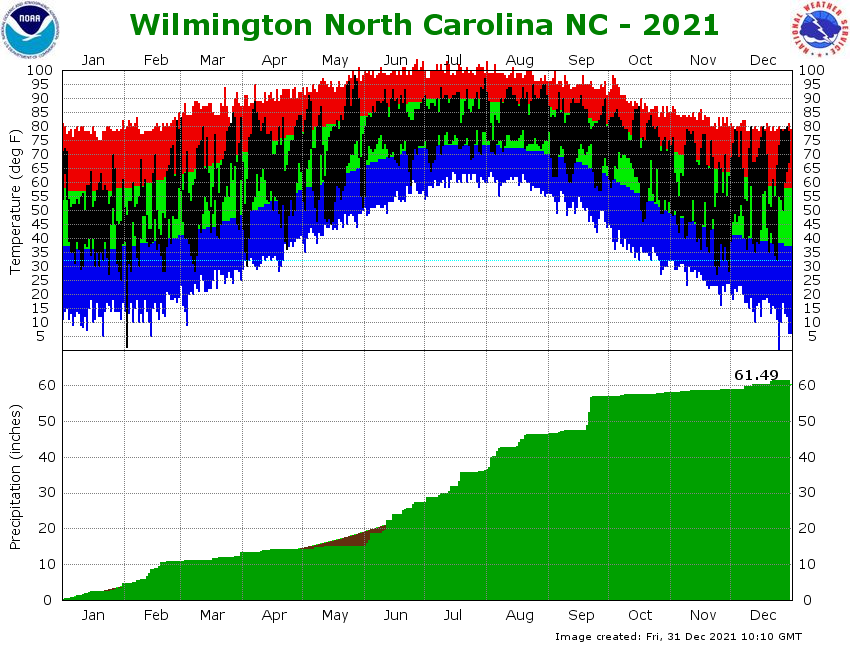
Wilmington, North Carolina
     Avg Hi/Dep   Avg Lo/Dep   Avg T/Dep   Warmest   Coolest   Precip/Dep
JAN   57.1/-0.1    37.4/+1.1   47.2/+0.4   72/2nd    25/30th   4.79/+0.98
FEB   57.3/-3.0    39.5/+1.1   48.4/-0.9   82/27th   28/21st   6.04/+2.57
MAR   69.4/+2.9    47.7/+3.6   58.5/+3.2   85/27th   28/8th    2.62/-1.35
APR   76.0/+1.4    51.6/-1.0   63.8/+0.2   89/7th    30/3rd    0.74/-2.33
MAY   82.4/+1.3    58.5/-2.6   70.5/-0.6   98/27th   45/15t    0.95/-3.59
JUN   87.0/+0.0    70.3/+1.0   78.7/+0.5   93/21st   55/1st   12.26/+6.59
JUL   89.3/-0.7    73.0/+0.0   81.2/-0.3   97/31st   64/4th    8.85/+1.99
AUG   89.4/+1.1    74.3/+2.6   81.8/+1.8   95/30th   70/5th   10.07/+1.91
SEP   85.2/+1.3    66.6/-0.1   75.9/+0.6   92/6th    57/27th  10.77/+2.08
OCT   79.5/+3.4    59.7/+4.1   69.6/+3.7   87/16th   46/18th   1.14/-3.52
NOV   67.6/+0.2    41.1/-3.7   54.3/-1.8   79/9th    27/24th   0.73/-2.83
DEC   70.3/+10.0   46.7/+7.6   58.5/+8.8   80/29th   32/24th   2.53/-1.16
--------------------------------------------------------------------------
ANN   75.9/+1.5    55.5/+1.1   65.7/+1.3   98        25       61.49/+1.34

Number of days with Temperatures...
90 degrees or higher:  56 (11 more than normal)
32 degrees or lower:   25 (12 fewer than normal)

Heating degree days: 1956 (370 fewer than normal)
Cooling degree days: 2352 (219 more than normal)

Number of days with precipitation...
0.01" or greater: 128 (6 more than normal)
0.10" or greater:  84 (5 more than normal)
0.50" or greater:  36 (exactly normal)
1.00" or greater:  20 (2 more than normal)

Thunderstorms occurred on 52 days.
No snow or sleet fell.

Average wind speed: 7.3 MPH
Maximum 2-minute wind speed: 49 mph on August 20 (Severe thunderstorm)
Maximum 5-second wind gust: 59 mph on August 20 (Severe thunderstorm)
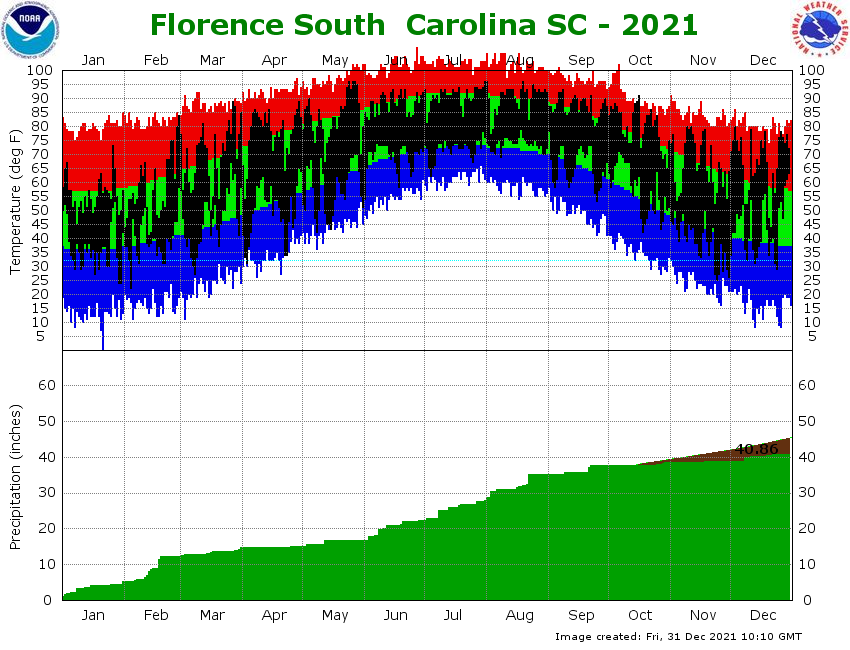
Florence, South Carolina
     Avg Hi/Dep   Avg Lo/Dep   Avg T/Dep   Warmest   Coolest   Precip/Dep
JAN   55.8/-1.3    36.5/+0.5   46.1/-0.5   73/28th   24/30th   5.14/+2.06
FEB   58.3/-2.5    39.0/+0.4   48.6/-1.1   84/28th   22/4th    7.24/+4.24
MAR   70.1/+1.8    46.4/+2.1   58.3/+2.0   89/27th   27/8th    2.40/-0.79
APR   77.8/+1.1    49.7/-2.4   63.7/-0.7   89/29th   31/3rd    0.15/-2.85
MAY   83.8/+0.3    57.3/-3.6   70.5/-1.7   96/27th   42/8th    1.73/-1.98
JUN   88.1/-1.1    69.1/+0.1   78.6/-0.5   93/21st   54/1st    5.59/+0.98
JUL   90.8/-1.2    71.7/-0.7   81.3/-0.9   96/31st   62/4th    5.65/-0.15
AUG   90.3/+0.0    73.5/+2.1   81.9/+1.0   96/19th   69/8th    7.34/+2.48
SEP   87.2/+1.8    65.4/-0.4   76.3/+0.7   93/8th    53/25th   2.41/-2.12
OCT   80.4/+3.7    57.2/+2.9   68.8/+3.3   91/16th   42/18th   0.80/-2.62
NOV   66.7/-0.3    38.5/-5.0   52.6/-2.7   80/11th   25/24th   0.45/-2.18
DEC   68.0/+8.6    44.1/+5.8   56.1/+7.2   80/3rd    29/24th   1.96/-1.51
--------------------------------------------------------------------------
ANN   76.4/+0.8    54.0/+0.1   65.2/+0.5   96        22       40.86/-4.44

Number of days with Temperatures...
90 degrees or higher:  77 (7 more than normal)
32 degrees or lower:   28 (12 fewer than normal)

Heating degree days: 2111 (223 fewer than normal)
Cooling degree days: 2320 (63 more than normal)

Number of days with precipitation...
0.01" or greater: 117 (6 more than normal)
0.10" or greater:  73 (exactly normal)
0.50" or greater:  28 (2 fewer than normal)
1.00" or greater:  11 (1 fewer than normal)

Thunderstorms occurred on 48 days.
No snow fell.

Average wind speed: 6.4 MPH
Maximum 2-minute wind speed: 36 mph on August 1 (Thunderstorm)
Maximum 5-second wind gust: 48 mph on July 18 (Thunderstorm)
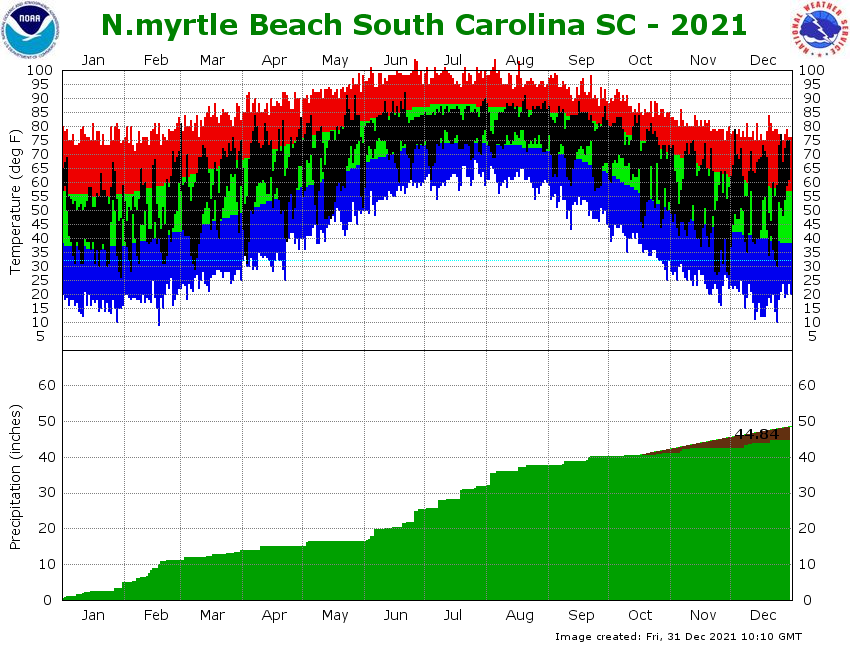
North Myrtle Beach, South Carolina
     Avg Hi/Dep   Avg Lo/Dep   Avg T/Dep   Warmest   Coolest   Precip/Dep
JAN   55.8/+0.1    38.5/+1.8   47.2/+1.0   69/3rd    26/30th   4.95/+1.94
FEB   55.8/-2.4    40.2/+0.6   48.0/-0.9   71/28th   28/4th    6.10/+2.92
MAR   66.5/+1.8    47.5/+2.1   57.0/+2.0   81/1st    29/8th    2.80/-0.79
APR   72.4/+0.6    52.2/-1.1   62.3/-0.2   84/7th    31/3rd    1.30/-1.47
MAY   78.9/+0.2    59.7/-2.4   69.3/-1.1   91/27th   45/8th    1.42/-1.54
JUN   83.8/-1.0    70.6/+0.3   77.2/-0.3   92/21st   58/1st    8.94/+4.87
JUL   85.6/-2.0    72.8/-0.9   79.2/-1.4   90/31st   61/4th    6.38/+0.98
AUG   85.6/-0.9    74.1/+1.6   79.9/+0.4   91/20th   69/5th    5.90/-0.35
SEP   83.3/+0.1    67.0/-0.7   75.1/-0.4   89/16th   57/24th   2.46/-4.19
OCT   77.2/+1.6    59.1/+2.8   68.1/+2.1   84/16th   44/27th   0.83/-3.37
NOV   64.3/-2.1    40.6/-5.0   52.5/-3.5   75/12th   27/30th   1.39/-1.90
DEC   66.0/+6.7    45.5/+5.5   55.8/+6.2   79/3rd    30/24th   2.37/-0.73
--------------------------------------------------------------------------
ANN   72.9/+0.2    55.7/+0.5   64.3/+0.3   92        26       40.35/-8.12

Number of days with Temperatures...
90 degrees or higher:   5 (16 fewer than normal)
32 degrees or lower:   25 (9 fewer than normal)

Heating degree days: 2115 (228 fewer than normal)
Cooling degree days: 1989 (14 fewer than normal)

Number of days with precipitation...
0.01" or greater: 120 (2 fewer than normal)
0.10" or greater:  71 (exactly normal)
0.50" or greater:  30 (1 fewer than normal)
1.00" or greater:  12 (1 fewer than normal)

Thunderstorms occurred on 53 days.
No snow fell.

Average wind speed: 7.5 MPH
Maximum 2-minute wind speed: 37 mph on July 8 (Tropical Storm Elsa)
Maximum 5-second wind gust: 50 mph on July 8 (Tropical Storm Elsa)
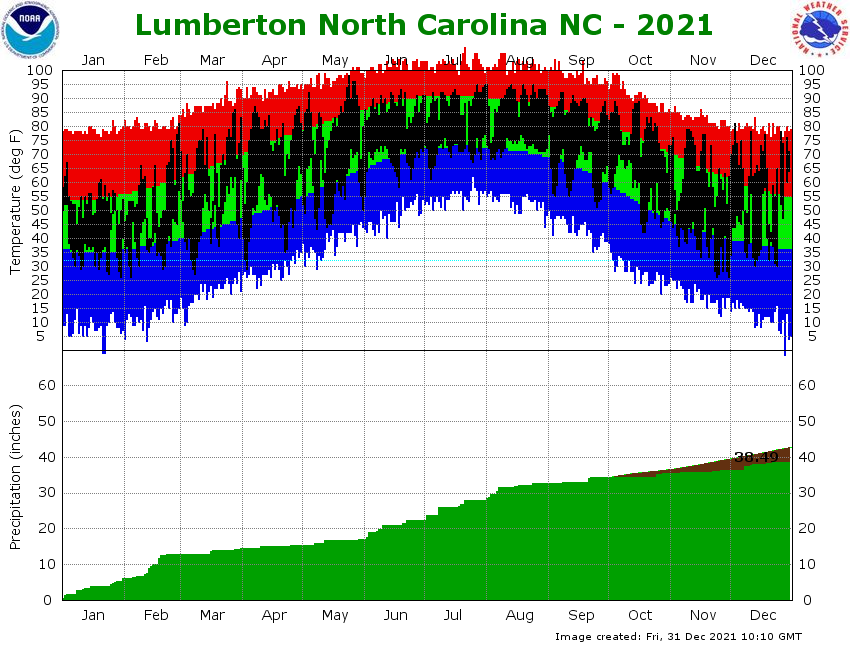
Lumberton, North Carolina
     Avg Hi/Dep   Avg Lo/Dep   Avg T/Dep   Warmest   Coolest   Precip/Dep
JAN   53.9/-0.7    36.4/+1.1   45.1/+0.2   67/3rd    26/30th   6.07/+3.30
FEB   56.9/-1.7    38.3/+0.9   47.6/-0.4   81/28th   26/4th    6.61/+3.35
MAR   68.9/+3.1    46.0/+2.9   57.7/+3.2   86/28th   27/8th    1.81/-1.04
APR   76.5/+1.8    49.2/-1.5   62.8/+0.1   87/29th   29/3rd    0.85/-2.56
MAY   82.9/+0.4    57.3/-2.2   70.1/-0.9   98/24th   43/8th    1.68/-3.24
JUN   87.2/-1.6    68.1/-0.6   77.6/-1.2   93/19th   55/1st    5.39/+0.78
JUL   89.6/-1.4    71.0/-1.3   80.3/-1.3   95/31st   61/4th    5.60/+0.83
AUG   90.0/+0.9    72.5/+1.6   81.2/+1.2   95/24th   68/5th    4.63/-0.30
SEP   86.0/+1.8    63.4/-1.4   74.7/+0.2   92/8th    51/25th   1.62/-0.67
OCT   78.8/+2.9    56.3/+3.8   67.5/+3.3   89/16th   42/19th   1.35/-1.60
NOV   65.1/-0.8    38.3/-4.1   51.7/-2.4   79/10th   26/30th   0.71/-2.60
DEC   66.7/+9.2    43.7/+6.2   55.2/+7.7   81/3rd    30/24th   2.18/-1.13
--------------------------------------------------------------------------
ANN   75.1/+1.0    53.4/+0.5   64.3/+0.8   98        26       38.50/-4.12

Number of days with Temperatures...
90 degrees or higher:  63 (4 fewer than normal)
32 degrees or lower:   30 (21 fewer than normal)

Heating degree days: 2279 (330 fewer than normal)
Cooling degree days: 2122 (35 more than normal)

Number of days with precipitation...
0.01" or greater: 104 (14 fewer than normal)
0.10" or greater:  70 (1 fewer than normal)
0.50" or greater:  30 (2 more than normal)
1.00" or greater:  10 (exactly normal)
Research & Page Author: Tim Armstrong
Last Updated: January 2, 2022


 Coastal Flood
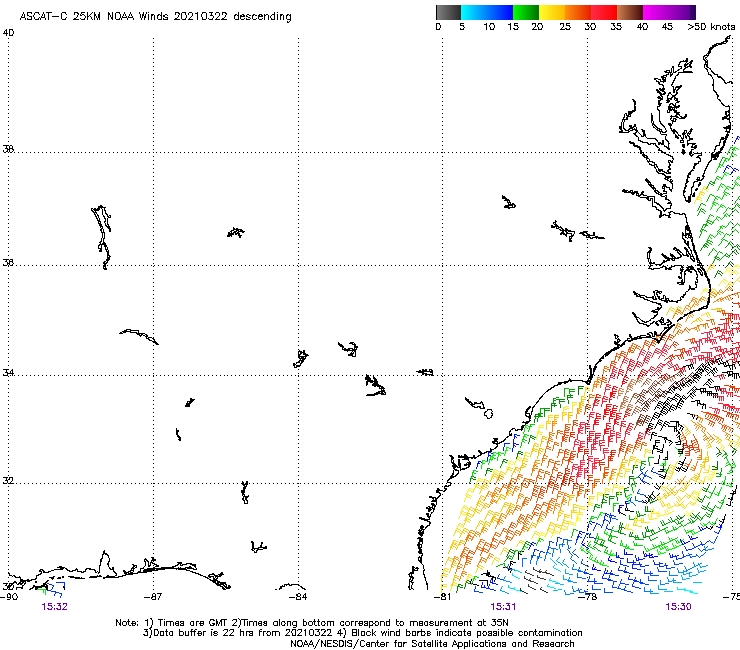