Meteorological fall begins September 1 and continues through November 30. This three month period features falling temperatures due to shorter days and longer nights as the sun's direct rays shift south across the equator. The first half of fall contains the most active portion of the Atlantic hurricane season. Average daytime highs in the 80s in September will fall to the mid 60s by the end of November, along with a good potential for some frosty mornings.
> > > Why is meteorological fall different than fall on the calendar?
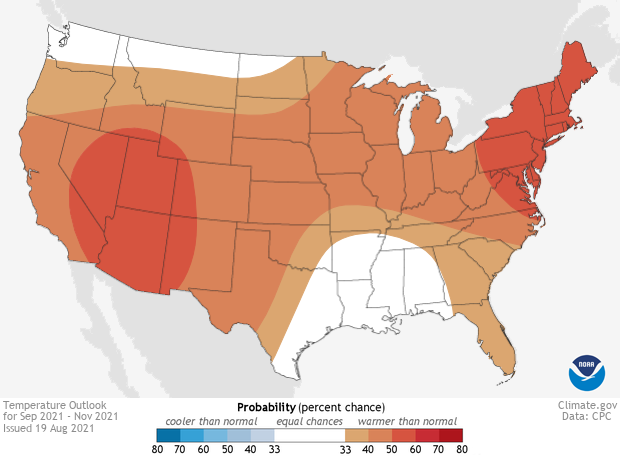
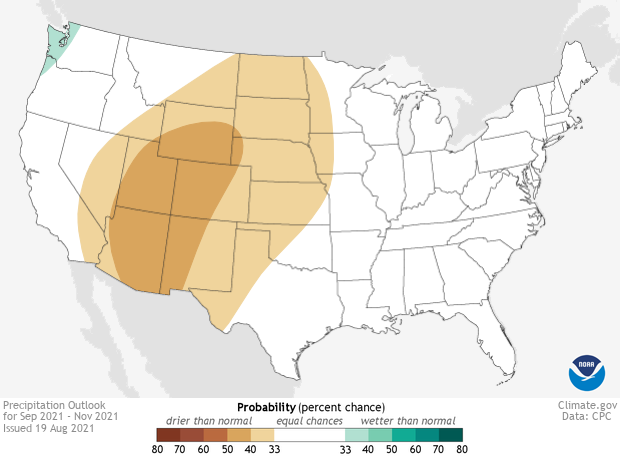
The latest outlook from the NWS Climate Prediction Center (CPC) shows an increased potential for above normal temperatures across the Carolinas this fall. Their precipitation outlook shows "equal chances" for above, near, or below normal rainfall over the same time.
|
The NWS Climate Prediction Center temperature outlook for September-November shows a 40 percent chance of above-normal temperatures across our portion of the Carolinas. |
The NWS Climate Prediction Center precipitation outlook for September-November shows equal chances of below, near, or above normal rainfall across the Carolinas. |
Developing La Niña
ENSO (El Niño Southern Oscillation) is a naturally occurring climate pattern that can have significant impacts on weather across the Carolinas. We monitor ENSO by measuring sea water temperatures in the tropical east Pacific Ocean. Above normal water temperatures there create El Niño; below normal water temperatures create La Niña.
Currently tropical east Pacific water temperatures are near normal, but there is increasing support among computer climate models for water temperatures to fall below normal this fall. CPC has issued a La Niña Watch for the anticipated development of a new La Niña in the coming months.
|
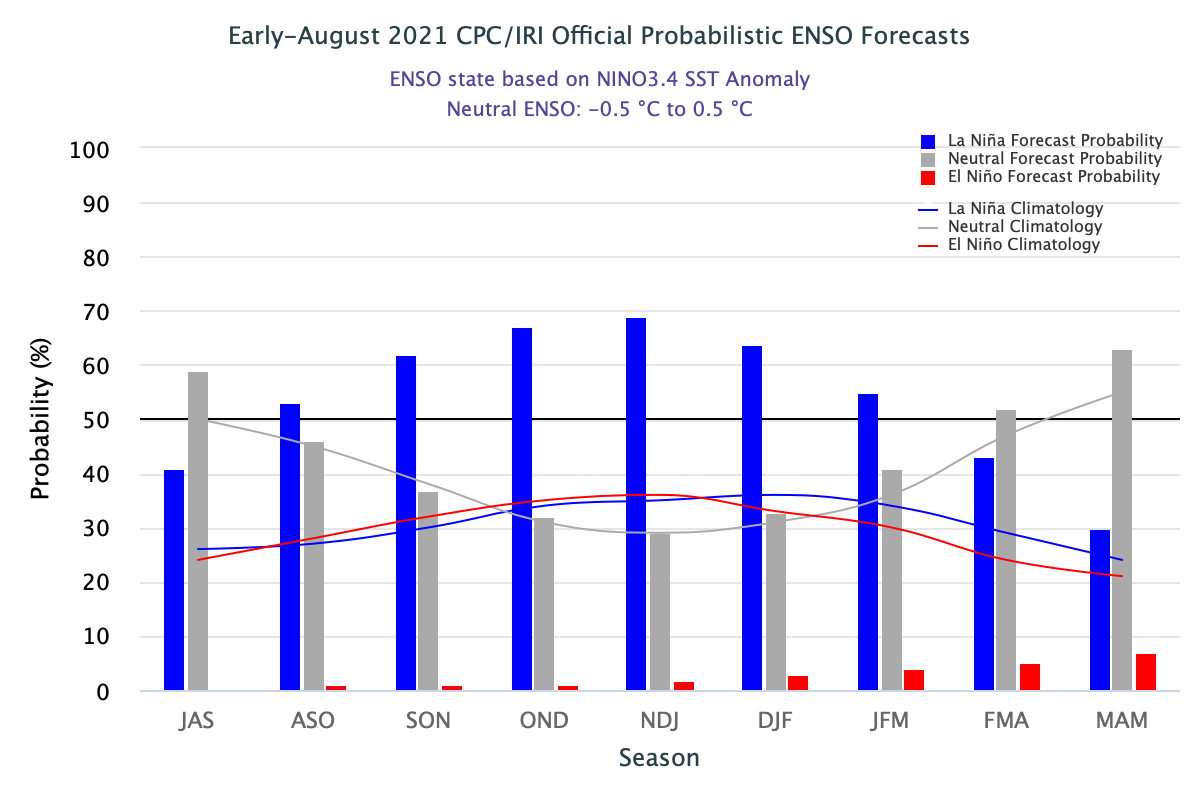
ENSO forecasts produced by the International Research Institute for Climate and Society at Columbia University. This shows the probabilities of La Niña (blue), neutral conditions (gray), and El Niño (red) for overlapping three-month periods now through March-April-May (MAM) of 2022. The forecast probability of La Niña peaks during November-December-January at almost 70 percent. |
> > > Learn more about El Nino and La Nina...
The transition from neutral ENSO conditions during the summer to La Niña conditions during the fall has happened a number of times over the past 20 years, including in 2005, 2008, 2016, 2017, and 2020.
Tropical Storms and Hurricanes
|
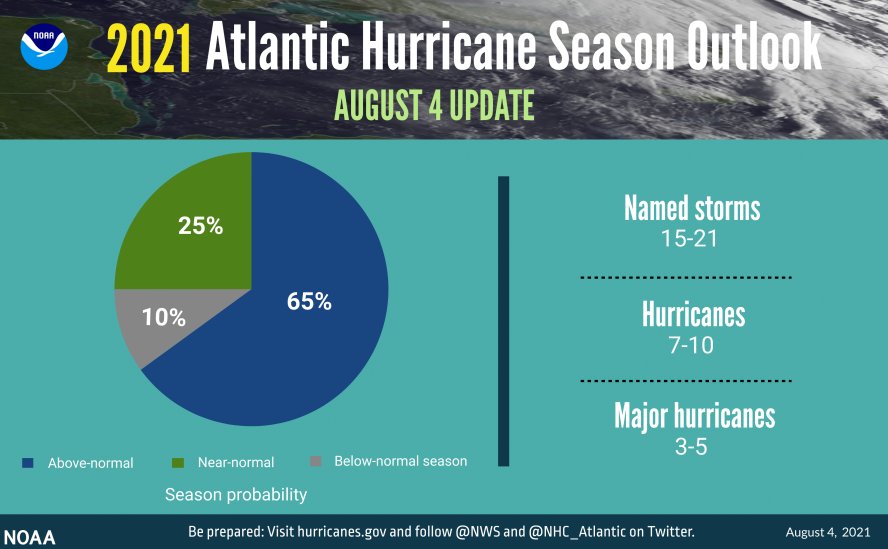
NOAA Seasonal Hurricane Outlook 2021, updated August 4, 2021 |
With 12 named storms so far, the 2021 Atlantic Hurricane Season has displayed above normal activity through the beginning of September. The official NOAA seasonal outlook still calls for an active season with 15 to 21 named storms, 7 to 10 hurricanes, and 3 to 5 major hurricanes -- all above the recently updated seasonal normals of 14 named storms, 7 hurricanes, and 3 major hurricanes.
The transition from neutral ENSO conditions to La Niña is usually associated with an above normal number of Atlantic tropical storms and hurricanes. Tropical cyclones or their remnants have impacted the Carolinas during the fall in each of the past five years where a summer neutral ENSO pattern changed into a fall La Niña. These tropical systems included:
The Atlantic hurricane season runs through the end of November. Specific local impacts (if any) from tropical cyclones on the Carolinas cannot be predicted with any accuracy at the seasonal time range. If a storm does threaten the area, official storm information is posted by the National Hurricane Center with local forecasts available at weather.gov/ilm
> > > Hurricane Preparedness Tips...
Tropical storms and hurricanes can have impacts on the beaches of North and South Carolina even when the storms are located thousands of miles away. Long period swells generated by hurricanes travel great distances across the ocean and can create large surf and dangerous rip currents when they strike the beach. Since 2004 when the National Weather Service in Wilmington began collecting daily lifeguard reports, September has been the busiest month for "moderate" or "strong" rip current reports -- often the result of waves generated by distant hurricanes.
|
Monthly compilation of lifeguard supplied rip current reports from Wrightsville Beach 2004 through 2019. September has the highest incidence of moderate or strong rip currents of any month during the warm season. Graphic created by Vicky Oliva. |
> > > Learn more about Rip Currents here...
Our latest beach forecasts are available at https://www.weather.gov/beach/ilm from April through October.
Temperatures
In four of the five previous fall seasons with developing La Niña, temperatures ran above normal across northeastern South Carolina and southeastern North Carolina. This was particularly true during the fall of 2020 when North Myrtle Beach recorded its second warmest fall average temperature on record and Wilmington had its third warmest. While La Niña may play some role here, the bigger factor is likely the continued upward trend in temperatures due to climate change. The Climate Prediction Center's long-lead discussion references "trends" (observed climate change) and various dynamical forecast models as inputs to their climate outlook for the fall.
| Wilmington | Lumberton | N. Myrtle Beach | Florence | |
| NORMAL FALL TEMPERATURE | 65.8° | 64.3° | 65.8° | 65.5° |
| Fall 2005 observed (and anomaly) | 67.4° (+1.6°) | 66.0° (+1.7°) | 67.0° (+1.2°) | 66.4° (+0.9°) |
| Fall 2008 observed (and anomaly) | 63.4° (-2.4°) | 62.0° (-2.3°) | 64.1° (-1.7°) | 62.1° (-3.4°) |
| Fall 2016 observed (and anomaly) | 66.6° (+0.8°) | 66.0° (+1.7°) | 67.1° (+1.3°) | 67.4° (+1.9°) |
| Fall 2017 observed (and anomaly) | 67.0° (+1.2°) | 63.8 (-0.5°) | 66.8° (+1.0°) | 65.6° (+0.1°) |
| Fall 2020 observed (and anomaly) | 69.0° (+3.2°) | 66.7° (+2.4°) | 69.6° (+3.8°) | 67.2° (+1.7°) |
| 2005, 2008, 2016, 2017, and 2020 AVG. TEMP | 66.7° (+0.9°) | 64.9° (+0.6°) | 66.9° (+1.1°) | 65.7° (+0.3°) |
Warmer air temperatures mean that beach water temperatures may remain warm later into the fall than is typical. In a normal season, water temperatures are near or above 80 degrees through most of September and remain in the 70s into late October. Outdoor activities such as swimming, boating, and gardening could all benefit from warmer weather in the fall.
Average Fall Beach Water Temperatures
| September | October | November | |||||||
| 1-10 | 11-20 | 21-30 | 1-10 | 11-20 | 21-31 | 1-10 | 11-20 | 21-30 | |
| Wrightsville Beach, NC | 83° | 82° | 80° | 78° | 75° | 72° | 68° | 65° | 62° |
| Oak Island, NC | 82° | 81° | 79° | 76° | 73° | 70° | 66° | 63° | 61° |
| Myrtle Beach, SC | 83° | 82° | 78° | 76° | 73° | 69° | 65° | 62° | 59° |
> > > Check live water temperatures for Wrightsville Beach and Myrtle Beach...
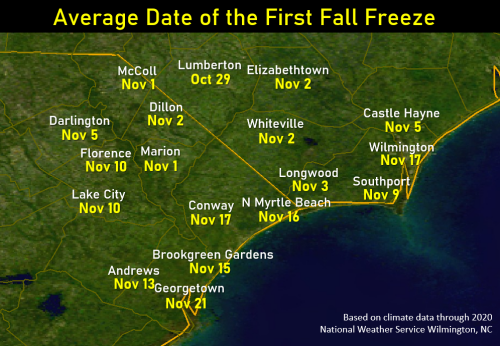
As Canadian cold fronts become more common later in the fall, the first freezing temperatures of the season typically show up in November. The exact date varies tremendously from year to year. Historically, the first freeze has occurred as early as the first week of October inland and as late as early January along the coast.
|
|
|
Due to climate change, the date of the first fall freeze has been moving an average of 1.8 days later per decade over the past 70 years. Combined with an earlier start to the growing season in spring, the average length of the freeze-free growing season has increased by almost three weeks since 1950. More details are available on our freeze climatology webpage at https://www.weather.gov/ilm/freeze
Rainfall
The precipitation outlook from the Climate Prediction Center shows "equal chances" for below, near, or above normal precipitation this fall. Analysis of the past five times when neutral ENSO conditions transitioned to La Niña during the fall shows a wide difference in rainfall from year to year depending primarily on local impacts from tropical storms and hurricanes. Outside of tropical cyclones, fall is typically one of the drier times of the year in the Carolinas with rainfall averaging only 2.5 to 4.0 inches per month in October and November.
| Wilmington | Lumberton | N. Myrtle Beach | Florence | |
| NORMAL FALL RAINFALL | 16.91" | 10.17" | 14.14" | 10.58" |
| Fall 2005 observed (and anomaly) | 27.44" (+10.53") | 6.91" (-3.26") | 21.21" (+7.07") | 7.14" (-3.34") |
| Fall 2008 observed (and anomaly) | 17.38" (+0.47") | 11.35" (+1.18") | 14.67" (+0.53") | 17.89" (+7.31") |
| Fall 2016 observed (and anomaly) | 24.74" (+7.83") | 20.84" (+10.67") | 27.93" (+13.79") | 23.51" (+12.93") |
| Fall 2017 observed (and anomaly) | 11.40" (-5.51") | 7.94" (-2.23") | 10.06" (-4.08") | 6.39" (-4.19") |
| Fall 2020 observed (and anomaly) | 21.25" (+4.34") | 18.39" (+8.22") | 15.22" (+1.08") | 12.81" (+2.23") |
| 2005, 2008, 2016, 2017, and 2020 AVG. RAIN | 20.44" (+3.53") | 13.09" (+2.92") | 17.82" (+3.68") | 13.55" (+2.97") |
In September 2005, Hurricane Ophelia drenched the coast with up to eight inches of rain in Wilmington. Tropical Storm Hanna in September 2008 brought widespread four to six inch rainfall with locally eight inches in Marion, SC. In October 2016, Hurricane Matthew produced record flooding across large portions of eastern South and North Carolina with 10 to 18 inches of rainfall measured. In September 2017, Hurricane Irma remained well south of the Carolinas but still brought up to five inches of rain to parts of the Grand Strand. And in 2020, the remnants of Hurricane Sally, Tropical Storm Beta, and Hurricanes Delta and Zeta brought flooding and above-normal seasonal rainfall totals across the area.
Our outlook for seasonal rainfall this fall has low confidence since the local impacts from tropical cyclones cannot be predicted with any accuracy at the seasonal time range. La Nina typically enhances the number of Atlantic tropical cyclones, so the potential of the Carolinas experiencing large rainfall amounts this fall is somewhat higher than normal.
Tides and Coastal Flooding
|
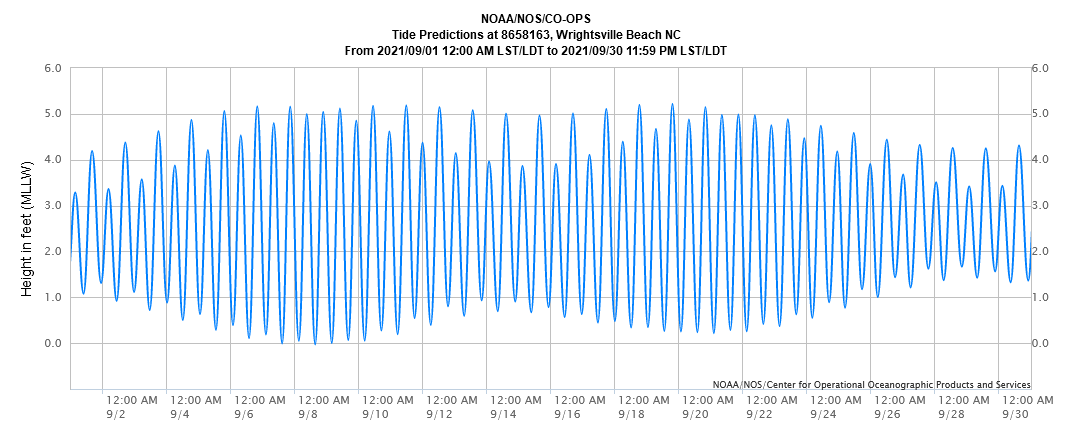
September 2021 tides |
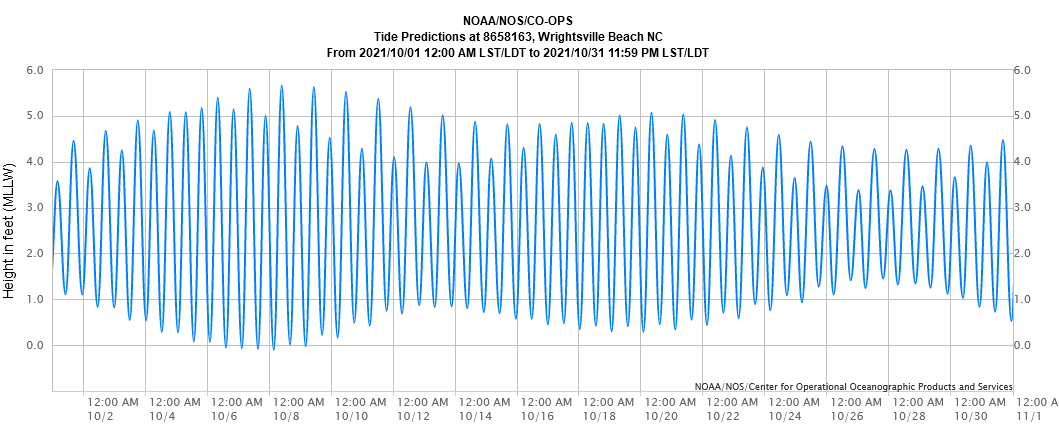
October 2021 tides |
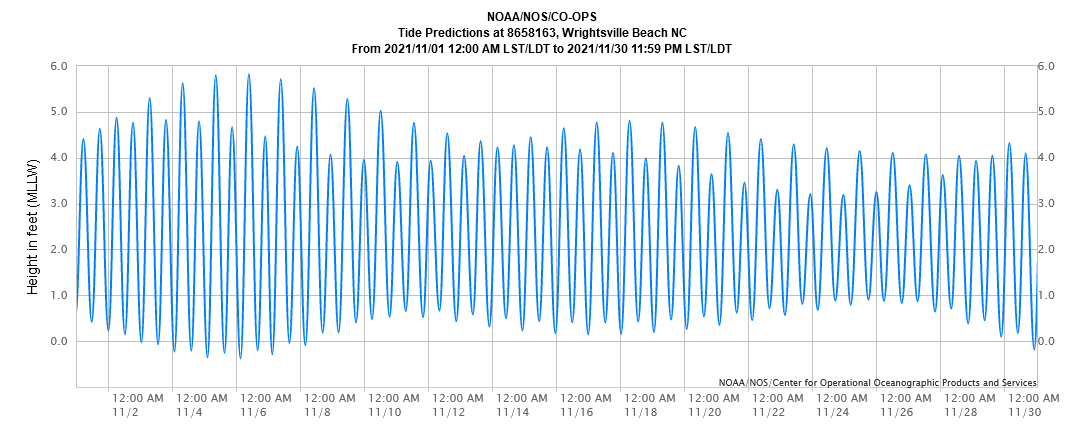
November 2021 tides |
Tides naturally vary throughout the month as the moon's phase changes, but the largest daily tidal ranges are associated with full and new moons. Full moons will occur this fall on September 20, October 20, and November 19; new moons will occur on September 6, October 6, and November 4.
If a tropical cyclone or a strong non-tropical low affects the Carolinas within a few days of a full or new moon, coastal flooding can more easily develop due to the higher astronomical high tides. The highest astronomical tides this fall will occur October 7-10 and November 4-7 during new moons.
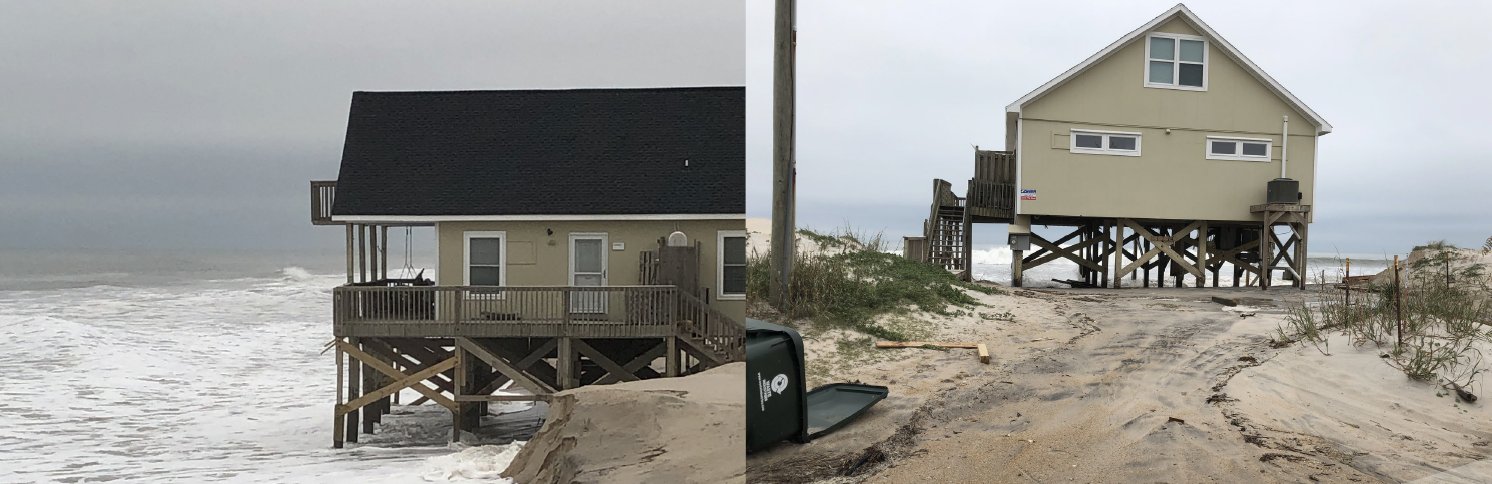
|
Coastal flooding and severe beach erosion occurred in Surf City, NC during a strong non-tropical storm on November 16-17, 2019. Photos courtesy of Surf City Emergency Management. |
Additional Links
Research and Page Author: Tim Armstrong
Last Updated: September 2, 2021


 Coastal Flood