
Damage in North Topsail Beach, NC due to storm surge from Hurricane Fran on September 5, 1996
(photo courtesy of NC Division of Marine Fisheries)
Hurricane Fran (1996) is the last major (Category 3+) storm to make landfall in NC (as of the time of this publication). To commemorate the 30th anniversary of this significant event we wanted to not only highlight Fran's storm surge and associated coastal flooding impacts but also how the NWS storm surge forecasts have changed over the last 3 decades.
As is typically the case with most storms, the greatest water levels occurred to the north of where Fran made landfall along the eastern Brunswick, New Hanover, Pender and Onslow County coasts. Unfortunately, the tide gage at Johnnie Mercers Pier on Wrightsville Beach, NC was not there at the time of the storm. However, water levels recorded at the tide gage along the lower Cape Fear River near downtown Wilmington (as shown in the image below) were quite interesting as the storm approached the coast and even as the storm moved well inland. The water levels (green line) actually fell below the astronomical tide (blue line) prior to the storm making landfall around 830 PM EDT on 9/5/96 (0030 UTC on 9/6/96) and then increased rapidly during landfall. After a brief lull in water levels as the calmer winds in the eye of the storm passed through, another rise in water levels occurred as high astronomical tide approached due to continued southerly winds up the river. Fortunately, the highest storm surge (i.e., difference between the observed water levels and the astronomical tides; indicated by purple line on image) occurred closer to the time of low astronomical tide, which limited the total water levels and the resulting tidal flooding. This is a great example of how critical the timing of the storm surge is with respect to the astronomical tides and why the NWS storm surge forecasts are "reasonable worst case" scenarios (i.e., greatest storm surge occurring during high astronomical tide) to assist with planning and preparedness!
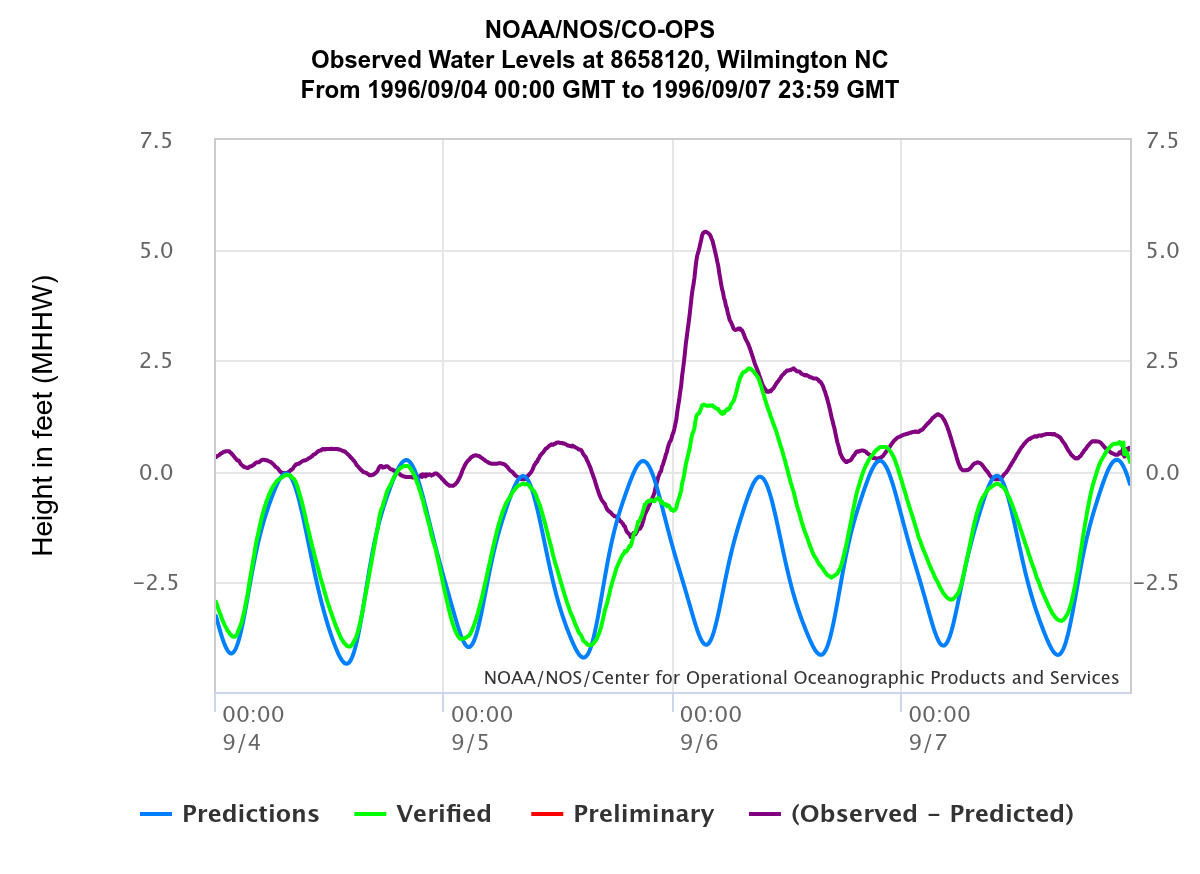
Water level observations (relative to Mean Higher High Water) from the
National Ocean Service tide gage along the Cape Fear River near downtown Wilmington
The NWS forecasted storm surge differently back in 1996 compared to how we do so today. Prior to 2009, the NWS forecasted the true storm surge (i.e., just the extra water produced by a storm's winds on top of the astronomical tide). However, this method's limitation was that it didn't convey how deep the ocean water could get over land. It required people to know the astronomical tide levels, when the peak surge was expected, and what those "storm tide" levels would mean in terms of the depth of flooding at their location. To help simplify messaging, the NWS began improving the communication of the storm surge hazard starting in 2009 by conveying storm surge as "inundation", or the depth of water "above ground level" (AGL). For example, a storm surge forecast of 5 feet in your area means that saltwater could reach 5 feet deep above the ground somewhere in that area. However, when it comes to planning and preparedness, it's important to remember that even if your particular house is raised above the ground to a height higher than the forecasted depth of storm surge inundation in your area, your house could become an "island" cut off from emergency officials if nearby roads at lower elevations flood. In addition, it's important to keep in mind that powerful waves on top of the storm surge, along with heavy rain, can increase the flooding and these variables are not accounted for in storm surge forecasts.
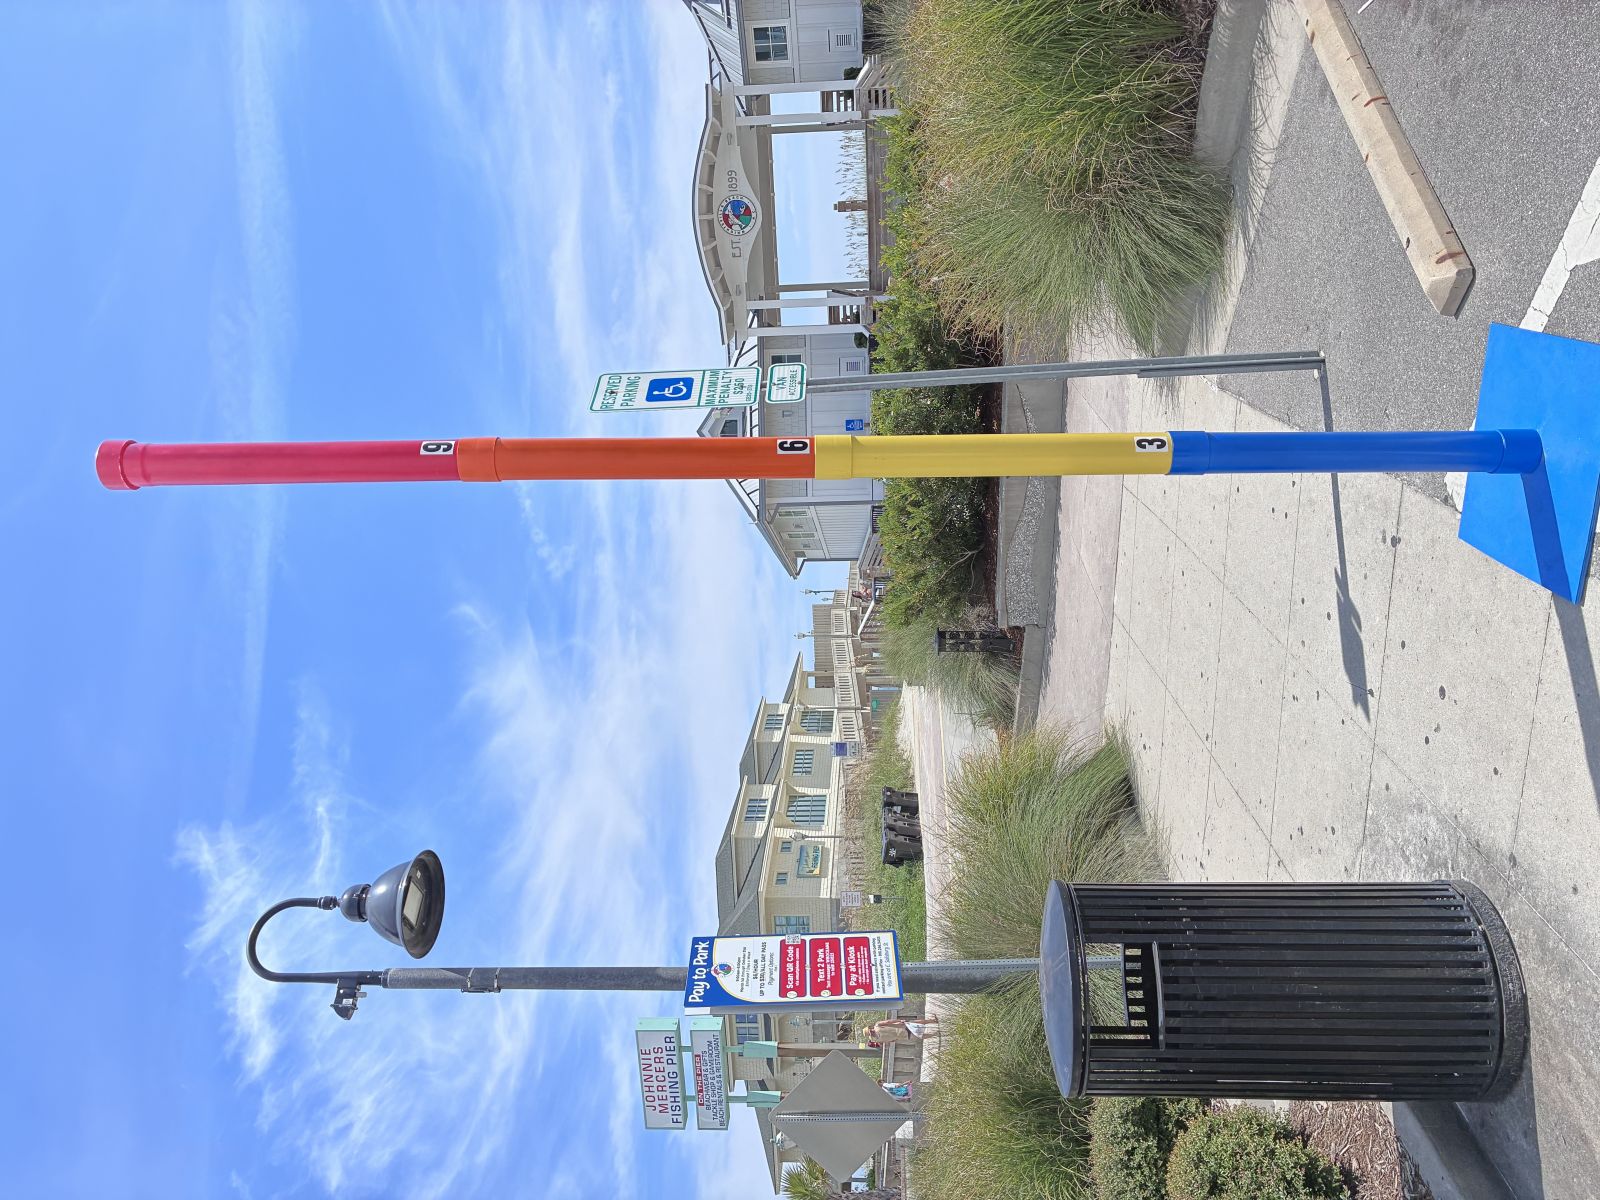
To highlight Fran's storm surge, as well as how we now forecast storm surge, NWS Wilmington developed a "storm surge pole" (shown below) for outreach purposes to help convey what NWS storm surge forecasts mean in terms of inundation (i.e., depth of water above ground level). As you can see from the image below, the yellow portion of the pole represents 3-6 feet of storm surge inundation, the orange portion represents 6 -9 feet of inundation and the red portion represents 9+ feet of inundation. These colors actually match those used in the NHC's Potential Storm Surge Flooding Map (see below for more information). You can learn more about our storm surge outreach tool via the media interviews we conducted on August 25, 2026 with WECT and WWAY. We also visited a location farther inland (Pages Creek near Bayshore Dr. in the Bayshore community) to show about how deep the surge got in this area during Fran and also how storm surge can impact areas well away from the immediate coast.
Inundation from storm surge is the biggest threat to life and property in tidal areas, especially along the immediate coast, and is what largely drives evacuation decisions by state/local officials. However, surge can affect areas even many miles inland away from the immediate coast, especially in the low-lying tidal portions of southeast NC and northeast SC (as shown in the maps below). Check out the National Hurricane Center's (NHC) storm surge risk maps to help determine your location's vulnerability to storm surge inundation. You can also check with your county's emergency management office to determine if you live in a designated flood zone and what your official evacuation routes are. Visit our hurricane preparedness page to learn more hurricane preparedness tips.
 |
 |
| Storm surge risk map for a "worst case" Category 5 hurricane across southeast NC. Red areas represent the potential for 9+ feet of water above ground level and blue areas represent the potential for less than 3 feet of water above ground level. | Storm surge risk map for a "worst case" Category 5 hurricane across northeast SC. Red areas represent the potential for 9+ feet of water above ground level and blue areas represent the potential for less than 3 feet of water above ground level. |
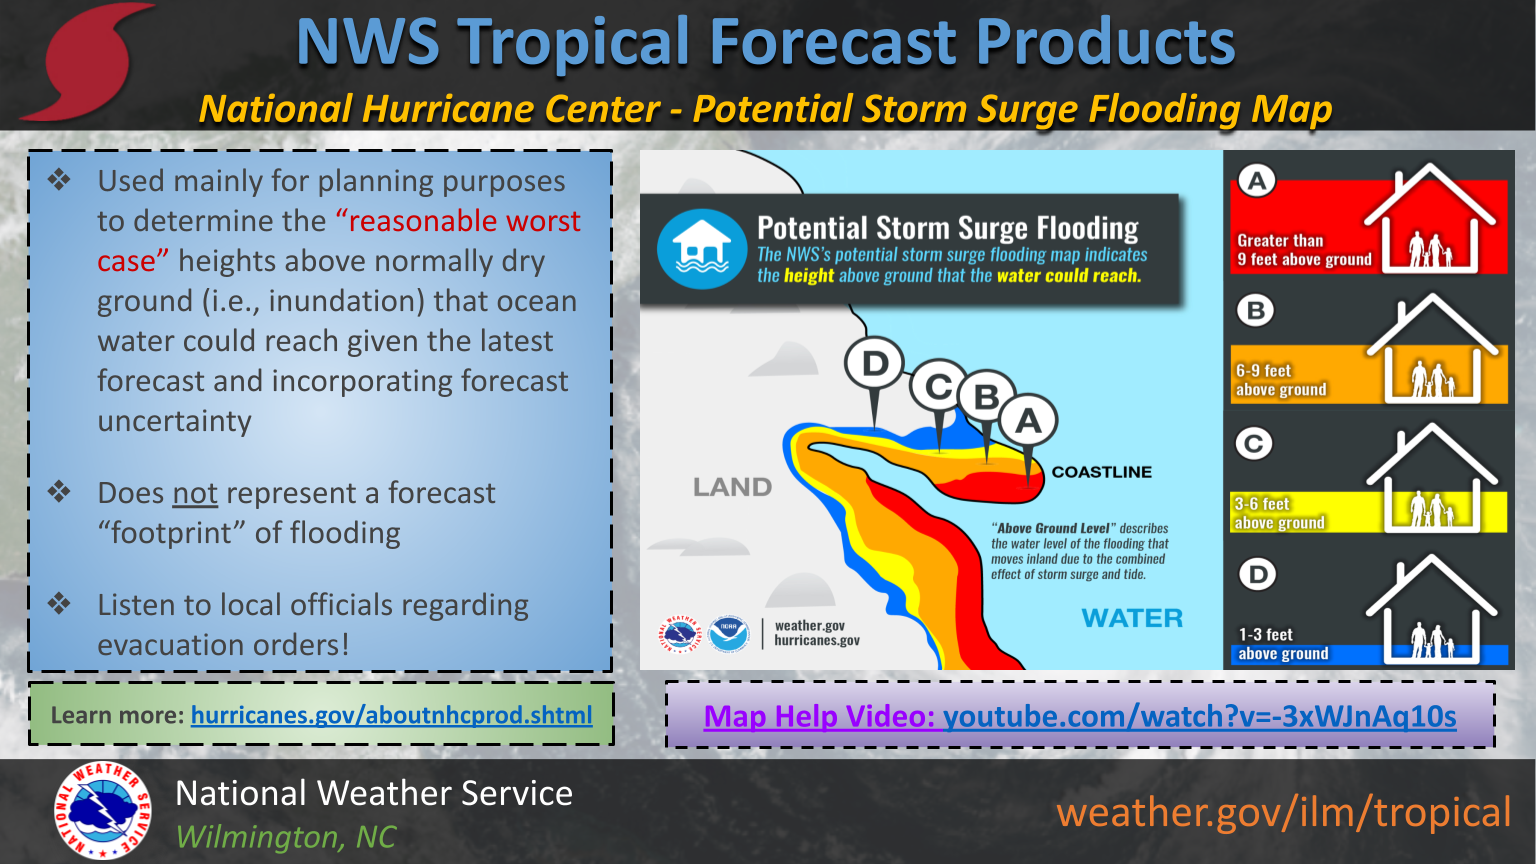
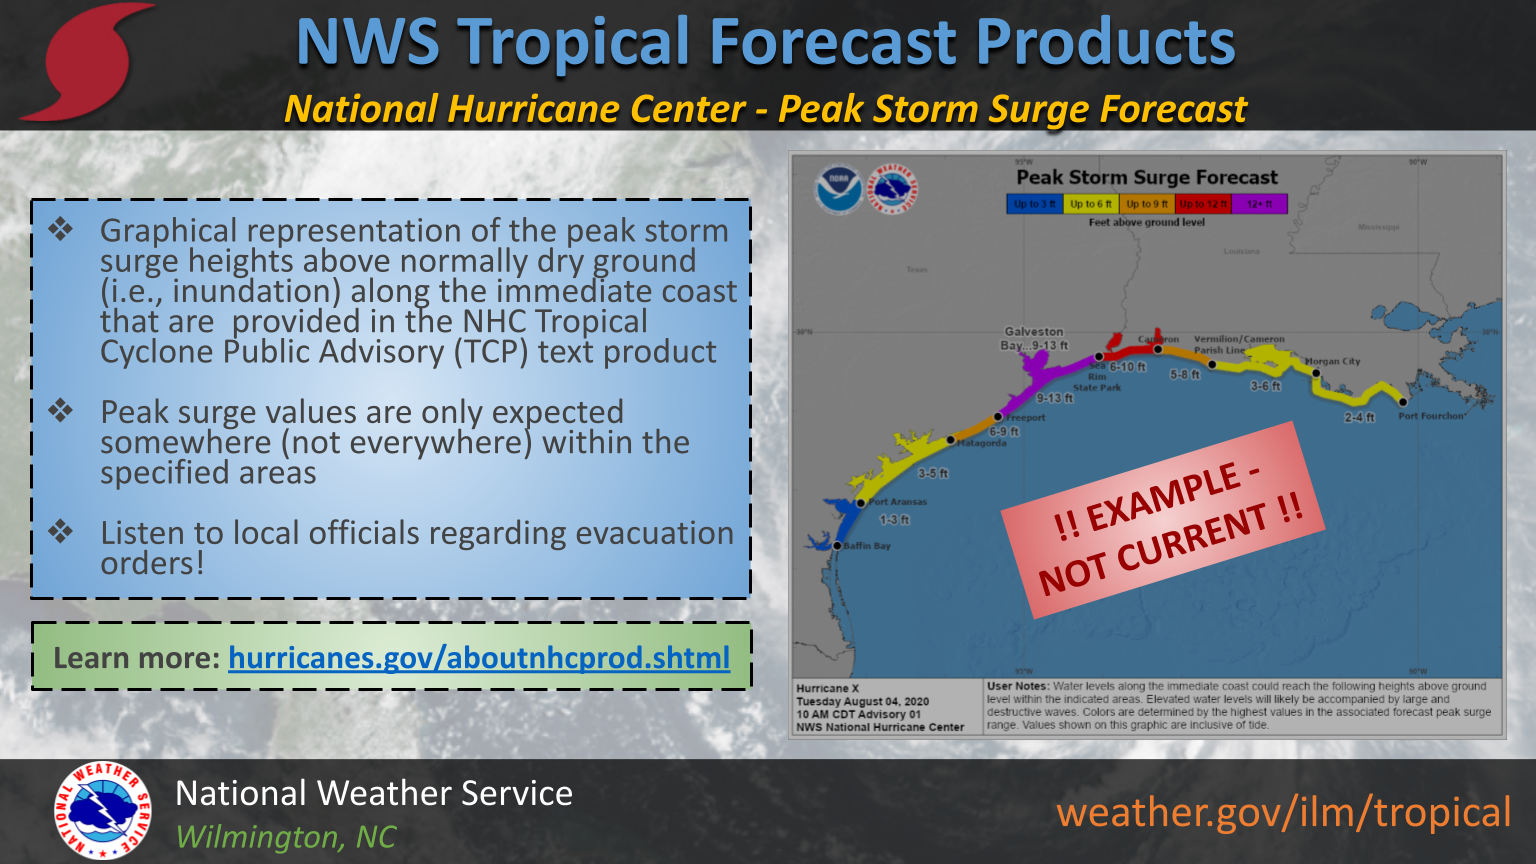
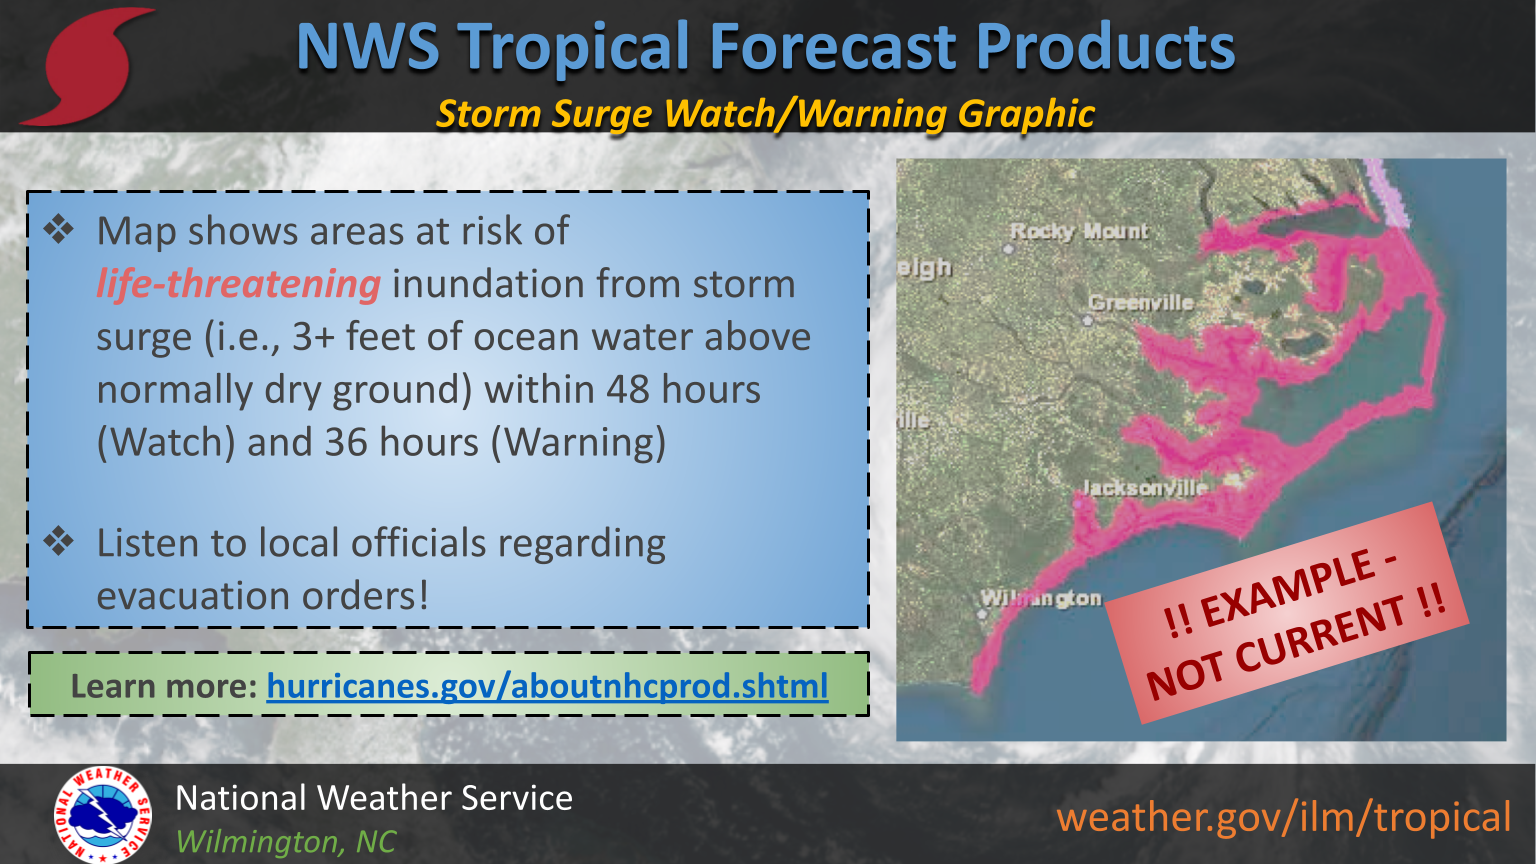
It's critical to understand the various NWS tropical forecast products and how they are best used to make critical preparedness decisions. Regarding the storm surge hazard there are several products you can use to determine if your area is at risk and how deep the water could get above ground level. In the early stages of a storm, the NHC's Potential Storm Surge Flooding Map can be used to determine the "reasonable worst case" inundation (top image). The Peak Storm Surge Forecast graphic shows the highest storm surge inundation expected somewhere (not everywhere) along broad stretches of coast (middle image). Once confidence increases in storm surge inundation of 3+ feet, Storm Surge Watches (within 48 hours) and Warnings (within 36 hours) will be issued (bottom image). Visit this page from the National Hurricane Center for more information on these products.
NHC's Potential Storm Surge Flooding Map- shows "reasonable worst case" storm surge above ground level
|
NHC's Peak Storm Surge Forecast Graphic- shows peak storm surge expected above ground level along broad stretches of coast
|
NWS Storm Surge Watches & Warnings- issued for areas at risk for life-threatening storm surge of 3+ feet above ground level
|
Page Last Updated: September 19, 2026 by Bob Bright



 Radar
 Current Weather
 Rivers & Lakes
 Satellite
 Forecast Maps
 Hour by Hour Forecast
 Tropical Weather
 Graphical Hazards
 Weather Hazard Briefing
 Forecaster's Discussion
 Text Bulletins
 Climate
 Skywarn
 NOAA Weather Radio
 Sunrise/Sunset
 Marine Forecasts
 Beach & Surf
 Coastal Flood
 Follow us on X
 Follow us on Facebook
 Follow us on YouTube
 ILM RSS Feed
