Drought Information
The Drought Information Statement is a summary of the current state of the drought, including precipitation deficits, local impacts, outlooks, and other information. A statement is issued when severe drought (D2) is occurring within the NWS Houston/Galveston area of responsibility.
Current Drought Indices
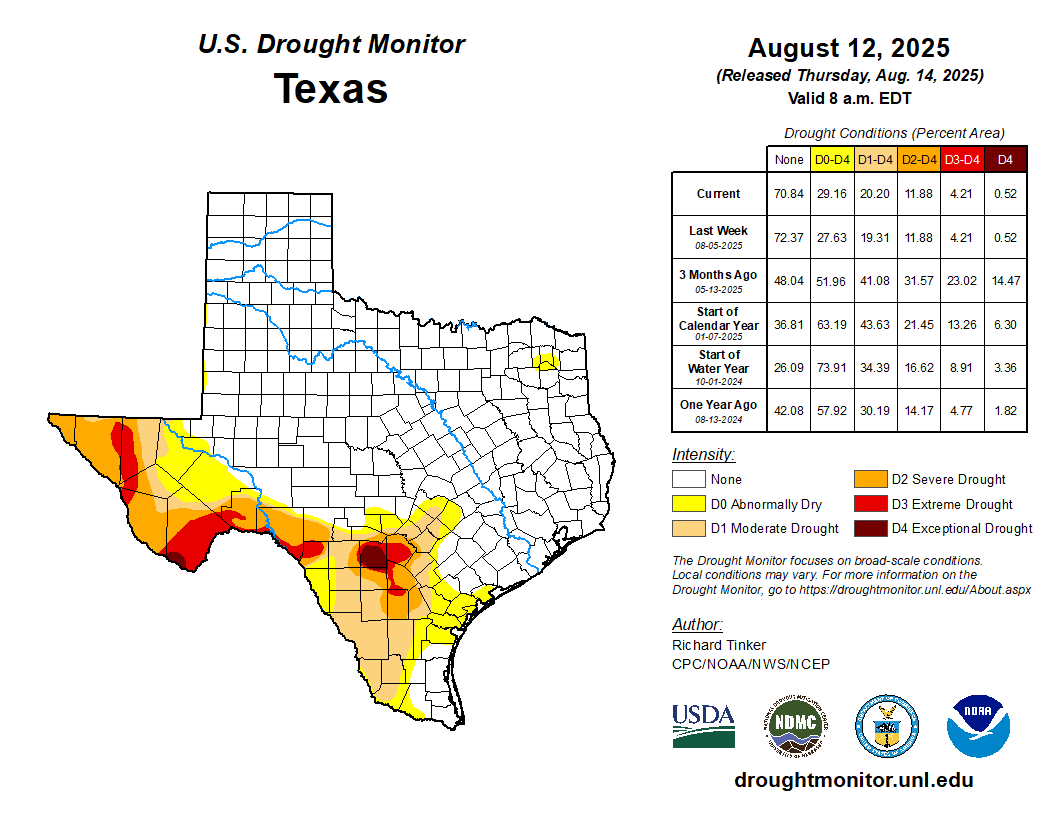
The U.S. Drought Monitor was established to assess drought severity in a subjective but uniform manner. Since 1999, various agencies, including those within the U.S. Department of Agriculture (USDA) and the National Oceanic and Atmospheric Administration (NOAA), have pooled their expertise with that of academia and local interests to more accurately categorize drought. Incorporating the input of all these entities, the National Drought Mitigation Center (NDMC) issues a weekly assessment of drought severity on a national scale. Click the image below to enlarge, or click here for a closer look at Texas.
The Palmer Drought Severity Index measures primarily meteorological drought (precipitation versus normal). Click here for an image.

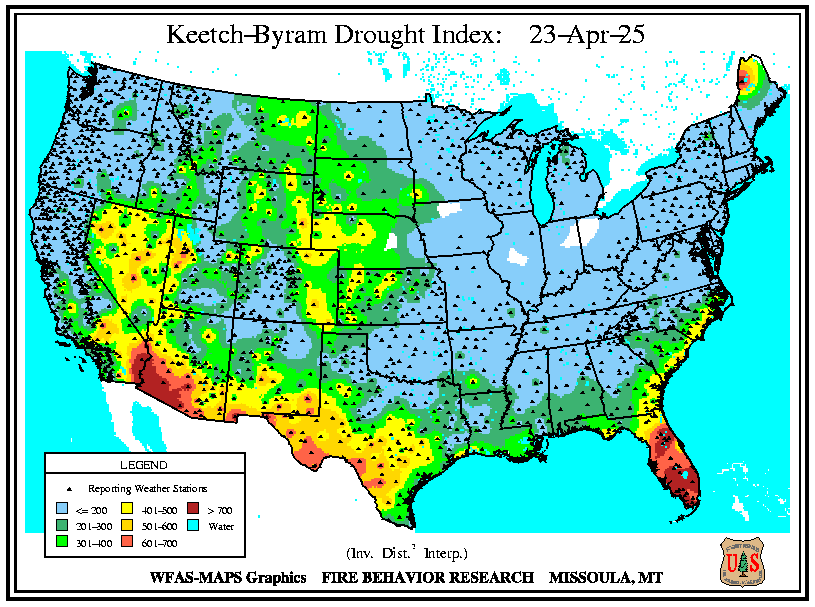
The Keetch-Byram Drought Index is a drought statistic specifically designed to assess fire danger. Click here to zoom in on Texas (interactive map too), or click here to enlarge the national map.
Data and Other Information
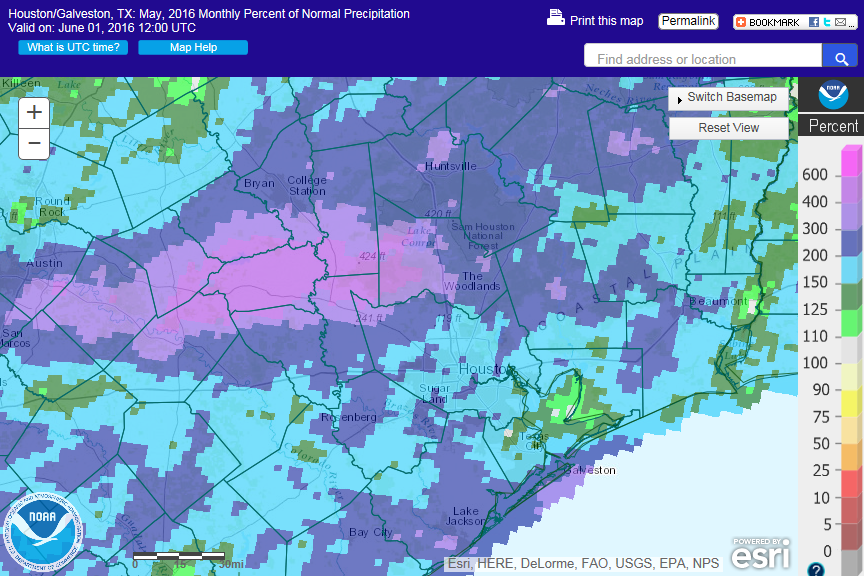
A complete suite of radar-estimated precipitation data is now available through the National Weather Service's Advanced Hydrologic Prediction Service. Images are available for month-to-date and year-to-date totals, among other selectable time frames. Menus below each image allow for user-customized data, including departure from normal. (Click the image below to access images tailored to Southeast Texas.)
![]() Current River and Stream Flows (USGS)
Current River and Stream Flows (USGS)
The USGS keep track of the latest stream flows at river guages for area rivers, streams and bayous. Generally, below normal stream flows can be expected during drought conditions.
![]() Drought Impact Reporter from the National Drought Mitigation Center
Drought Impact Reporter from the National Drought Mitigation Center
Drought severity is inherently linked to the impacts of the drought. Such impacts include agricultural issues, hydrologic deficits, increased fire danger, and other economic and social consequences. These impacts are not easily quantified with simple statistics.
The National Drought Mitigation Center developed the Drought Impact Reporter as a database for reported drought impacts. The impacts are classified by category, with the number of reports emphasizing a drought's significance without attributing specific statistics to the reports. (Click on a county of interest for further information.)
![]() Office of the Texas State Climatologist
Office of the Texas State Climatologist
This site has updated information on any ongoing drought across Texas. Users can also load maps of drought indices such as the Standardized Precipitation Index (SPI) and look at percent of normal precipitation. Information on the impacts of the drought and other press releases can be found on the site.
Outdoor burn bans are established by county officials. The Texas Forest Service compiles this information and provides the map below. (Click to enlarge.)

Forecasts and Drought Outlooks
This outlook from the Climate Prediction Center (CPC) predicts the future evolution of drought, including the potential for development or relief. (Click map to enlarge.)
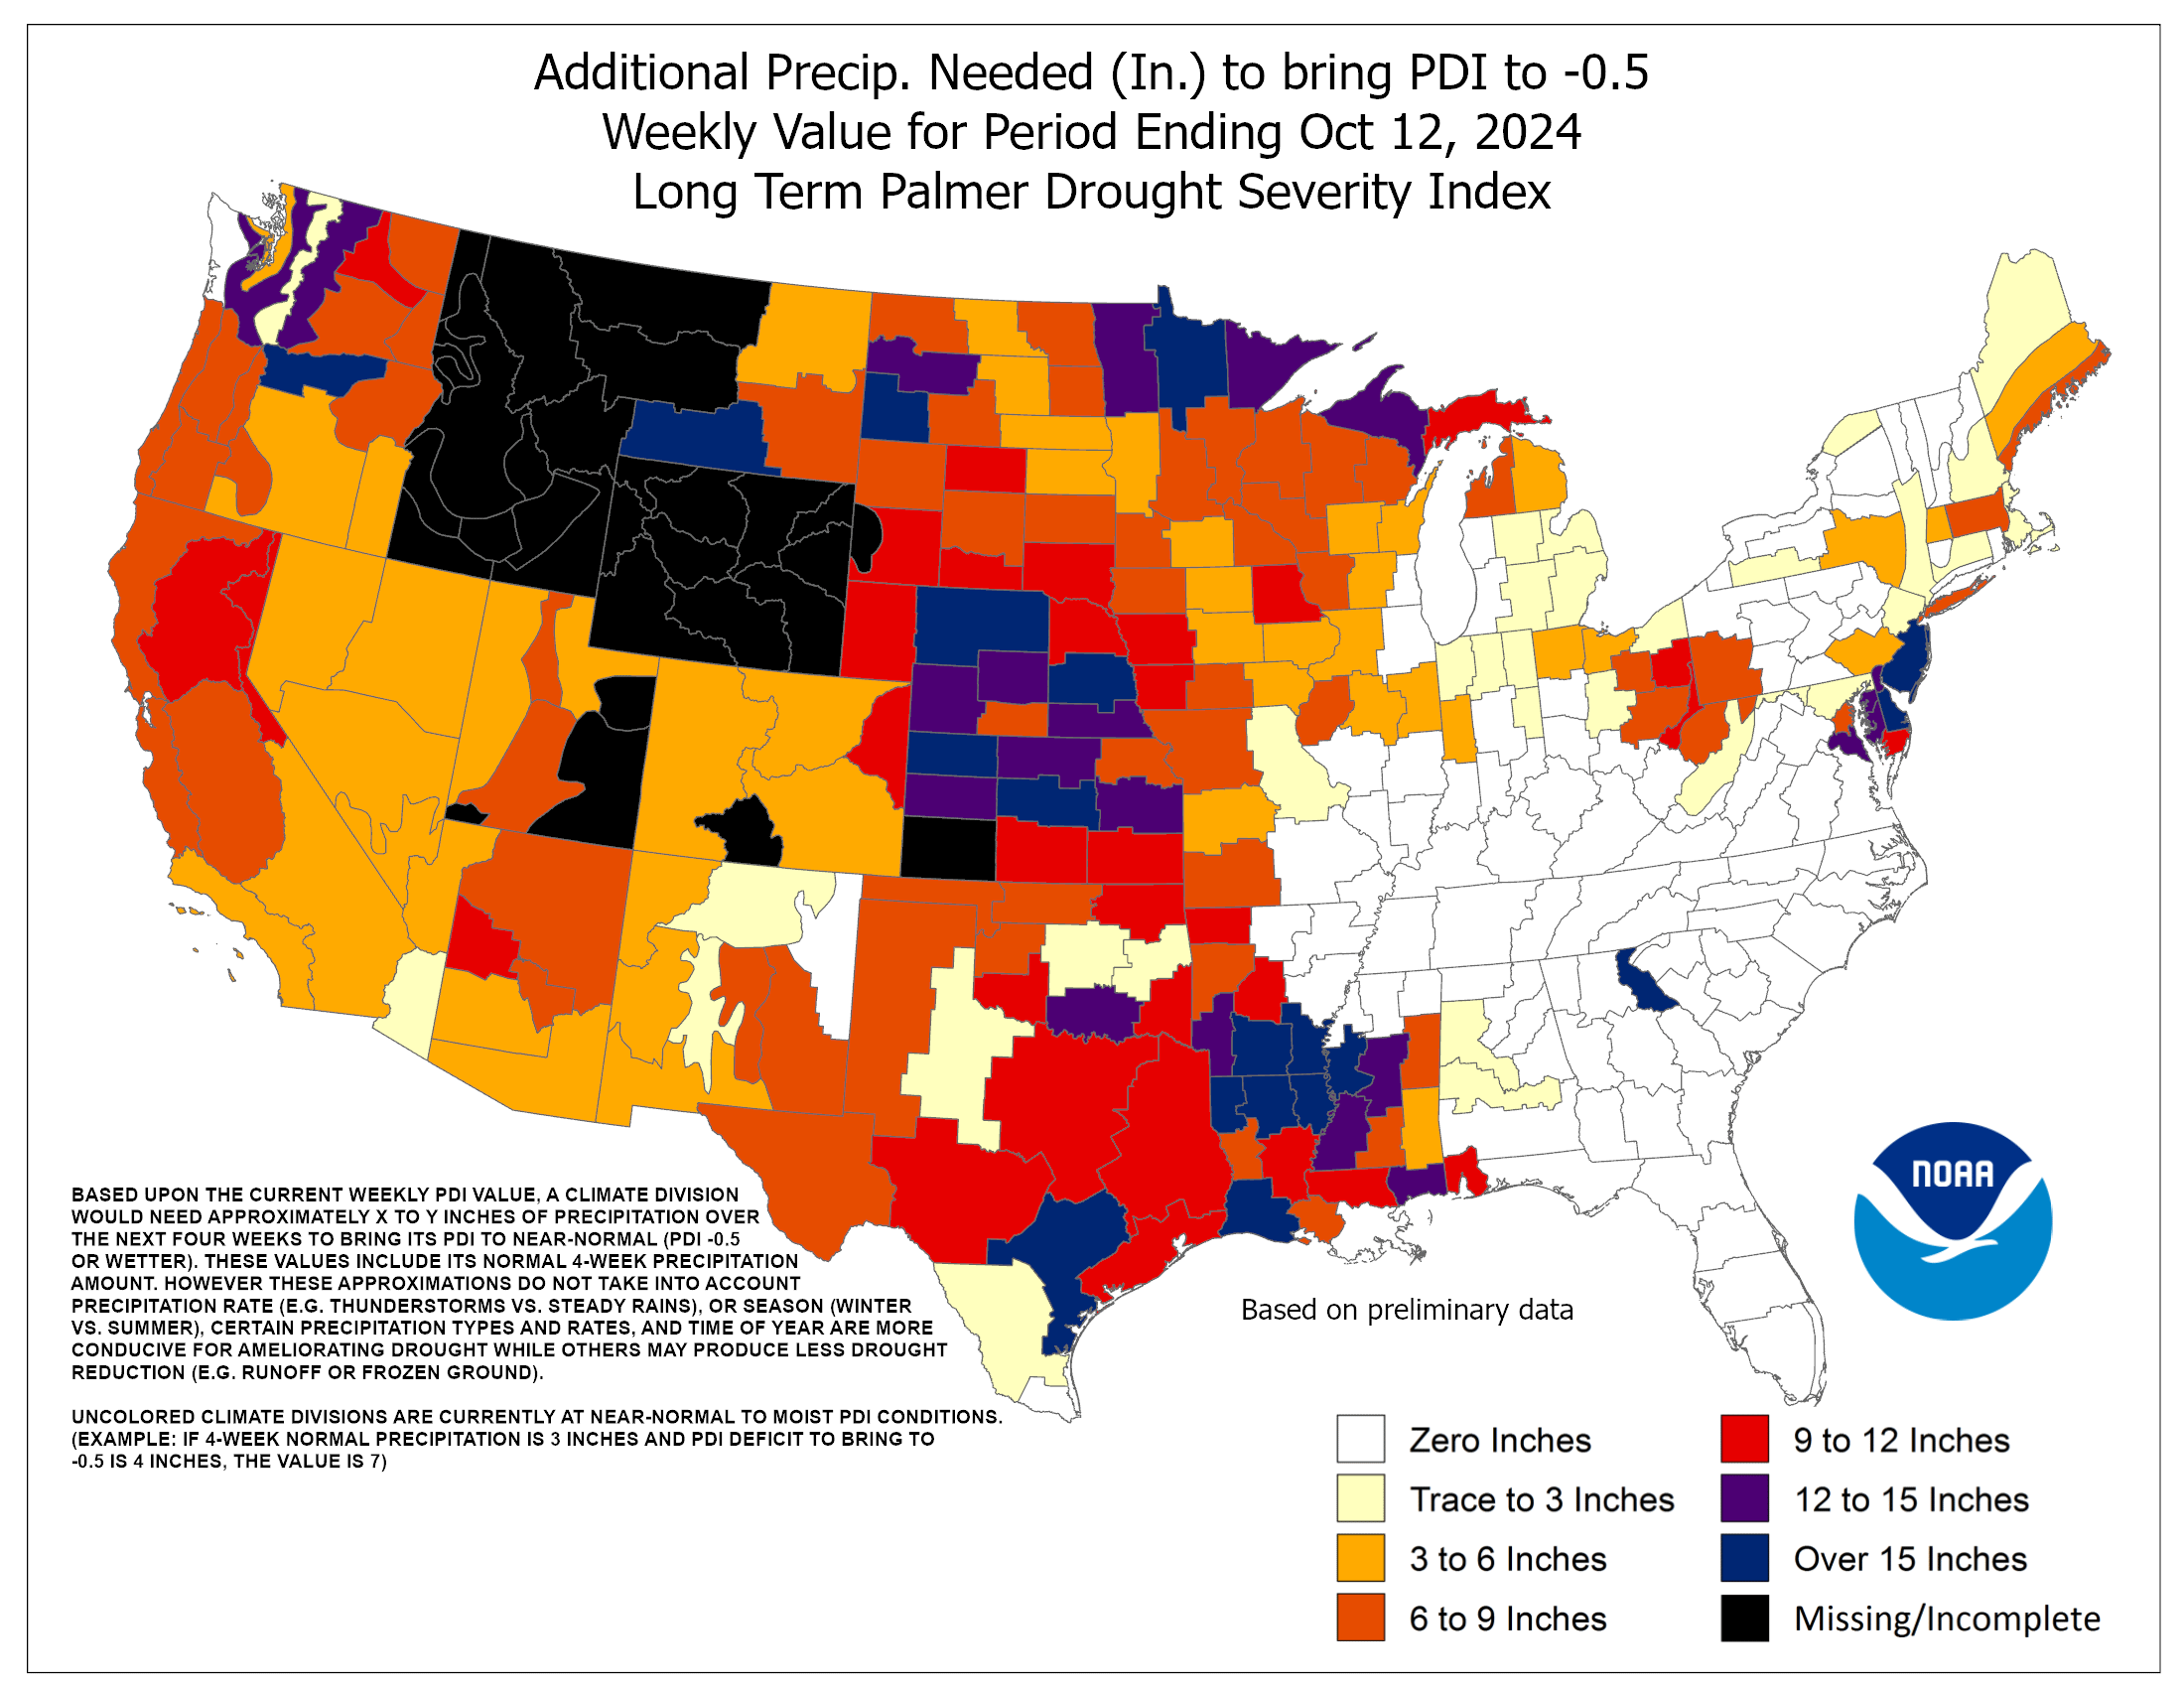
For areas currently in drought, the image below shows the amount of precipitation needed to return to the "near normal" Palmer category. (Click to enlarge.)
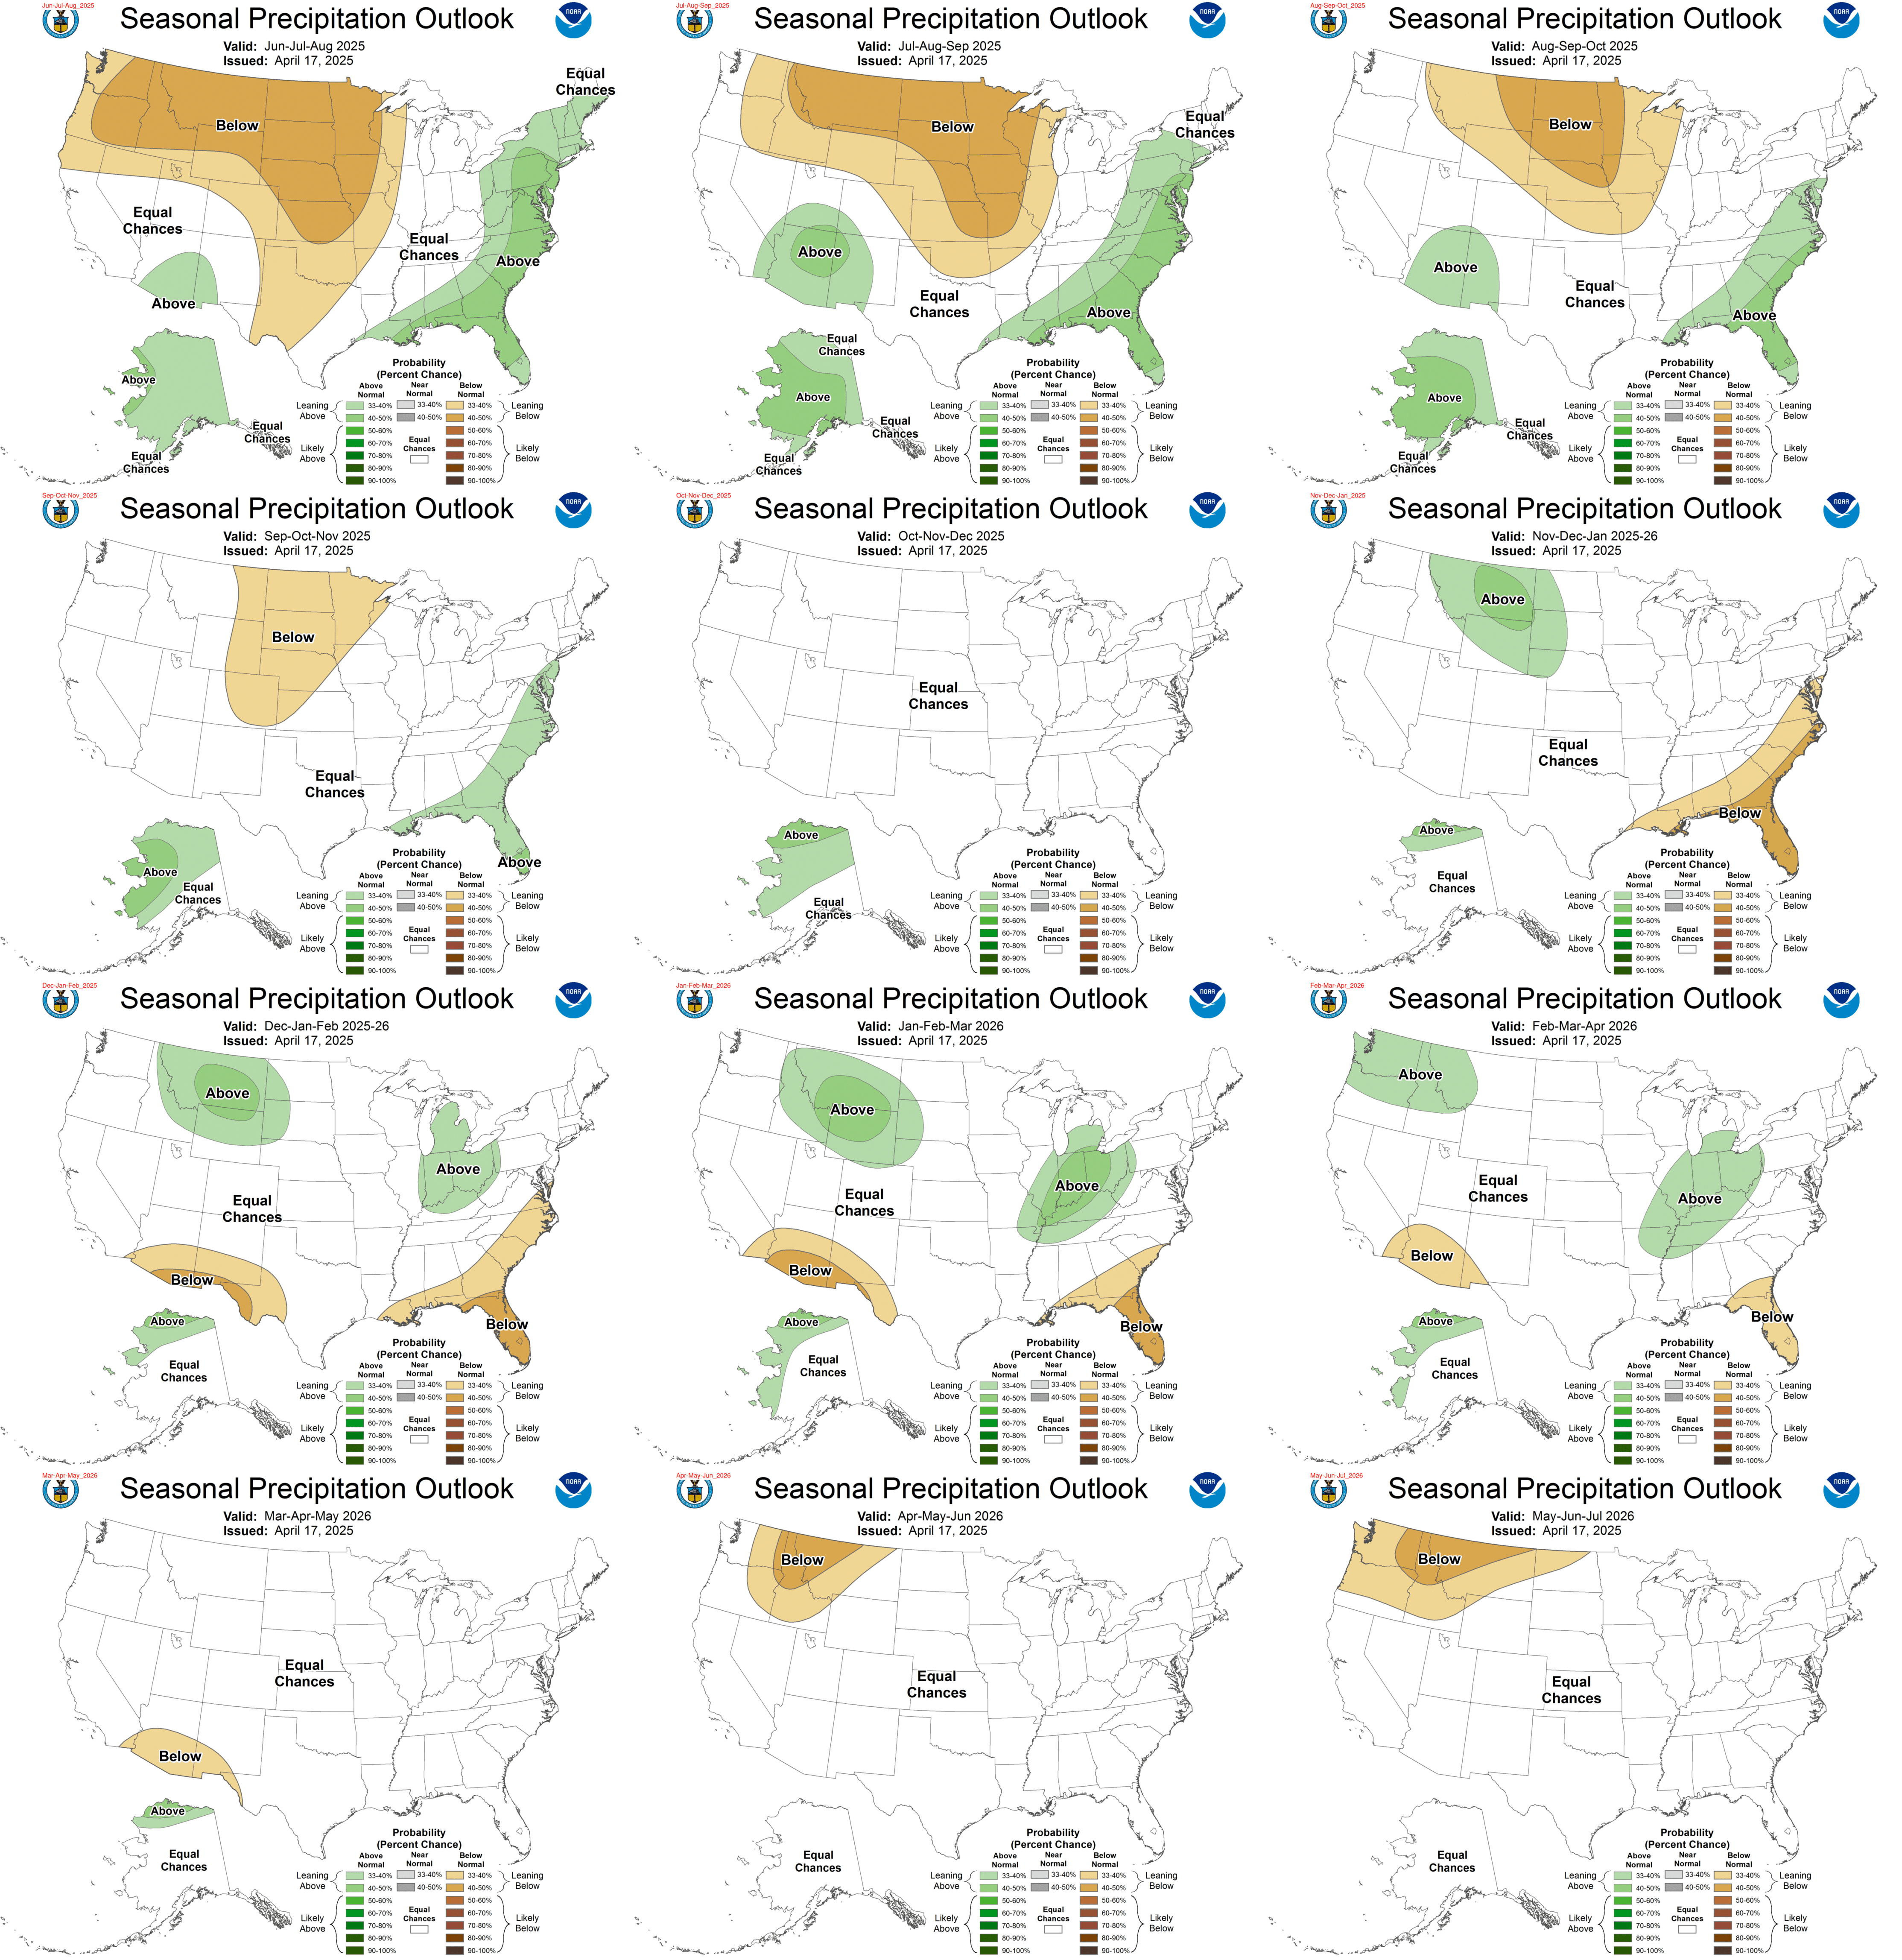
![]() What Can We Expect the Next Several Months?
What Can We Expect the Next Several Months?
CPC's 3-month outlooks present the likelihood of receiving a precipitation total that differs significantly from normal. For precipitation, green areas denote parts of the country with an increased chance of being in the wettest tercile, or the wettest third of historical data. Similarly, brown areas denote parts of the country that are projected to have an elevated chance of being in the driest tercile. Where neither color is shaded, CPC has concluded that there is no strong signal to determine an accentuated chance of being in either the driest or wettest tercile. This does not mean that near normal precipitation is expected, but simply that the 3-month period is just as likely to be in the wettest tercile as it is to be in the driest tercile.
Long Term Outlooks (clickable) 6-10 Day Temperature 8-14 Day Temperature One Month Temperature Three Month Temperature
6-10 Day Precipitation 8-14 Day Precipitation One Month Precipitation Three Month Precipitation
Quick Links
![]() National Integrated Drought Information System
National Integrated Drought Information System
![]() National Drought Mitigation Center
National Drought Mitigation Center
![]() Water Restrictions (from TCEQ)
Water Restrictions (from TCEQ)


