
Scattered thunderstorms with severe gusts, hail and a tornado risk are possible near a cold front from the Ohio Valley to the Mid-Atlantic tonight. Tropical Storm Bertha is expected to bring tropical storm conditions to portions of the Gulf Coast from the panhandle of Florida into Louisiana through Wednesday. Read More >
| Font: A A A | Advanced Options | About This Page |
| Unit of Measurement |
Number of Hours to Retrieve |
Page Headers |
See Chart |
Permanent Chart |
Gather Historical Data |
Observation Type |
Show Only Hourly Data |
Font Size |
Precip. View |
|
|---|---|---|---|---|---|---|---|---|---|---|
| Standard (w/mph) Metric Standard (w/kts) |
Standard Minimal None |
On Off |
On |
Tabular METARs (NWS/FAA Only) |
Yes No |
Full Standard Measured |
|
|||
By default, this page will load with all station data collected in the last 72 hours, with the station identifier as the "site" variable in the URL
Example: https://www.weather.gov/wrh/timeseries?site=kslc
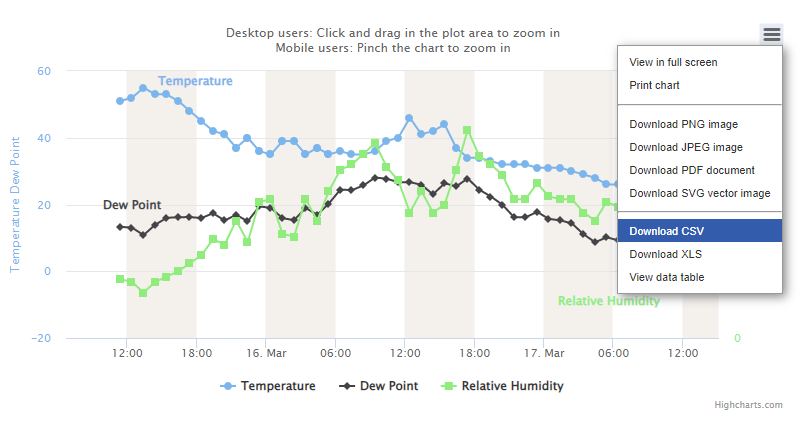
If the station reports Temperature, Relative Humidity, or Dew Point Temperature, a chart will be available with those elements to examine.
Below the chart, a table will appear with 72 hours worth of data from that station. Hovering over certain headings will reveal a "magnifying glass" cursor. That means that if you click on that heading, data for that element will load into the chart. Note: Data availability varies by station.
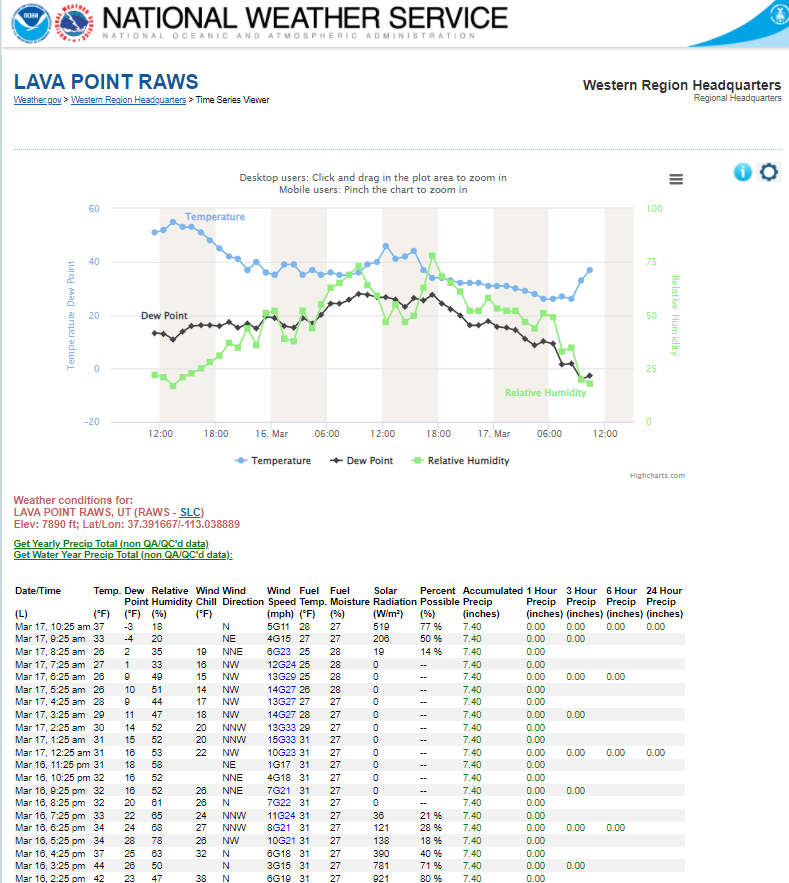
The default station chart contains Temperature, Dew Point Temperature, and Relative Humidity. If a station has not reported any of those elements during the requested period, no chart will be available.
A chart other than the default may be selected by clicking the "Advanced Options" button and selecting an option from the "Permanent Chart" drop down menu.
The chart has a limitation where 1000 data points per element can be displayed. For longer duration datasets, with multiple reports per hour, this will exceed the charting capability. Therefore, data will be trimmed when it exceeds 1000 datapoints, and will then display every 2nd, 3rd, etc point. If you require high resolution charts, the "Historical Data" option will be helpful.
To view charts for additional elements, using a mouse, move the cursor over the element headings. If a "magnifying glass" cursor appears, it means that if you click on that heading, data for that element will load into the chart. See image below.
The following weather elements are available for viewing in a chart. Note: Data availability varies by station.
|
|

Clicking the "Settings" icon will open an area where you can select different viewing parameters.
Certain elements (wind, visibility and clouds) are color coded based on long standing core partner requests, others are colored for convenience:
| Element | Color | Criteria |
|---|---|---|
| 6/24 Hour High temperatures | Red | |
| 6/24 Hour Low temperatures | Blue | |
| Precipitation | Green |
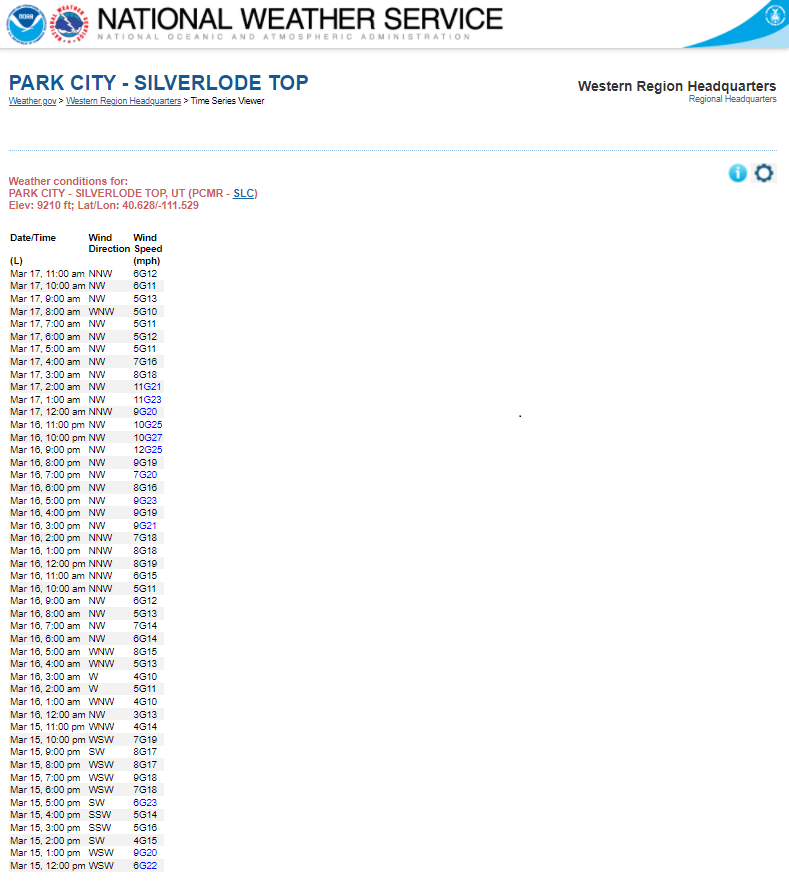
| Wind Speed | Black | < 20 mph |
|---|---|---|
| Blue | < 40 mph | |
| Red | < 58 mph | |
| Magenta | >= 58 mph |
| Wind Gusts | Black | < 11 mph |
|---|---|---|
| Blue | < 12 mph | |
| Red | < 13 mph | |
| Magenta | >= 13 mph |
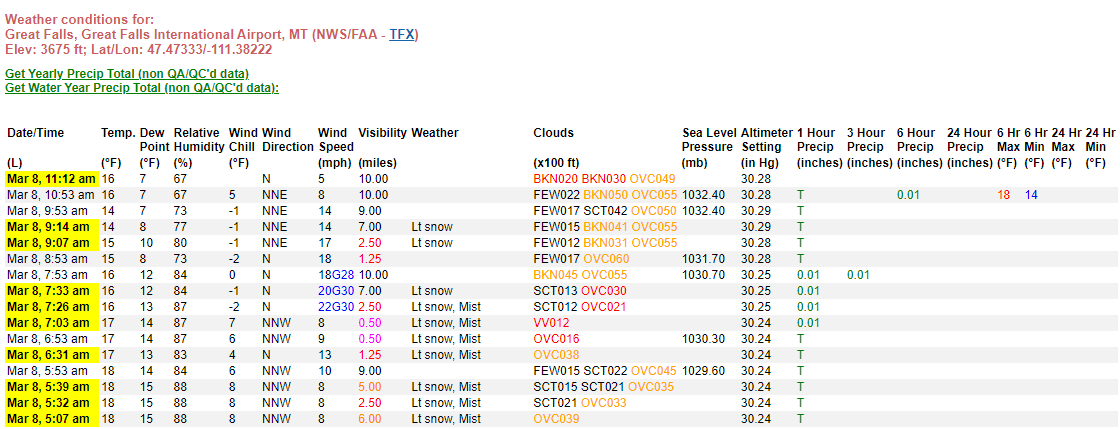
| Visibility | Black | >= 7 miles |
|---|---|---|
| Orange | < 7 miles | |
| Red | <= 3 miles | |
| Magenta | <= 1 mile |
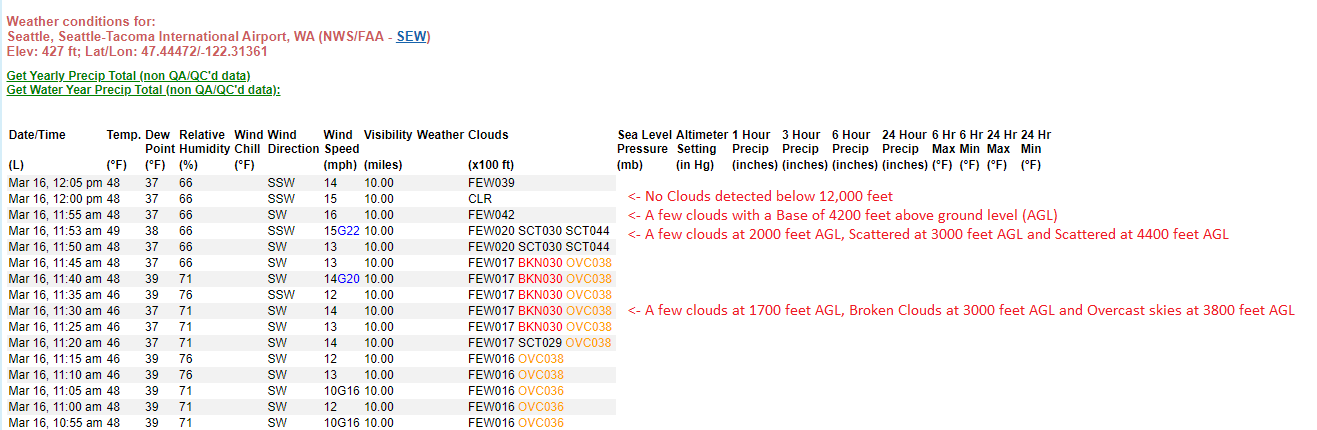
| Clouds | Black | > 8000 ft |
|---|---|---|
| Orange | <= 8000 ft | |
| Red | <= 3000 ft | |
| Magenta | <= 1000ft |
Cloud height sensors can measure clouds up to 12,000 feet above the ground, when the cloud is directly above the sensor.
This limitation can result in "Clear" conditions being reported, when clouds are above 12,000 feet.
At major airports, this information can be augmented by a trained observer, who can also determine heights greater than 12,000 feet.
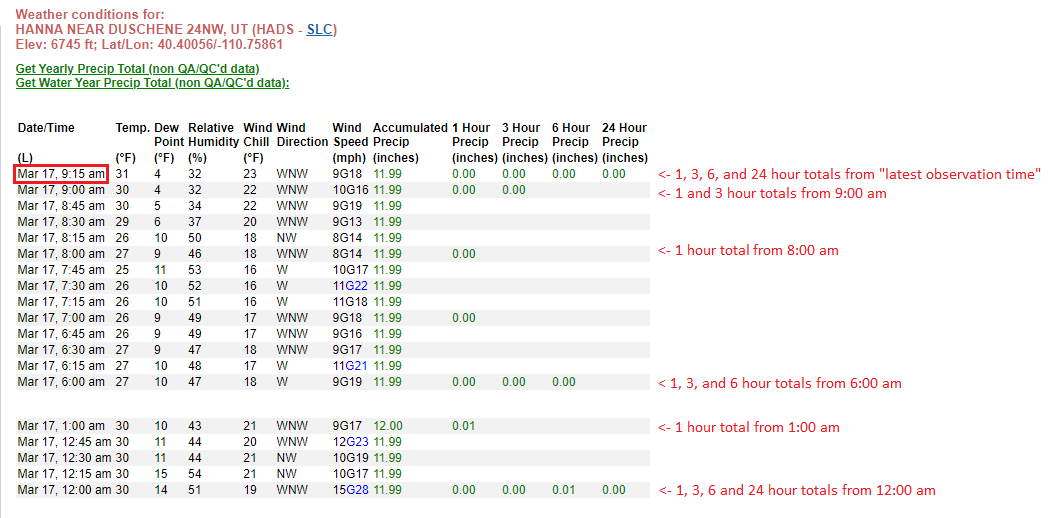
Precipitation (precip) can be measured 2 different ways: Using a weighing mechanism, or by using a tipper.
Precipitation is reported in 5, 10, 15, 30, or 1 hour increments. Values for 3, 6, or 24 hour precipitation are extrapolated from those reports, and are displayed hourly, or every 3, 6, or 12 hours (for 24 hour precip).
If a station reports precipitation, the "top line" of data will always include precip over the last 1, 3, 6, and 24 hours, relative to that time.
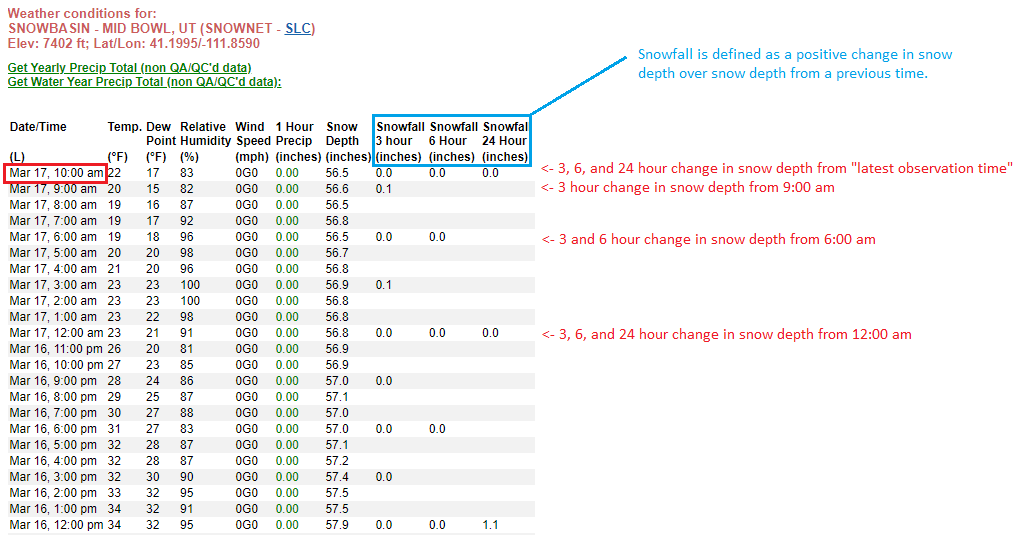
Snow depth is generally measured by probes mounted above a surface. They measure the distance between the probe and a surface. As snow accumulates or melts/blows away, that measurement will change.
"Snowfall" calculations are made by taking the snow depth measurement at a given time, and subtracting the snow depth from 3, 6, or 24 hours previous to time the current snow depth value was recorded. Negative values are not recorded. *** Due to wind, snowmelt and compression, this is not always an accurate measurement.
If a station reports snow depth, the "top line" of data will always include snowfall over the last 1, 3, 6, and 24 hours, relative to that time.
Data can be downloaded by clicking the 3 lines in the upper right corner of the chart, and clicking "Download CSV or Download XLS"
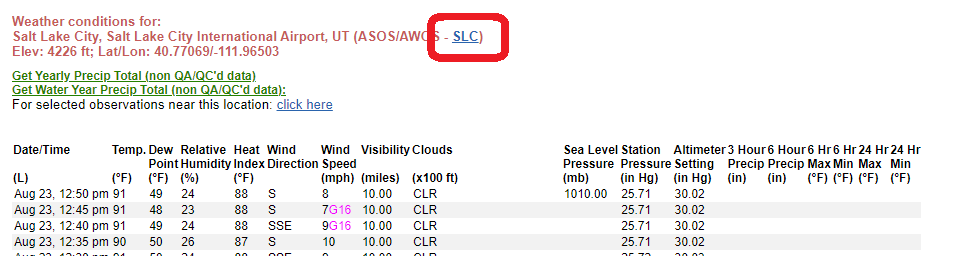
If you notice data inconsistencies, or errors with this page, do not report those to us. Data is provided to this page through many different entities, and the maintainers of this page are not in contact with those entities. Your best course of action with regard to data accuracy may be to contact the local NWS office where this station lies. In some cases, they MAY be able to contact the responsible party. Refer to the image below. The NWS office under which the station is installed is available by clicking the 3 letter identifier, and finding their contact information.
Aside from issues referenced above, please provide feedback, or report issues with this page by sending email to wr.web.support@noaa.gov
If you're reporting an issue, it's helpful if you:
Current Known Issues:
Things We Are Exploring:

