
Dangerous and extreme heat will remain across portions of the southern U.S. this week. A heat wave over the Southwest U.S. will intensify this week, peaking and expanding into the Intermountain West and northern High Plains this weekend. Multiple rounds of thunderstorms will produce heavy to excessive rainfall with significant flash flooding across portions of southern New England today. Read More >

For Moderate/High/Extreme hazard risk, more detailed information will be provided via emailed briefings to core partners.
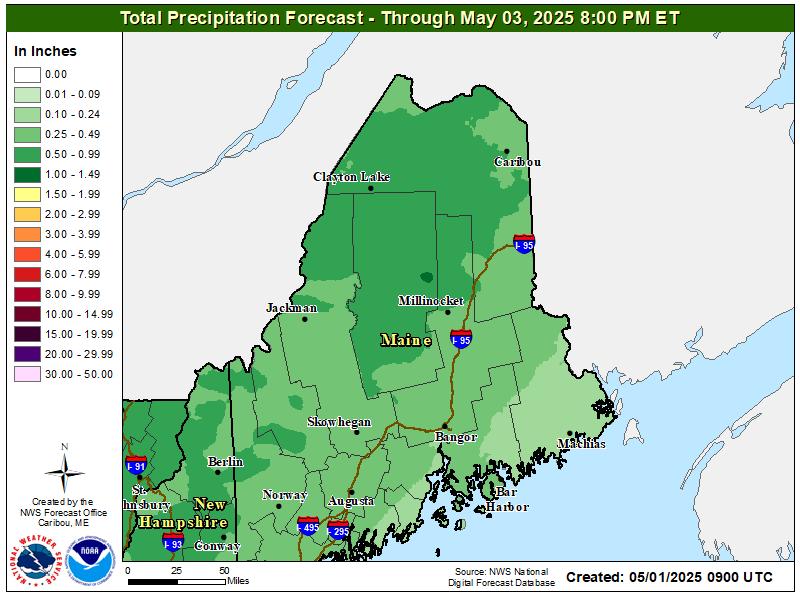 |
2.5 Day QPF ForecastMap displays 2.5 Day forecasted precipitation amounts. Map is updated every time the forecaster issues a new forecast. |
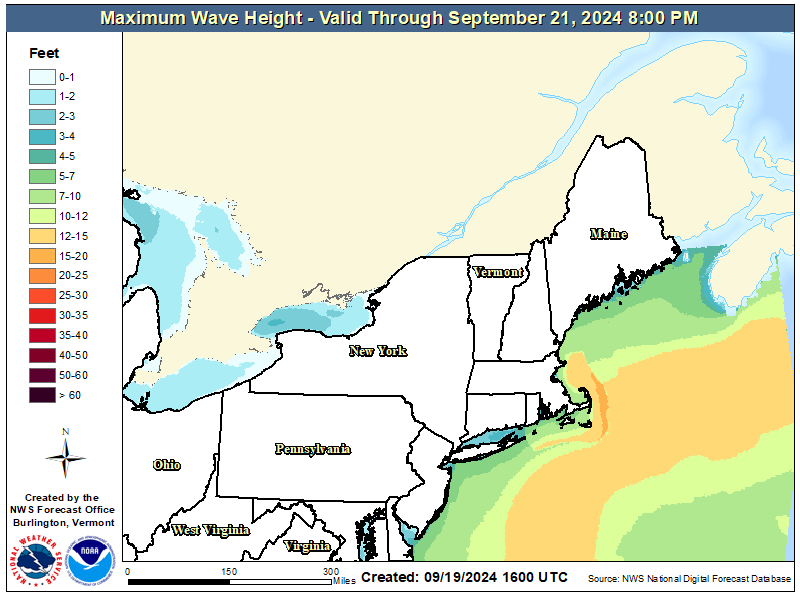 |
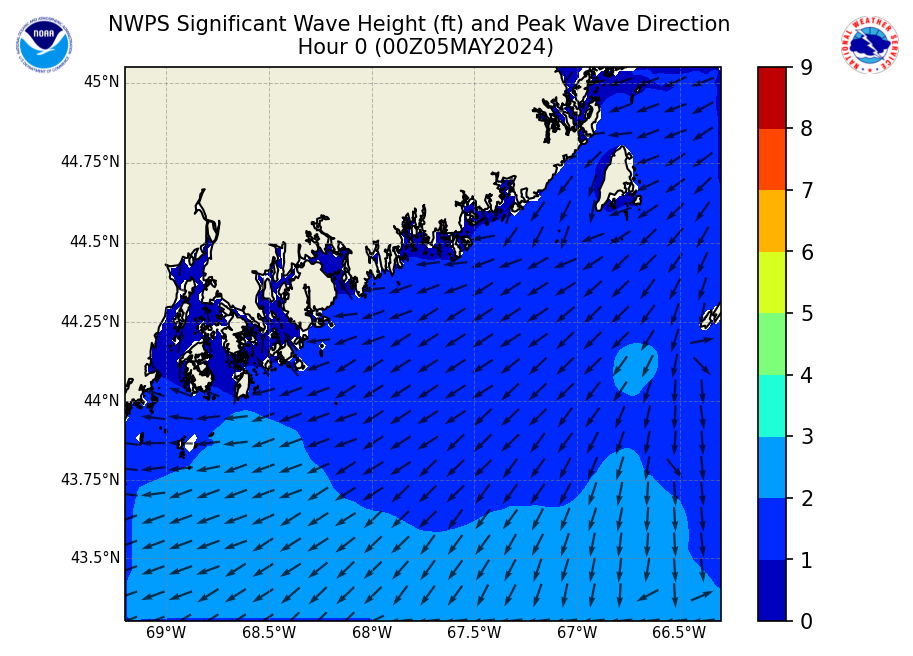
Maximum Wave HeightMap displays 3-Day Maximum Wave Height. Map is updated every time the forecaster issues a new forecast. |
||
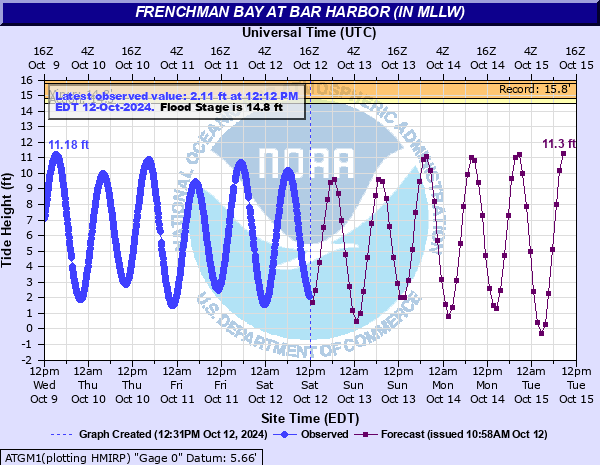 |
Bar Harbor Tide GageImage displays observed and predicted tide levels for the Bar Harbor Tide gage. |
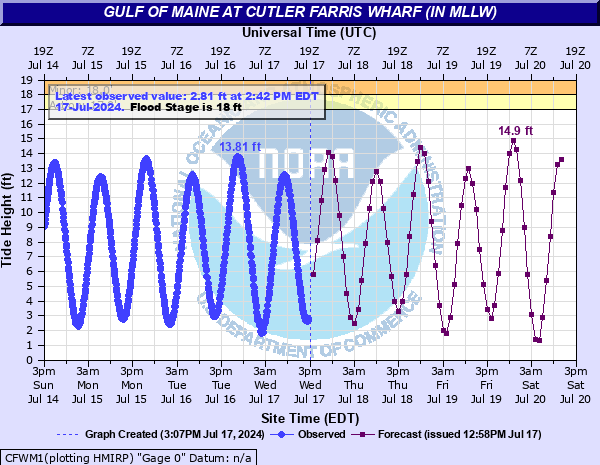 |
Cutler Farris Wharf Tide GageImage displays observed and predicted tide levels for the Cutler Farris Wharf Tide gage. |
||
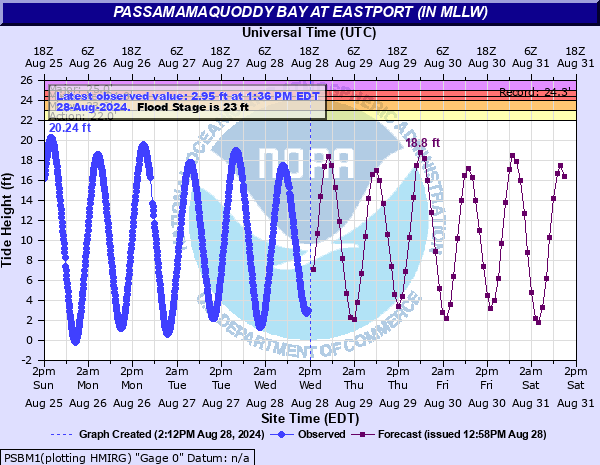 |
Eastport Tide GageImage displays observed and predicted tide levels for the Eastport gage. |
 |
24Hr QPF ForecastMap displays 24hr forecasted precipitation amounts. Map is updated every time the forecaster issues a new forecast. |
||
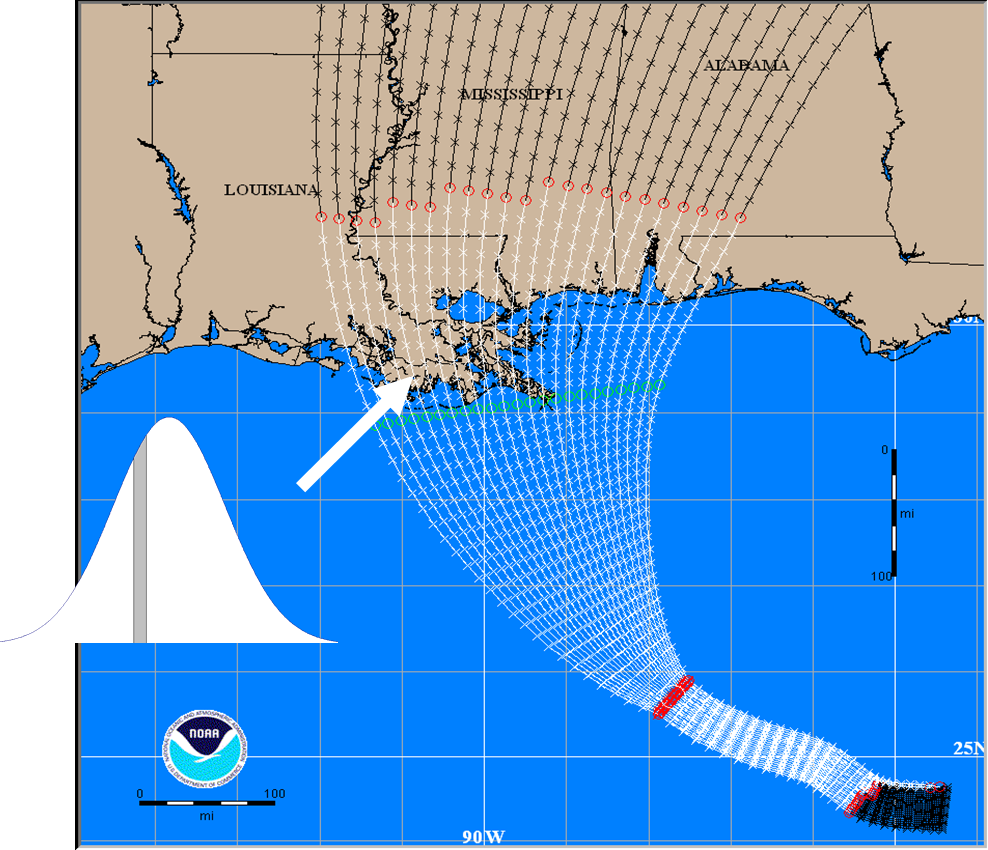 |
Probabilistic Hurricane Storm Surge (with tide)Map displays experimental storm surge (with tide) heights in feet above ground level with a 1 in 10 chance of being exceeded. |
 |
|


 Coastal Flood