
A heat wave over the Southwest will intensify this week, peaking and expanding into the Intermountain West and northern High Plains this weekend. Critical to extremely critical fire weather conditions are forecast from the Northwest and the northern Great Basin this weekend. Particularly Dangerous Situation Red Flag Warnings have been issued. Read More >

For Moderate/High/Extreme hazard risk, more detailed information will be provided via emailed briefings to core partners.
 |
Wet Bulb Globe TemperatureWet Bulb Globe Temperature (WBGT) is a measure of the heat stress in direct sunlight, which takes into account: temperature, humidity, wind speed, sun angle and cloud cover (solar radiation). This differs from the heat index, which takes into consideration temperature and humidity and is calculated for shady areas. For more background info on WBGT, click here. |
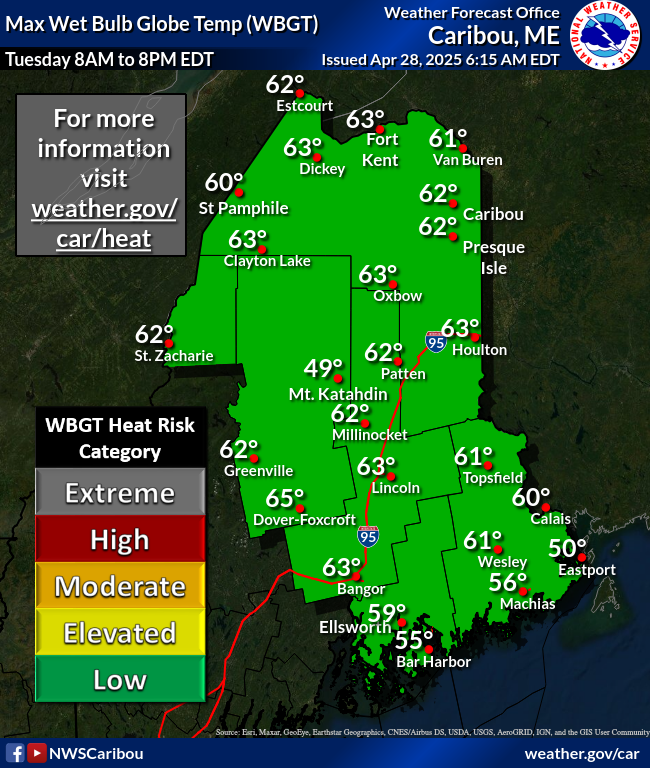 |
Local Heat Graphics & InformationDesigned for the public and decision makers, this page gives the Heat Index and Wet Bulb Globe Temperature forecasts for our local area and provides explanations and links to their use for decision making. |
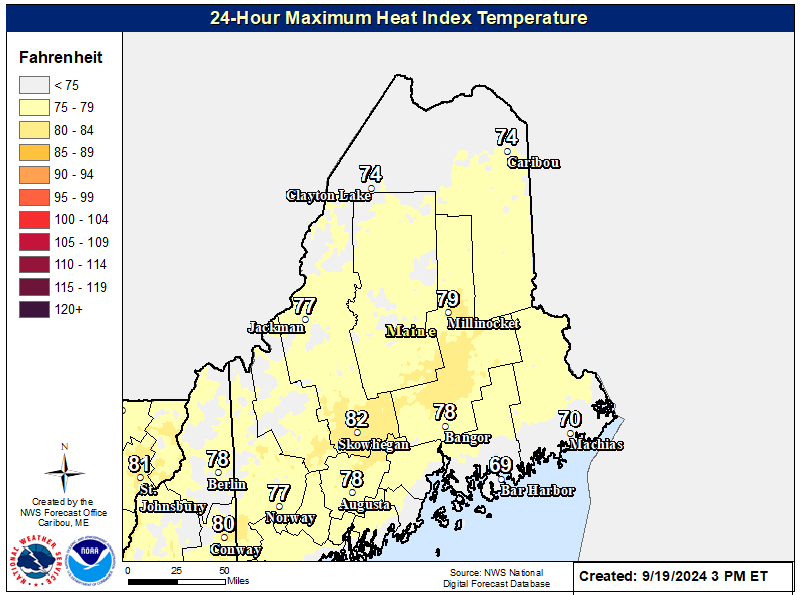 |
3-Day Maximum Apparent TemperatureMap displays the 3 day maximum apparent temperatures. Map gets updated every time the NWS in Caribou produces a new grid. |
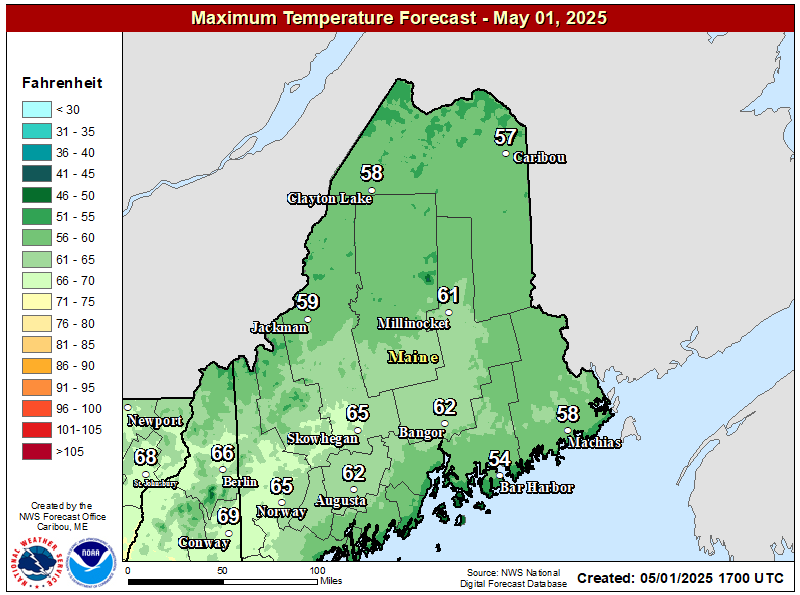 |
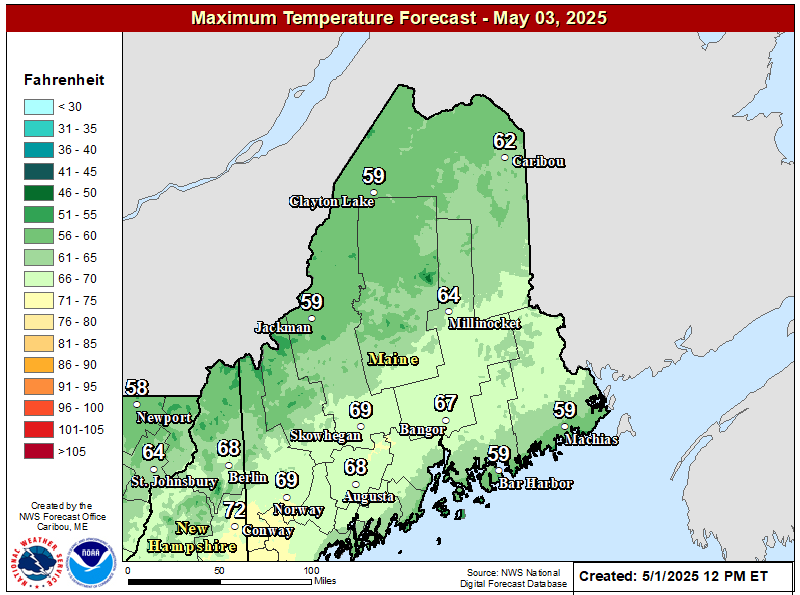
Day 1 Maximum TemperatureMap displays the maximum temperature for day one. Map gets updated every time the NWS in Caribou produces a new grid. |
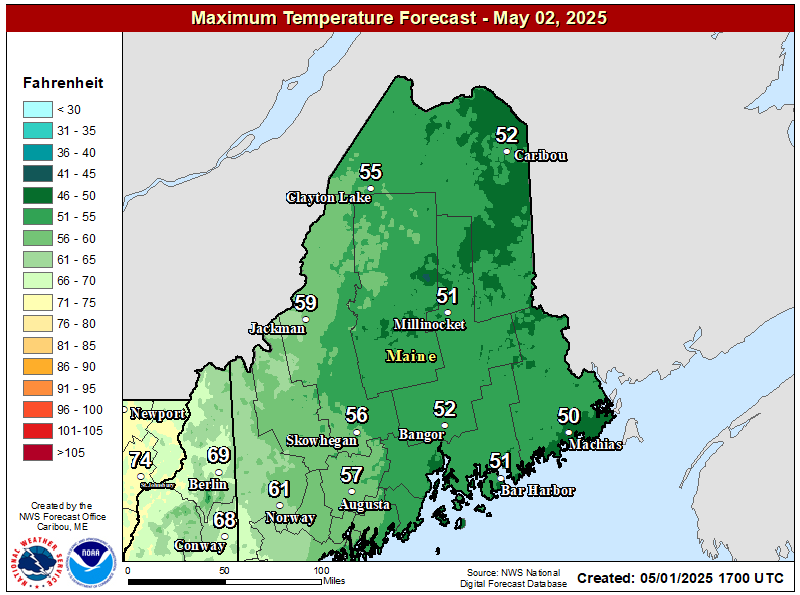 |
Day 2 Maximum TemperatureMap displays the maximum temperature for day two. Map gets updated every time the NWS in Caribou produces a new grid. |
 |
Day 3 Maximum TemperatureMap displays the maximum temperature for day three. Map gets updated every time the NWS in Caribou produces a new grid. |
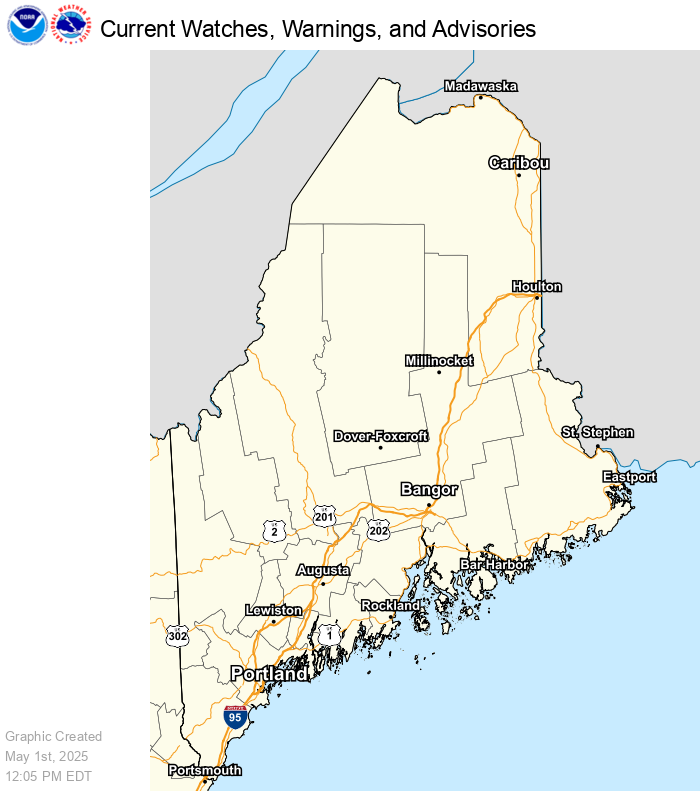
Weather HazardsMap displays active watch, warnings, advisories and short term forecasts in the lower 48 states. Map automatically refreshes every five minutes. |
Surface AnalysisThe Weather Prediction Center (WPC) produces surface maps which depicts the analysis of highs, lows, fronts, troughs, outflow boundaries, squall lines, and drylines.
|


 Coastal Flood