Severe Thunderstorms Tonight in the Mid-Atlantic; Tropical Storm Bertha in the Gulf
Scattered thunderstorms with severe gusts, hail and a tornado risk are possible near a cold front from the Ohio Valley to the Mid-Atlantic tonight. Tropical Storm Bertha is expected to bring tropical storm conditions to portions of the Gulf Coast from the panhandle of Florida into Louisiana through Wednesday.
Read More >
The main weather themes of 2018 were the overall warmth and the wet fall. The year ended as the 9th warmest on record, finishing with an average yearly temperature of 62.2 degrees. Precipitation was intermittent and sparse through the spring and summer in most spots, but became more robust and widespread in the fall. The late year wetness helped subdue the emerging and somewhat persistent drought. 15.27 inches of precipitation fell at Lubbock during 2018, which was the 41st driest in the historical record, almost 4 inches below average.
The first four months of the year brought the typical variability one would expect, though precipitation was on the lean side. Severe weather season brought several rounds of intense thunderstorms, primarily consisting of large hail and damaging winds. Baseball size hail caused extensive structural damage in southwest Lubbock and winds estimated at 80 to 90 mph leveled three compress warehouses on the west side of Ralls. A total of 6 tornadoes were observed in the region through the year, all over open lands. The late spring and summer were on the hot side, especially May which supplied record heat, setting 6 daily record highs and finishing over 8 degrees above average in Lubbock. Autumn brought a welcome change of pace as with cooler temperatures and more widespread and regular rainfall. September and October were the wettest months of the year, by far, both in West Texas and statewide. In fact, Lubbock officially recorded over half its annual rainfall in the wet two-month stretch, and Texas, as a whole, saw its wettest two-month period on record. Late autumn and early winter were quieter except for an impressive winter storm in early December. Much of the South Plains region saw 3 to 5 inches of snow, with totals as high as 8 to 11 inches in and around Lubbock.
2018 Map of Significant Weather Events
The map below highlights some of the more significant weather events that occurred across the area in 2018. The severe weather season kicked off a bit early with a brief landspout tornado touching down north of Brownfield in late March. Tornadoes were tough to come by through the rest of the year, tallying only 5 more in the remaining 9 months. Overall, thunderstorm frequency was subdued through much of the spring, which also helped fuel the hottest May on record in Lubbock. Even so, several intense storms did track across the region spewing large hail and damaging winds. One such storm dropped hail of baseball size and larger to the southwest side of Lubbock on May 19th. Another particularly intense storm, fueled by 100+ degree heat, brought wind-driven golfball-sized hail to Ralls and baseball-sized hail to Spur on June 1st. This storm destroyed several compress buildings on the west side of Ralls, briefly closing the highway due to debris. June also brought damaging thunderstorm wind gusts in excess of 70 mph to Plains, Levelland and Dimmitt. After a hotter and drier than average summer, more widespread and frequent rains helped ease growing drought concerns while also providing welcome cooling. The final month of 2018 provided the first widespread heavy snow for the South Plains region since the blizzard in December of 2015.
Map displaying many of the more notable weather impacts to the region in 2018. Note that this is just a sampling of events, many more have been omitted due to space constraints. Click on the image to view a larger map.
Six tornadoes were observed in the Lubbock 24-county service area in 2018, well below the 21 observed the previous year, and the long-term average of 18. Two tornadoes were observed in October, while March, June, September and December had one tornado. Impressively, the typical heart of the severe weather season, April and May, had no known tornadoes. The strongest and longest-lived tornado of the year developed about 5 miles northwest of Dimmitt on October 7th. This tornado grew to a large cone shape as it tracked northward for 8 to 9 miles, lifting about 18 minutes after it developed. Thankfully, this tornado remained over farm land and produced no known damage. The remaining tornadoes in 2018 were brief and occurred in remote areas and did little to no known damage.
Precipitation Summary
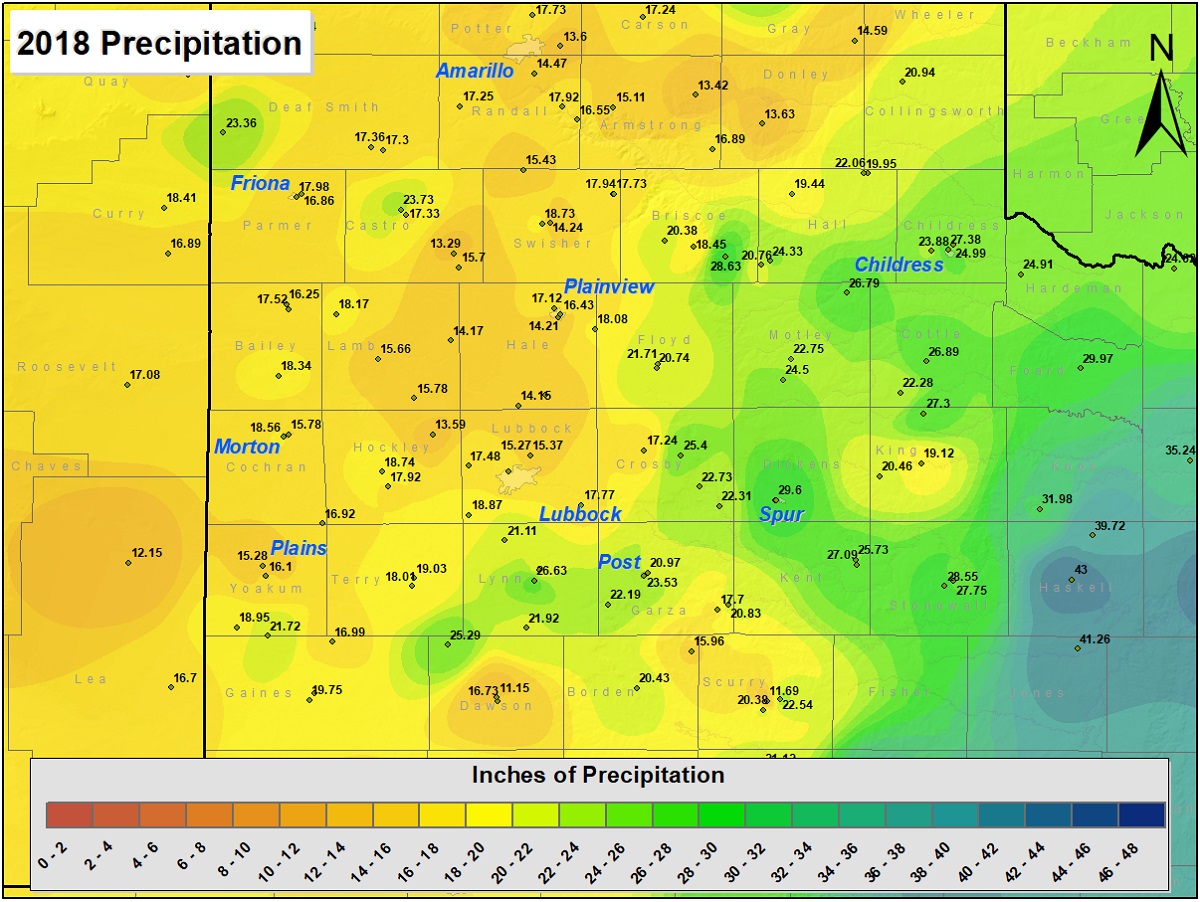
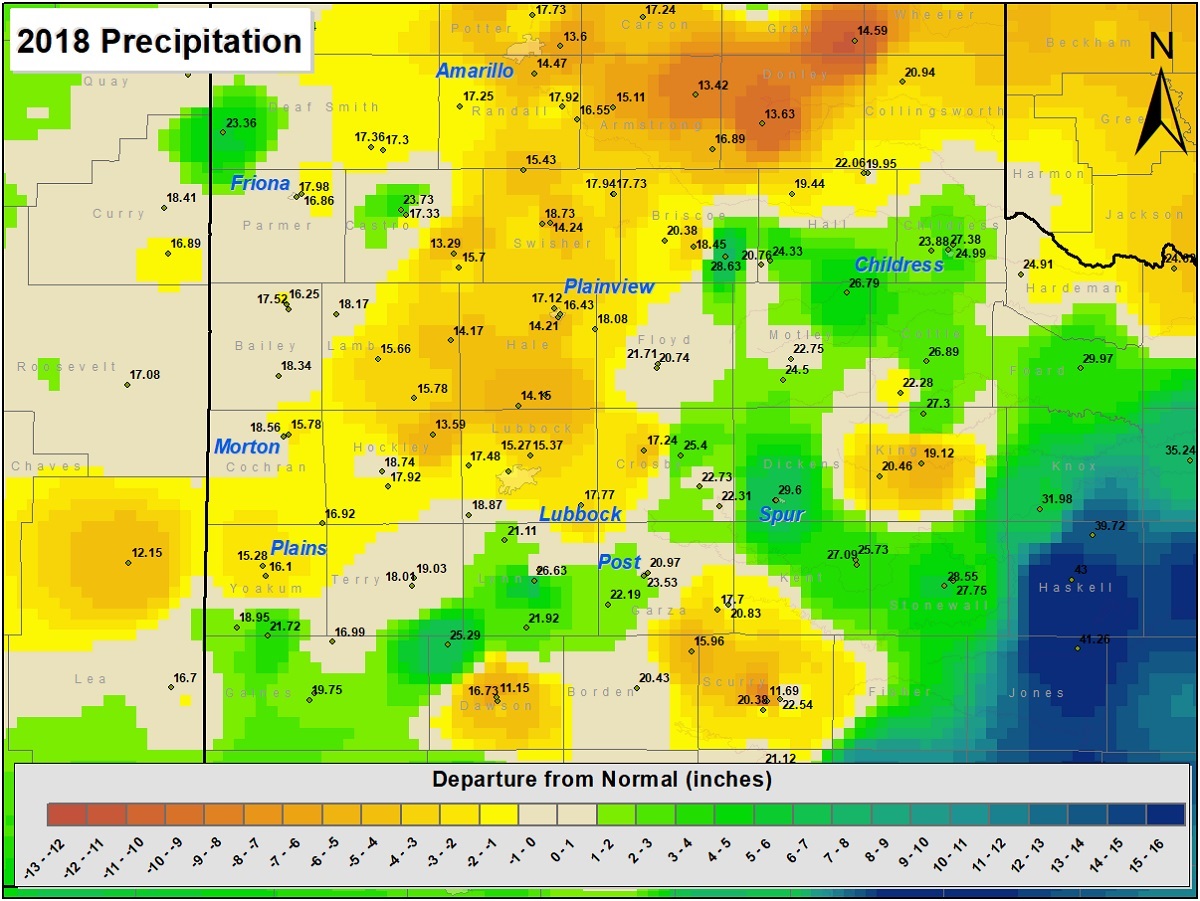
This map displays the 2018 year precipitation totals. The map was created with data gathered from the NWS Cooperative observers and the West Texas Mesonet. Click on the map to view a full-sized version.
Precipitation in 2018 varied greatly, but generally favored the southern South Plains and the Rolling Plains, with lower totals across the central and northern South Plains into the south-central Texas Panhandle. The biggest winners stretched from Aspermont to Spur to Caprock Canyons State Park then east to Childress where totals of 25 to 30 inches were common. Another couple of pockets of higher rain totals, from 20 to 25+ inches, were found from much of Lynn County into Gaines Count, as well as around Dimmitt and Bootleg. The lowest rain amounts, around and under 15 inches, occurred from Lubbock and Littlefield northeastward through Plainview, Tulia and into much of Randall, Armstrong and Donley Counties.
Lubbock International Airport officially recorded 15.27 inches of precipitation, nearly four inches below the long-term average of 19.12 inches. This was fairly representative of the north half of Lubbock County, though the southern half of the county and much of the city of Lubbock fared slightly better, finishing the year close to average.
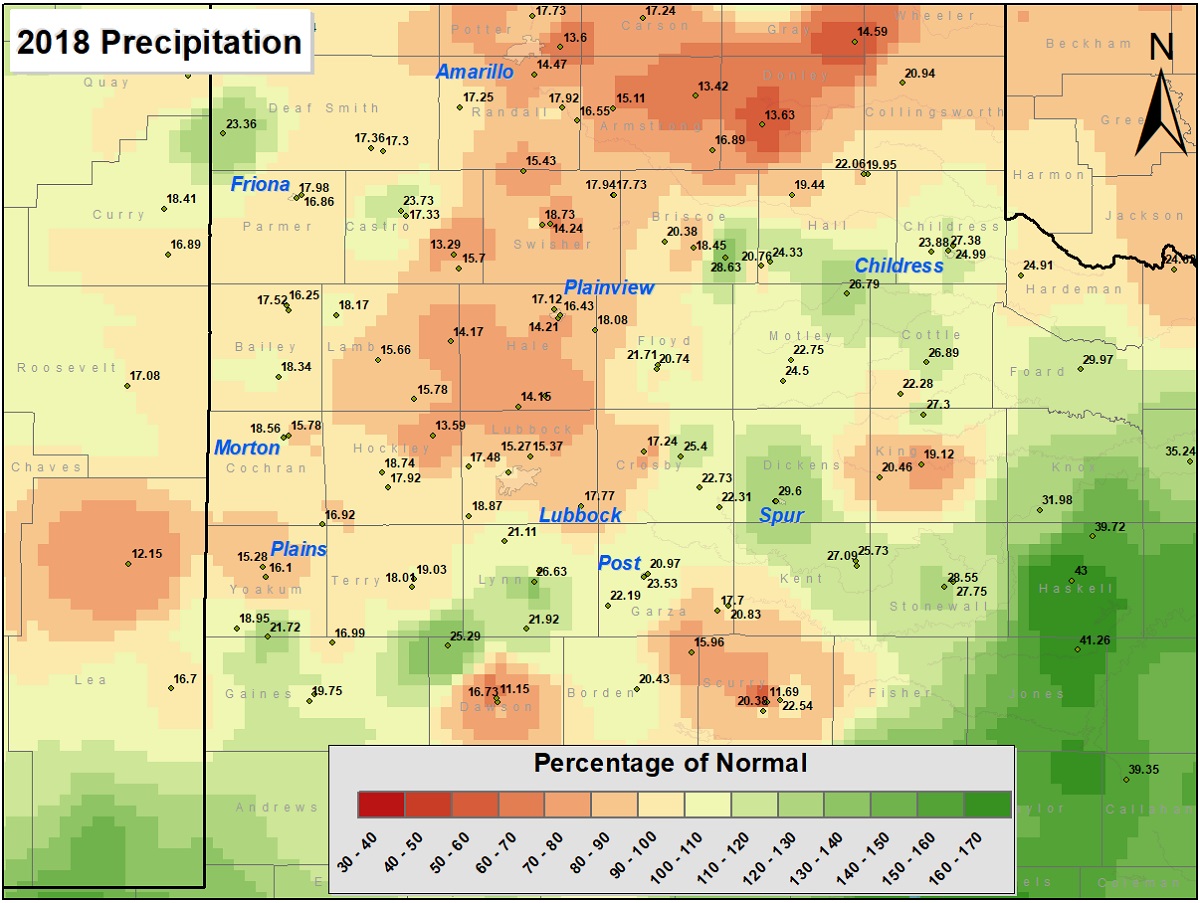
The map below shows the 2018 precipitation as a percent of the long-term average, or "normal". This image shows the prevalent dry region (70-80% of average) extending from the western and central South Plains northeastward in the Texas Panhandle, with other small dry pockets near Lamesa, Fluvanna and Paducah. On the other side of the spectrum, well above average precipitation, 150+ percent of normal, fell out east over much of Jones and Haskell Counties, where rain totals exceeded 40 inches in spots.
This map shows the 2018 rainfall as a percent of the 30-year normal rainfall (1971-2000). Also plotted is the rainfall observed, in inches, at each collection site. Please click on the map to view a full-sized version. If you would like to see the precipitation as a departure from normal please CLICK HERE.
Drought Update and Reservoir Levels
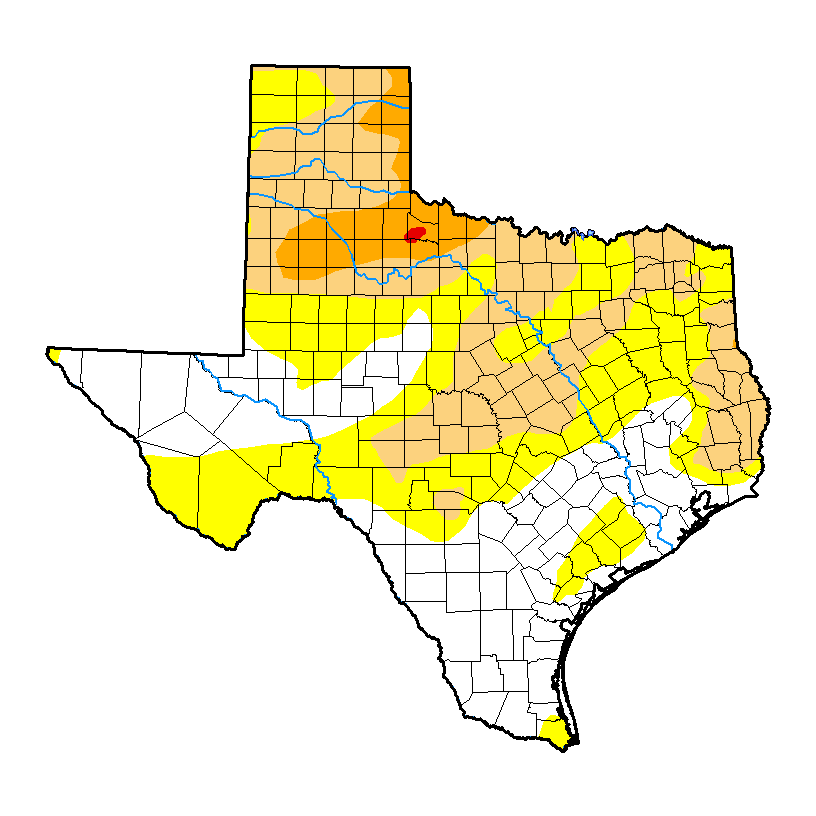
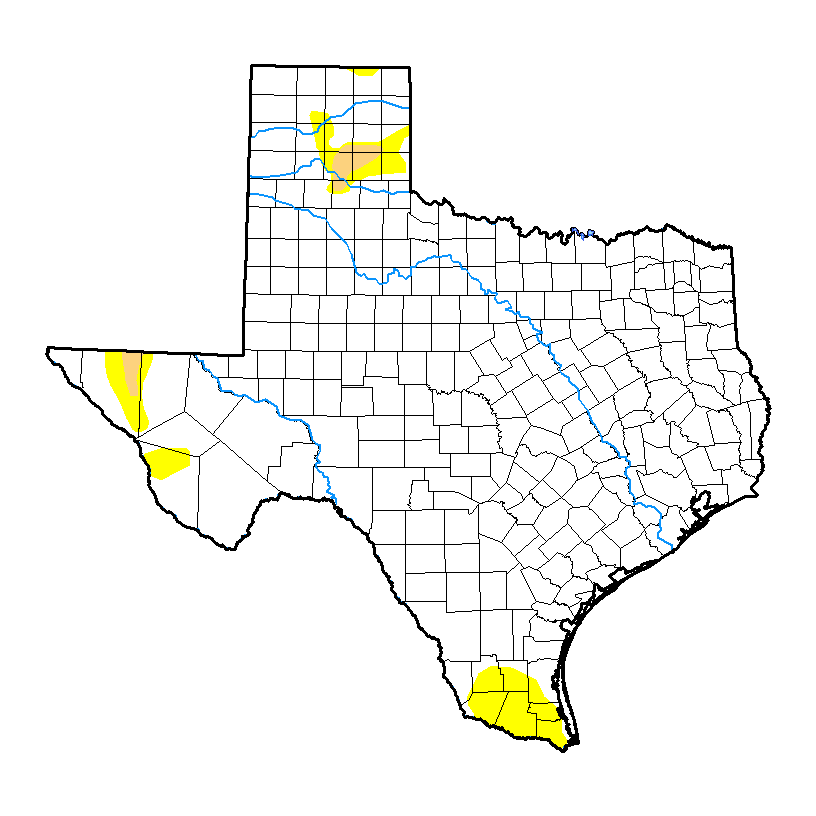
The year started on a dry note, and these dry conditions persisted through the remainder of the winter and into the spring. This caused the drought to worsen through the first several months of the year across the South Plains and Rolling Plains. Intermittent showers and thunderstorms through the late spring and summer provided some relief, though most spots continued to hang on to longer-term moisture deficits. Much more widespread and heavy rainfall then fell over West Texas, and the state as a whole, in the fall. Texas officially recorded its wettest two-month stretch on record in September-October, averaging near 14 inches of rainfall state-wide. All of this rain effectively removed the drought over the South Plains and the entire state.
This map shows the drought conditions on January 2, 2018. Click on the map to view a full-sized version.
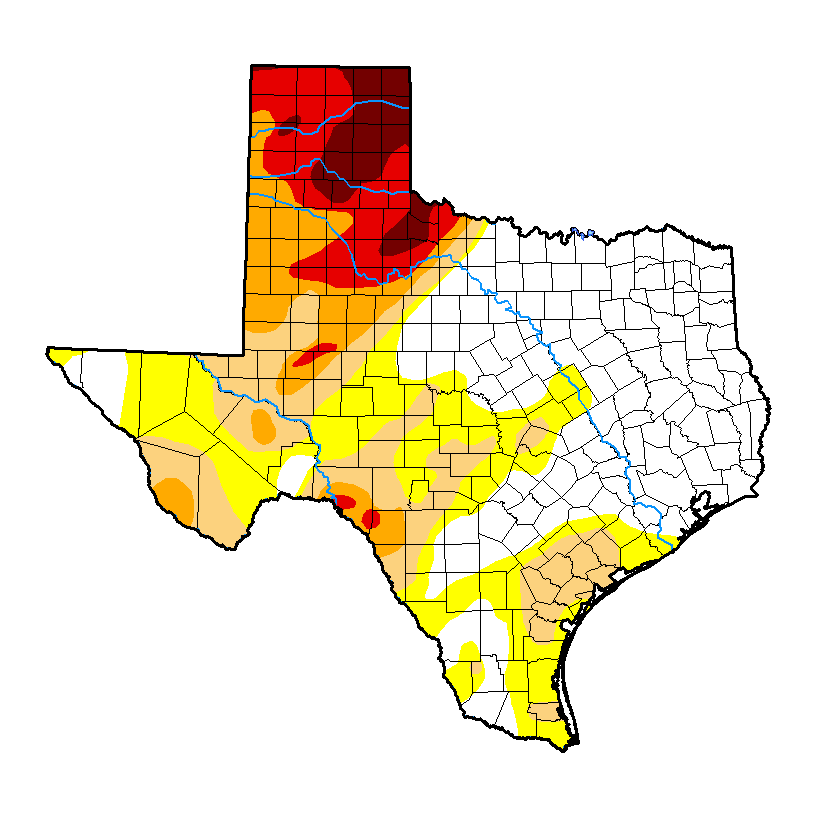
This map shows the drought conditions on May 8, 2018. Click on the map to view a full-sized version.
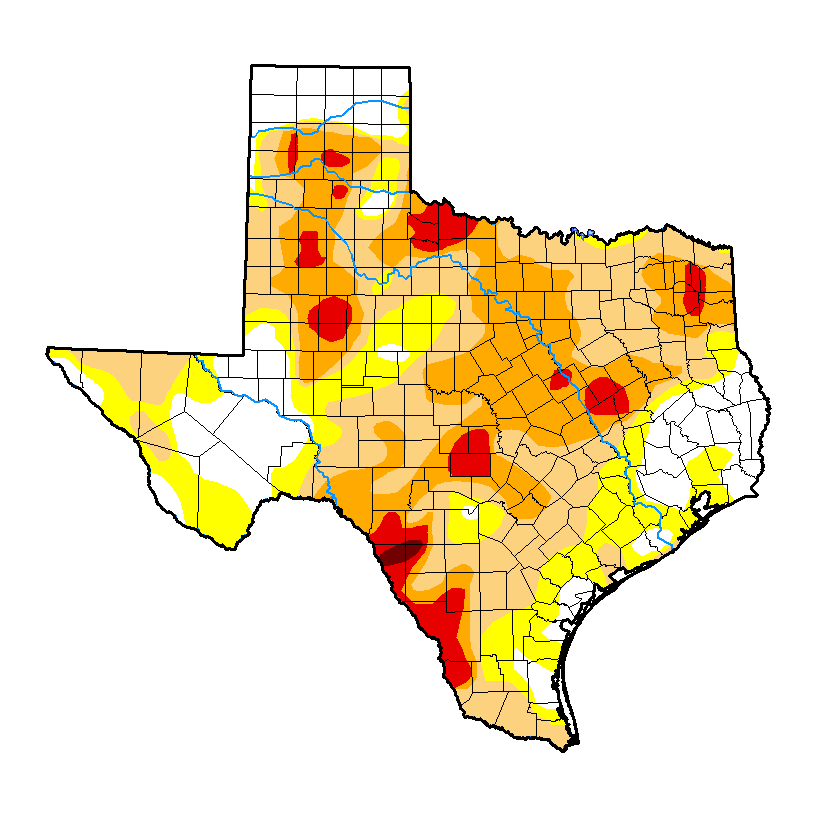
This map shows the drought conditions on August 28, 2018. Click on the map to view a full-sized version.
This map shows the drought conditions on December 18, 2018. Click on the map to view a full-sized version.
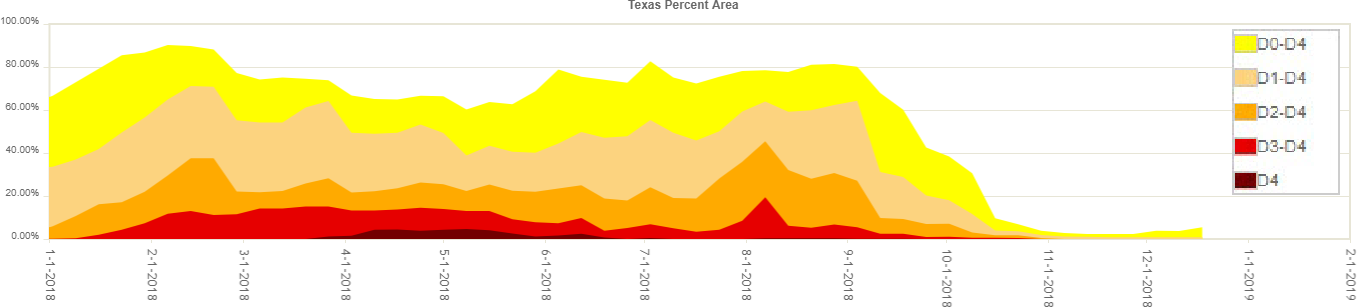
Statewide drought coverage for Texas in 2018. The South Plains followed the same general trend as the entire state. Click on the above image for a larger view.
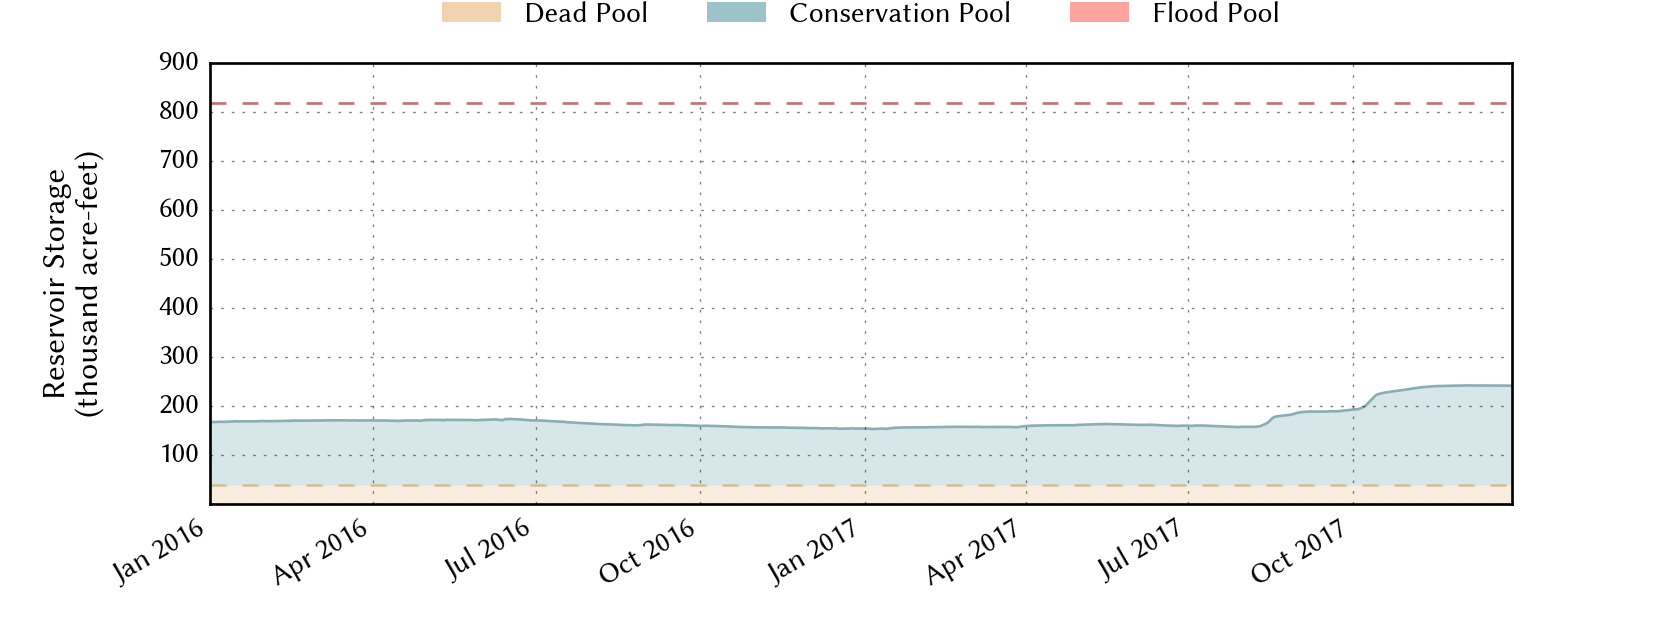
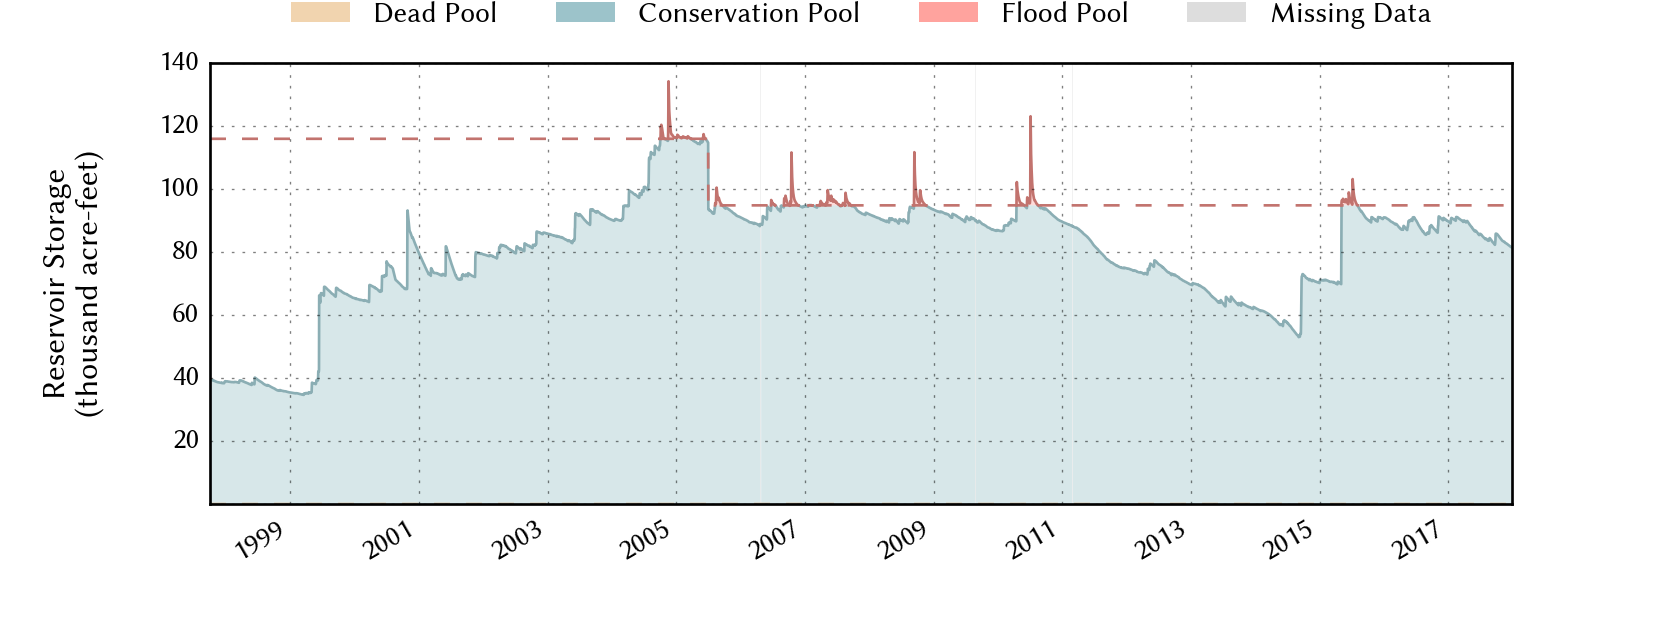
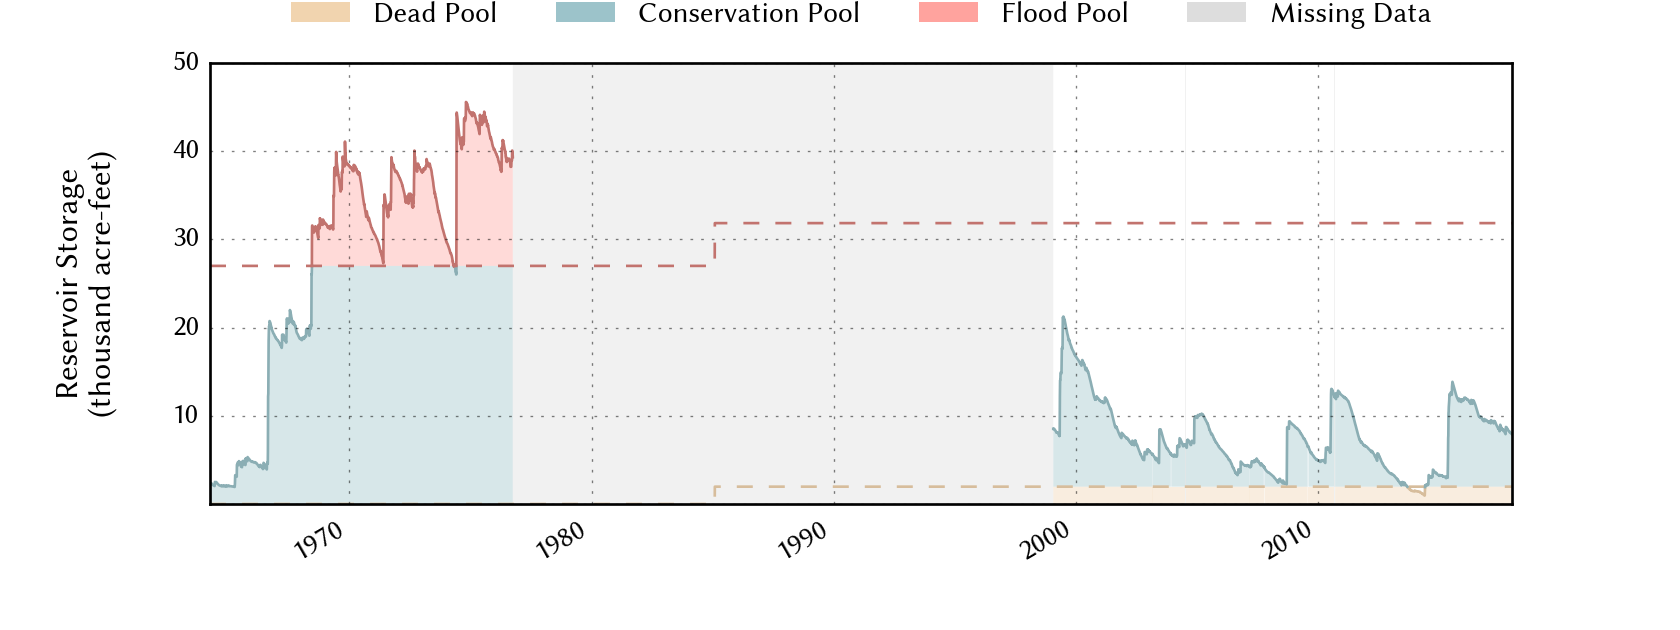
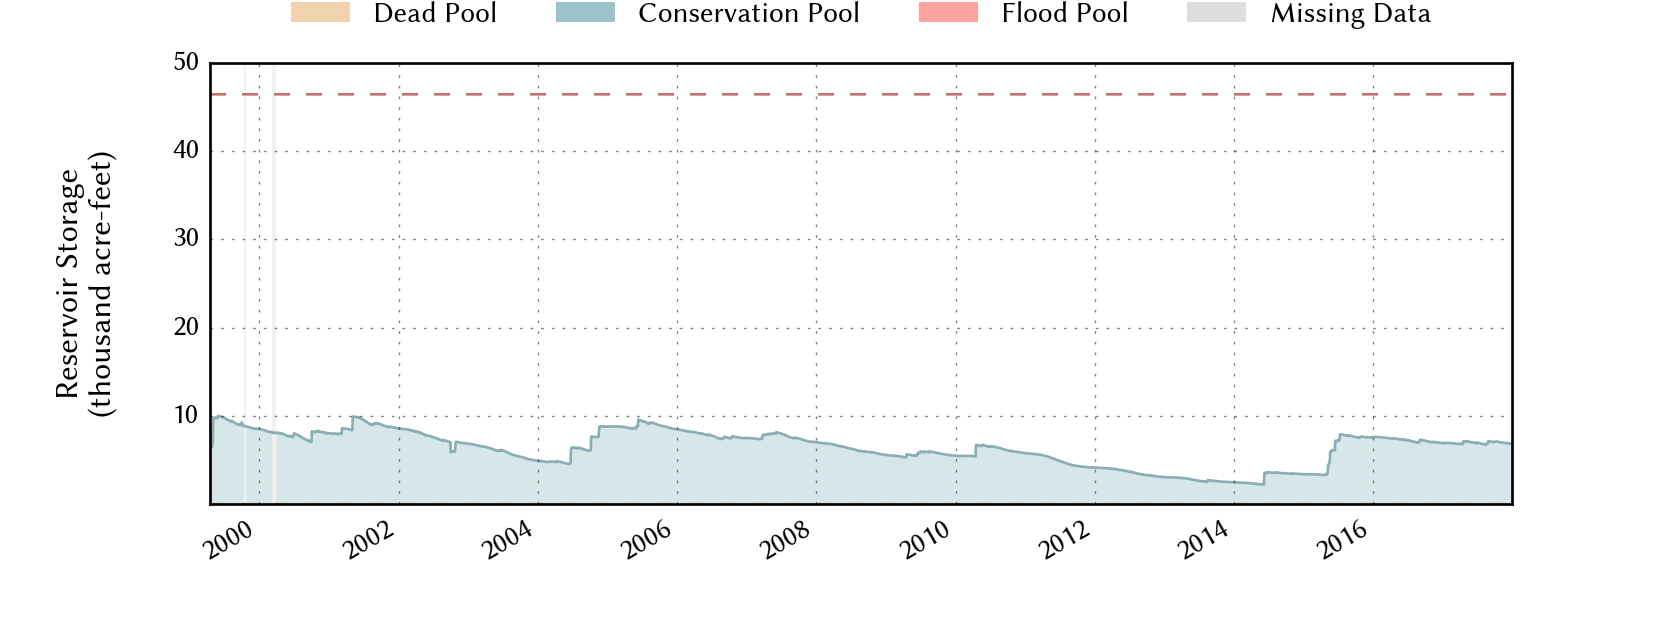
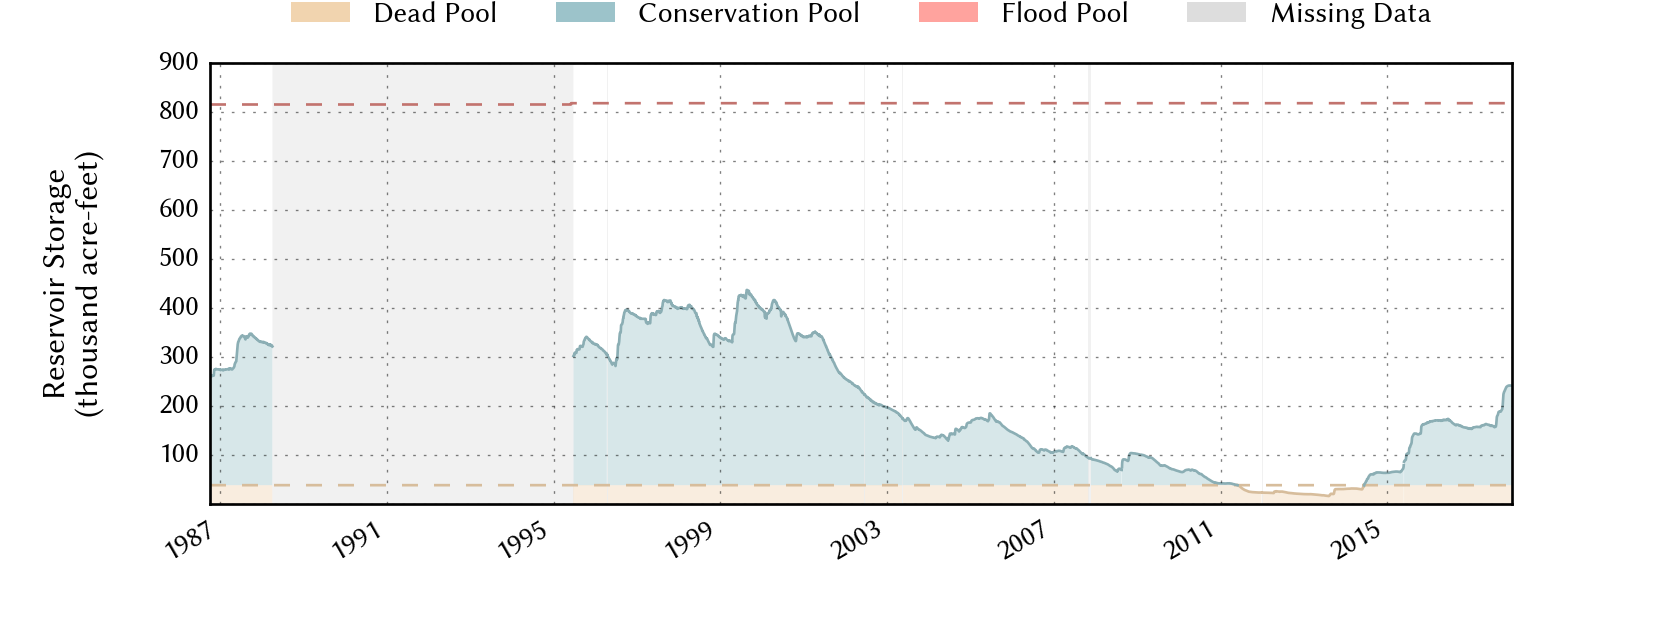
The drier-than-average first two-thirds of the year followed by the wet fall resulted in only minor net changes in reservoir levels through 2018. Lake Meredith, Lake Mackenzie and White River Lake each saw minor decreases in their conservation levels over the entire year while Lake Alan Henry gain one percentage point (from 86% to 87%).
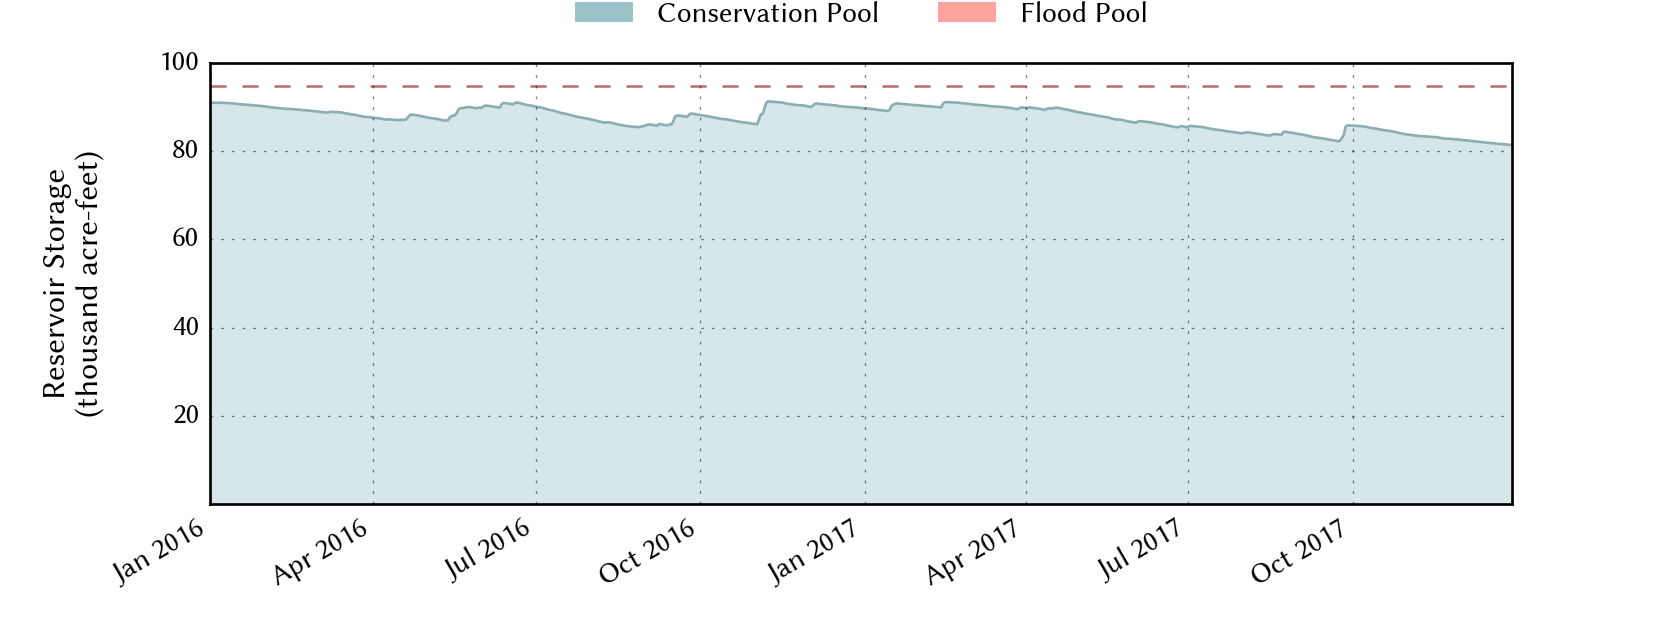
Recent plot of the water level for Lake Alan Henry. Click on the image for a full-sized version. A longer record of data for Lake Alan Henry can also be VIEWED HERE. The graphs are courtesy of: www.waterdatafortexas.org
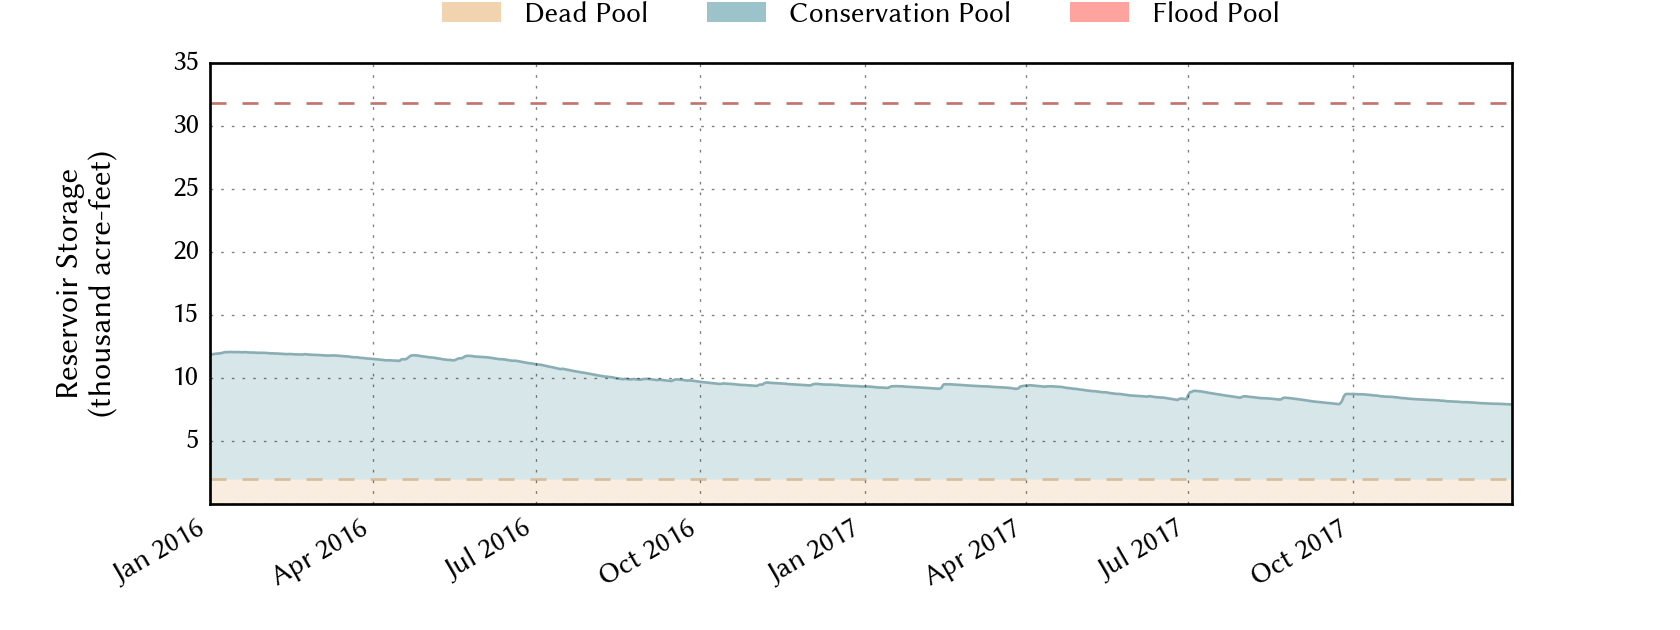
Recent plot of the water level for White River Lake. Click on the image for a full-sized version. A longer record of data for White River Lake can also be VIEWED HERE. The graphs are courtesy of: www.waterdatafortexas.org
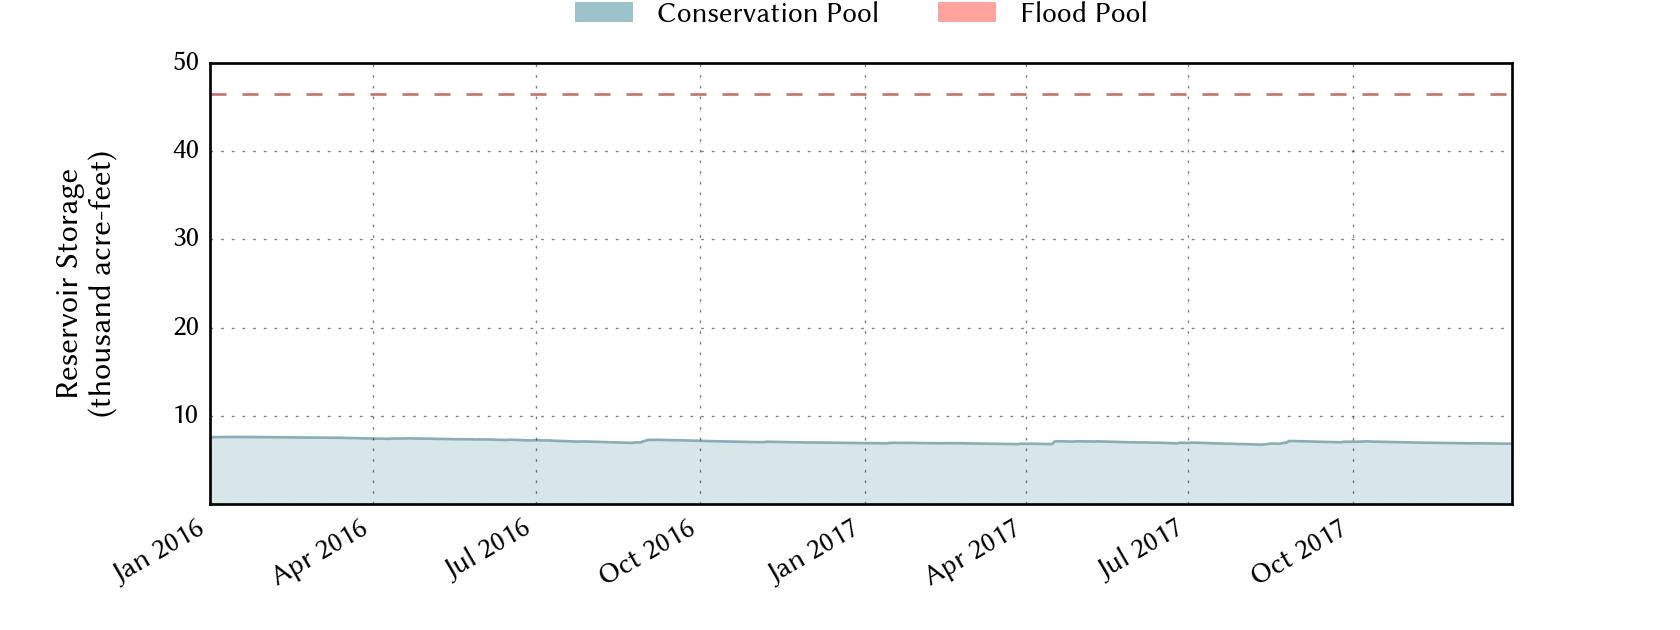
Recent plot of the water level for Mackenzie Reservoir. Click on the image for a full-sized version. A longer record of data for Mackenzie Reservoir can also be VIEWED HERE. The graphs are courtesy of: www.waterdatafortexas.org
Recent plot of the water level for Lake Meredith. Click on the image for a full-sized version. A longer record of data for Lake Meredith can also be VIEWED HERE. The graphs are courtesy of: www.waterdatafortexas.org
Lubbock Statistics
2018 will go down in the books as the 9th warmest and 41st driest year since records began in 1911 at Lubbock. Warm temperatures prevailed a majority of the year, with January, April, October, November and December being the only months to finish with below average mean temperatures. The warmest months, with respect to average, were May (+8.2°F), June (+5.5°F) and March (+4.6°F).The coolest months, with respect to average, were November (-3.0°F) and October (-2.4°F).
Precipitation was tough to come by through the winter and spring of 2018, with only spotty showers and thunderstorms through the summer. In fact, each of the first eight months of the year (January - August) finished with below average monthly rain totals. This finally changed in fall when both September and October received well above average precipitation, with a two-month total of 7.91 inches. November returned to the dry side with only 0.07 inches of rain, but a heavy wet snow in early December contained nearly 1 inch of liquid, single-handedly pushing December above average. The December event also deposited 10 inches of snow, the heaviest snowfall recorded in Lubbock since the blizzard in December 2015, and the first 1" or greater event at the Lubbock Airport since January 2016. The Lubbock Airport recorded a total of 15.27 inches of precipitation for 2018, finishing almost 4 inches shy of average. One daily record rainfall was set in 2018: 0.90 inches on December 8th (all in the form of 10 inches of snow). Somewhat of a rarity, not a single day in 2018 recorded an inch or more of rain. The highest single-day rainfall in 2018 was 0.95 inches on September 26th.
The hottest temperature in 2018 was a 108 degrees, reached on June 24th. The high reached or exceed 105 degrees on three other occasions: June 1st (107°F); May 30th (106°F); and July 19th (105°F). In all temperatures reached the triple digits on 25 occasions, well above the long term average of 10. On the other side of the pendulum, the coldest temperature of the year was a chilly 4 degrees, experienced the first day of the year. Eighteen nights fell below 20°F for the entire year. Fourteen record highs were tied or set in 2018: 90°F on March 22nd; 89°F on March 23rd; 93°F on April 8th; 100°F on May 10th; 102°F on May 11th; 100°F on May 12th; 102°F on May 26th; 106°F on May 30th; 102°F on May 31st; 107°F on June 1st; 103°F on July 18th; 103°F on July 21st; 104°F on July 22nd; and 100°F on August 27th. In addition, 20 record high minimum temperatures were set in 2017. No record lows were set in 2018. Two record low maximum temperatures were set in 2018: 44°F on October 15th; and 48°F on October 18th.
LUBBOCK
Average High
Average Low
Precip (inches)
January
56.9
22.7
T
February
61.4
29.8
0.20
March
72.2
40.8
0.87
April
76.6
42.7
0.03
May
92.8
63.2
1.26
June
96.7
69.1
1.36
July
94.9
70.6
0.88
August
93.4
69.3
1.25
September
83.6
61.8
3.26
October
68.9
49.4
4.65
November
60.4
33.3
0.07
December
52.4
28.6
1.44
Annual
75.9
(19th warmest)
48.5
(7th warmest)
15.27
(41st driest)
Normal
74.3
47.0
19.12
Departure
+1.6
+1.5
-3.85
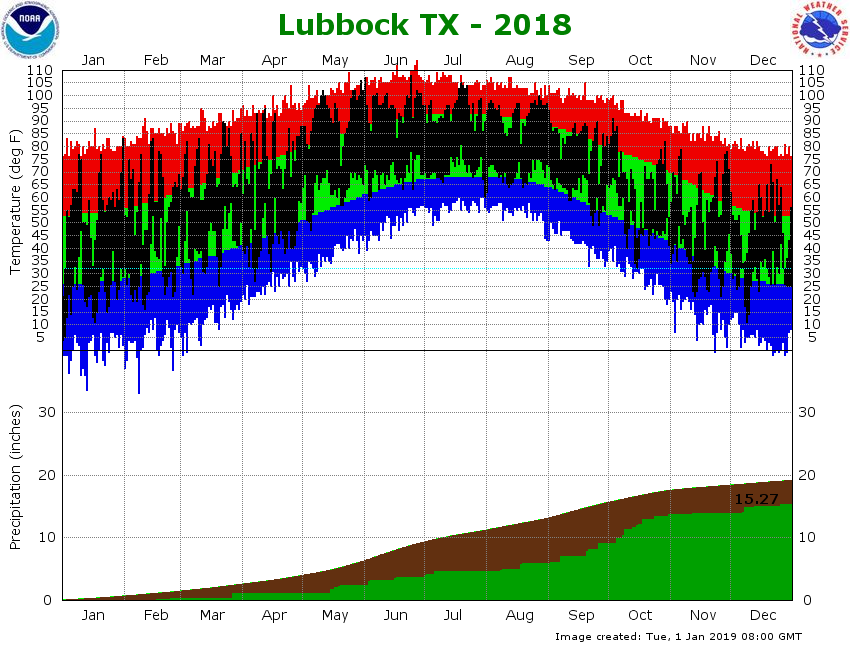
The top portion of the below graph shows the daily high and low temperature distribution for 2018 at Lubbock Preston Smith International Airport. A majority of the year yielded temperatures at or above average, with 7 of the 12 months finishing warmer than average. May was particularly warm when compared to average, setting six record highs and finishing over 8 degrees above average. The two coolest months, with respect to average, were October and November which were 2-3 degrees below average. Even with the overall warm year, there were a few cool/cold stretches including the very beginning of the year when a shot of Arctic air brought single digit lows the 1st (4°F) and 2nd (5°F) of January. Mid-January was also cold with a few nights in the teens, and April recorded many below average overnight lows. Mid-October, mid-November and early December also brought well below average stretches.
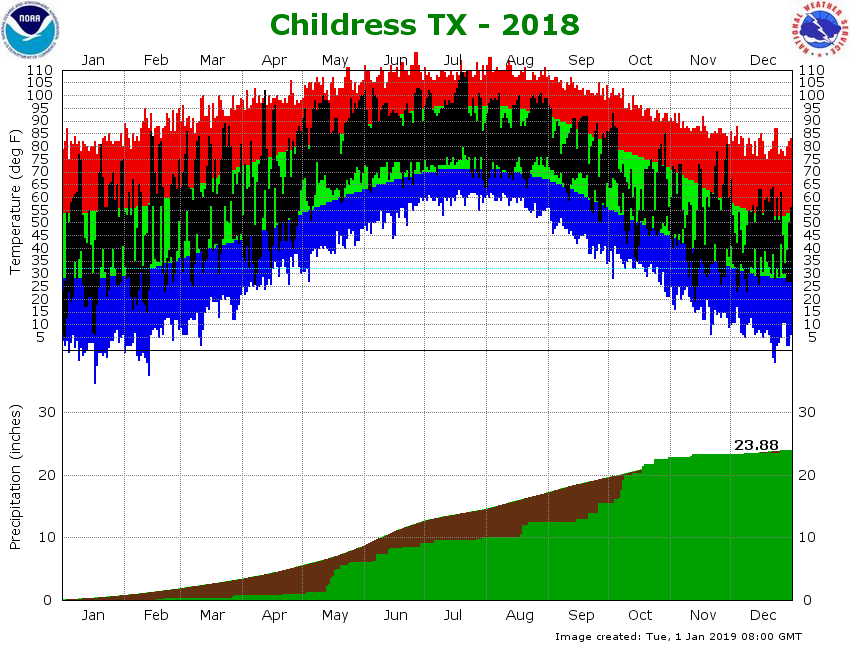
(Top) Plot of the maximum and minimum temperatures (connected by a black line) observed at the Lubbock Preston Smith International Airport in 2018. Also plotted are the respective normals (green - range of average highs and lows) and record highs (red) and record lows (blue) for each date. Units are in degrees Fahrenheit. (Bottom) Plot of the rain accumulation (green), in inches, observed at the Lubbock Preston Smith International Airport in 2018. Also plotted is the distribution of the average rainfall (brown). Click on the graph for a larger view. Click HERE to view the graph for Childress.
The lower portion of the chart above shows how much rain accumulated through 2018. Lubbock finished with a grand total of 15.27 inches, nearly four inches below the 30-year average. The year began on a dry note, with precipitation events coming few and far between. The precipitation totals remained shy of average each of the first eight months of the year, including a long dry stretch from early July to early August. The more regular and heavier rains did finally kick in during the fall, with a wet September and October making up some of the deficit compiled through the first two-thirds of the year. It did dry out in November, though a potent winter storm brought widespread heavy, wet snow to the South Plains, with around an inch of liquid equivalent for Lubbock.
2018 snowfall was tough to come by until a big winter storm struck in early December, single-handedly dropping more than the annual average of 8.2 inches. An impressive 10 inches of snow fell, primarily during the first half of the day on December 8th. This storm accounted for all the measurable snow that fell in Lubbock in 2018. The 10.0 inches of snow ranks as the 38th highest yearly snow total on record and is the highest annual snowfall recorded since 2015, which included an impressive blizzard in late December.
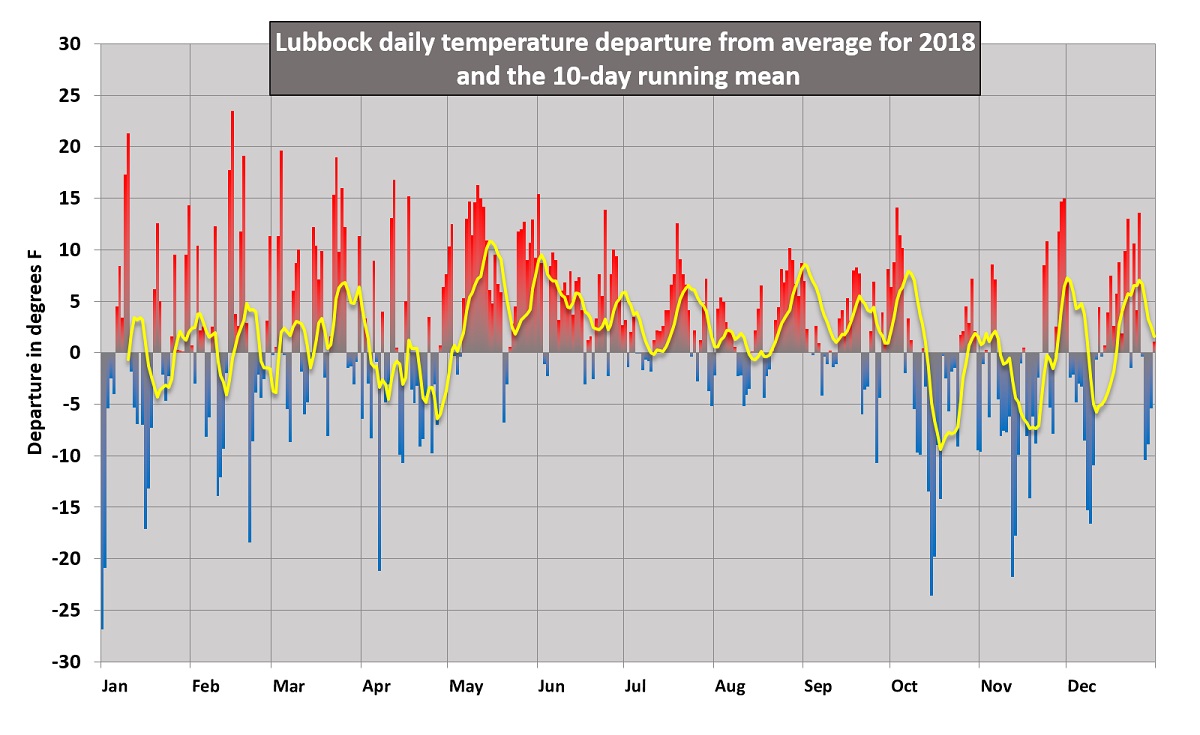
The graph above shows the 2018 daily temperature and a 10-day running mean (yellow line) at Lubbock as a departure from the 1981-2010 normals. Click on the graph for a larger view.
The graph above displays the daily temperature as the departure from the "normal", or 30-year average temperature. The yellow line represents the 10-day running mean of the daily temperature departure and is used to smooth out the day-to-day extremes so that longer trends are easier to see. It is pretty easy to see that above average temperatures dominated most of the hotter months of 2018, from May through early October. The cooler months of the year, from January through April and mid-October through the end of the year, were more variable, split more closely with both above and below average stretches. The coolest periods, relatively to normal, were much of April as well as the middle parts of both October and November. Overall, the average temperature of 62.2 degrees at Lubbock for the entire year was 0.6 degrees above the 30-year average, and made for the 9th warmest year in the historical record for Lubbock.
2018 Monthly Highlights
JANUARY:
Dec 30th-Jan 2nd: The New Year kicked off on cold and wintry note. Light amounts of ice and snow fell, including the first measurable snow in nearly a year at Lubbock. The first day of the year began with frigid single digit readings. Read more about this chilly start to 2018 HERE. 10th-11th: A strong storm system brought two days of wind to West Texas. The warm winds on the 10th fanned several wildfires, including a cotton fire near Petersburg. Although much cooler on the 11th, northerly winds did reinvigorate a few wildfires. Read more about this windy stretch of weather HERE. 21st: Another round of wind kicked up blowing dust and fanned wildfires. Details from this event can be READ HERE.
FEBRUARY:
16th-17th: The first widespread rain of the year fell. Lubbock officially recorded its first measurable rain since November 8, 2017, ending a record 99 days without measurable precipitation. To learn more about this event CLICK HERE. 21st: A strong cold front and weak upper level disturbance brought light sleet and freezing rain to parts of the region. To read more about chilly and wintry day CLICK HERE.
MARCH:
15th-19th: A couple of upper level storm systems brought rounds of strong winds which lofted dust and pushed several wildfires. To view images from this wind and smoky stretch FOLLOW THIS LINK. 27th-28th: Several strong thunderstorms dropped copious amounts of small hail along with welcome rain over much of the South Plains region. One storm also produced a brief landspout tornado near Loop, Texas. Details on this active couple of days of weather can be FOUND HERE.
APRIL:
12th-14th: Mid-April brought more rounds of winds, blowing dust and wildfires. More on this nasty period can be VIEWED HERE. 24-25th: Just enough instability and wind shear were present to produce a couple of marginally severe thunderstorms. The Lubbock NWS Office issued their first severe thunderstorm warning of the year, making it the latest date to do so within the 2001 to 2018 year record. Learn more about this event HERE. 28th-May 3rd: A slow-moving upper level system and wandering dryline produced several rounds of severe thunderstorms. On the 29th quarter size hail fell near Muleshoe and Bovina and on the 30th Estelline saw ping pong ball sized hail. Learn more about this active period of weather HERE.
MAY:
28th-May 3rd: A slow-moving upper level system and wandering dryline produced several rounds of severe thunderstorms. On May 2nd a storm generated a wind gust to 60 mph in Aspermont, while a squall line the next morning brought widespread rain to the Rolling Plains. Learn more about this active period of weather HERE.
8th: A collapsing areas of showers and thunderstorms produced damaging wind gusts in Memphis, Texas. A peak wind gust of 75 mph was measured by the West Texas Mesonet site on the northeast side of town. To learn about the damage these severe winds caused CLICK HERE. 13th-17th: Rounds of severe storms visited the region in the middle of May. Estelline experienced baseball size hail and a wind gust to 68 mph as well as torrential rain on the 13th. The next day both Northfield and Childress recorded thunderstorm wind gusts in excess of 70 mph. On the 15th, baseball size hail fell in Crosbyton. Scattered thunderstorms produced additional large hail and damaging winds in the area the next couple of days. A more detailed write-up on these active weather days can be FOUND HERE.
19th: Slow-moving supercell thunderstorms generated giant hail and torrential rainfall. Southwest Lubbock was hard hit, with baseball size hail causing extensive damage. To learn about this active night CLICK HERE.
Entire Month: May 2018 was the hottest May on record in Lubbock and included 8 days over 100 degrees. Details about this scorching month can be VIEWED HERE.
JUNE:
1 June: An intense supercell thunderstorm, fueled by 100+ degree heat, generated very strong winds that destroyed several buildings at the Ralls Compress in Ralls, Texas. For more information, CLICK HERE.
3rd-4th: A large complex of overnight thunderstorms dropped widespread rain on the South Plains and Rolling Plains. Details on this overnight rainfall can be READ HERE. 7th: A cluster of thunderstorms exploded over the southeast Texas Panhandle. The slow-moving storms produced torrential rainfall, measured to 4.48" in Tell. Damaging winds and large hail also affected the southeast Texas Panhandle. A more detailed account of this event can be FOUND HERE.
12th-13th: A complex of thunderstorms brought welcome rain to the much of the southern Texas Panhandle into the northern Rolling Plains. A more detailed account of these rains can be READ HERE.
16th-17th: A broken line of thunderstorms dropped widespread rain on the Caprock. A more detailed account of this evening can be READ HERE.
29th-2nd July: Late June and early July brought several rounds of thunderstorms. A wind gust to 74 mph was recorded near Lake Alan Henry on June 29th. Read more about this active stretch of weather HERE.
JULY:
29th-2nd July: Late June and early July brought several rounds of thunderstorms. The entire region recorded at least a little rain, with pockets of 1 to 2+ inches. Read more about this active stretch of weather HERE.
Entire Month: Aside from the active start to the month, rain was difficult to come by during July.
AUGUST:
15th-20th: Several rounds of showers and thunderstorms brought welcome widespread rainfall to West Texas. Details on this welcome of rain can be FOUND HERE.
SEPTEMBER:
1st-7th: Several rounds of showers and thunderstorms brought widespread rain to the region. Many locations recorded between 1 and 2 inches of rain this first week of the month. Read more about these widespread rains HERE.
20th-27th: More widespread rains graced the South Plains region. Details on this wet fall stretch can be FOUND HERE.
OCTOBER:
5th: Scattered severe thunderstorms tracked across the central South Plains and southern Texas Panhandle. Golf ball size hail was observed in Claytonville and power lines were blown down in Lubbock. Read more about this round of severe weather HERE.
6th-8th: A strong storm system combined with a frontal zone to bring several rounds of showers and thunderstorms. Rain totals of 1 to 3 inches were common. In addition, one supercell thunderstorm generated two brief tornadoes north of Dimmitt on the 7th. Read more about this active stretch HERE.
12th-13th: The remnants of Hurricane Sergio brought widespread rain to the region, with 1 to 2 inches falling across the southeast South Plains into the Rolling Plains. Additional details about this event can be READ HERE.
24th: A large complex of rain brought a half inch to inch of rain to the region. Learn more about this round of rain HERE.
NOVEMBER:
11th-12th: Cold temperatures and a passing upper level storm system brought the first round of wintry weather to the region. Snow totals of 1 to 4 inches of snow fell across the southern Texas Panhandle. Details about this first taste of winter weather can be FOUND HERE.
DECEMBER:
7th-8th: A band of heavy wet snow developed over the region late on the 7th and continued into the 8th. 5 to 8+ inches of snow fell over much of the South Plains into the central Rolling Plains. Lubbock was squarely under the heaviest band of snow with 8 to 11 inches recorded. Read more about this round of snow HERE.
13th: Strong to severe northerly winds raked the South Plains behind a departing potent upper level storm system. A wind gust as high as 66 mph was recorded at Caprock Canyons State Park. Read more on this windy day HERE.
26th: A spring-like storm system brought a couple of rounds thunderstorm to West Texas. Small hail and gusty winds accompanied the strongest storms. A brief tornado was also observed just east of Afton. Read more on these rare late December thunderstorms HERE.


 The main weather themes of 2018 were the overall warmth and the wet fall. The year ended as the 9th warmest on record, finishing with an average yearly temperature of 62.2 degrees. Precipitation was intermittent and sparse through the spring and summer in most spots, but became more robust and widespread in the fall. The late year wetness helped subdue the emerging and somewhat persistent drought. 15.27 inches of precipitation fell at Lubbock during 2018, which was the 41st driest in the historical record, almost 4 inches below average.
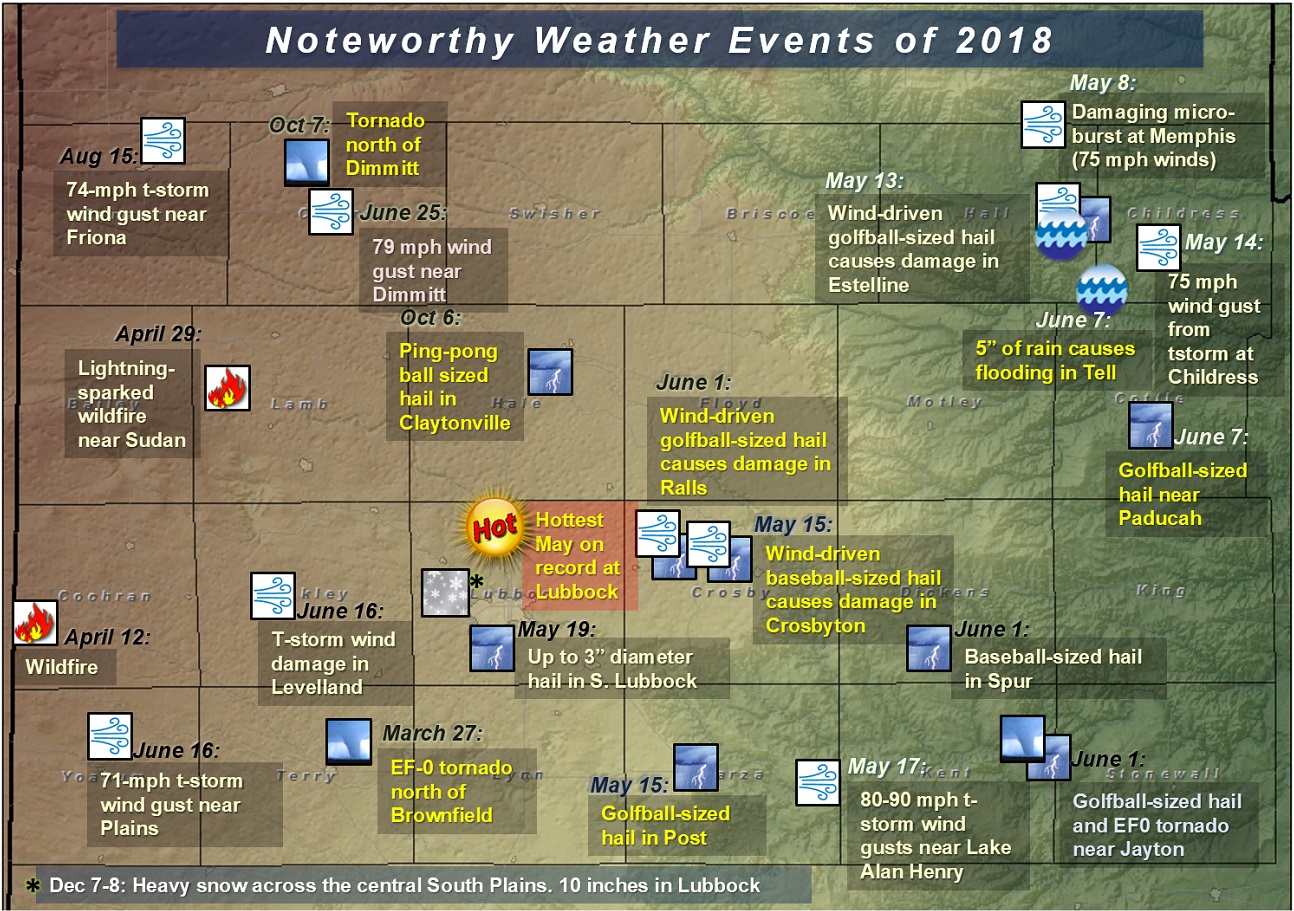

