| Snow Amount Potential
Experimental - Leave feedback
|
|
| Expected Snowfall - Official NWS Forecast
Point Range
What's this?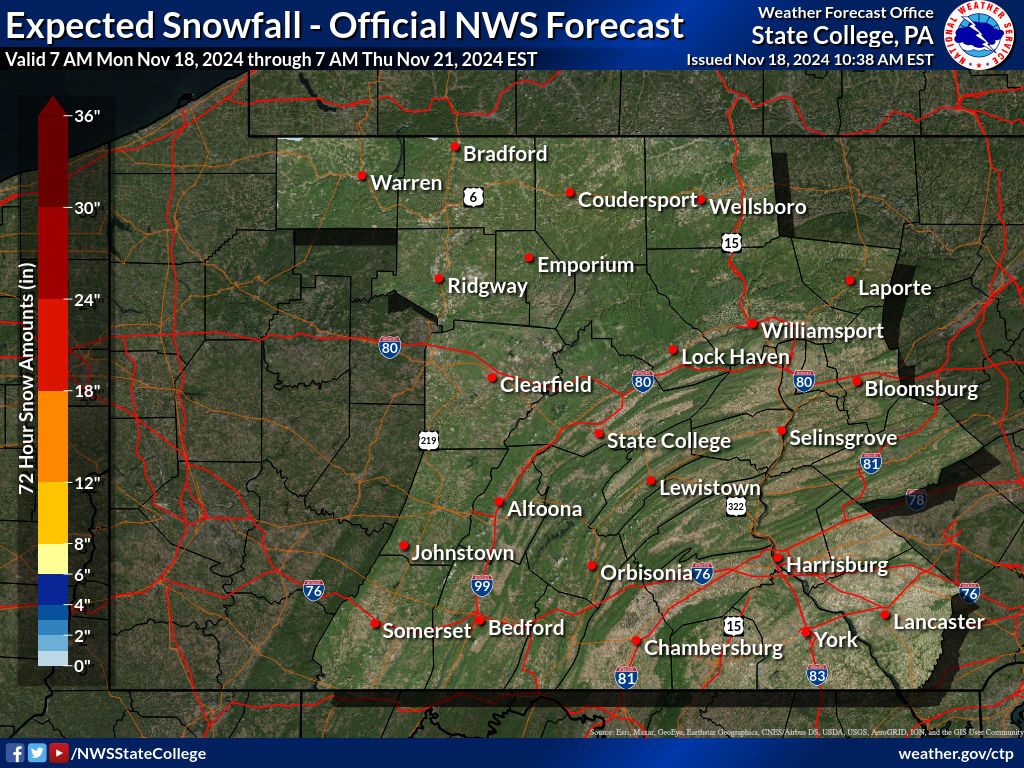 |
High End Amount 1 in 10 Chance (10%) of Higher Snowfall 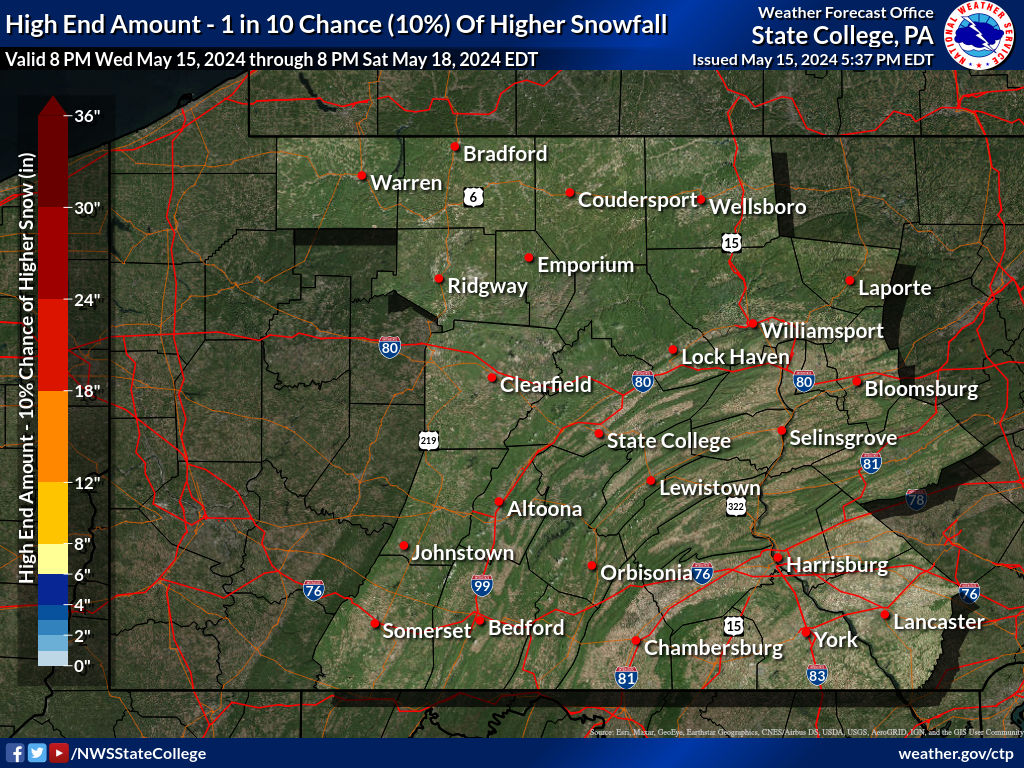 What's this? |
| Low End Amount 9 in 10 Chance (90%) of Higher Snowfall 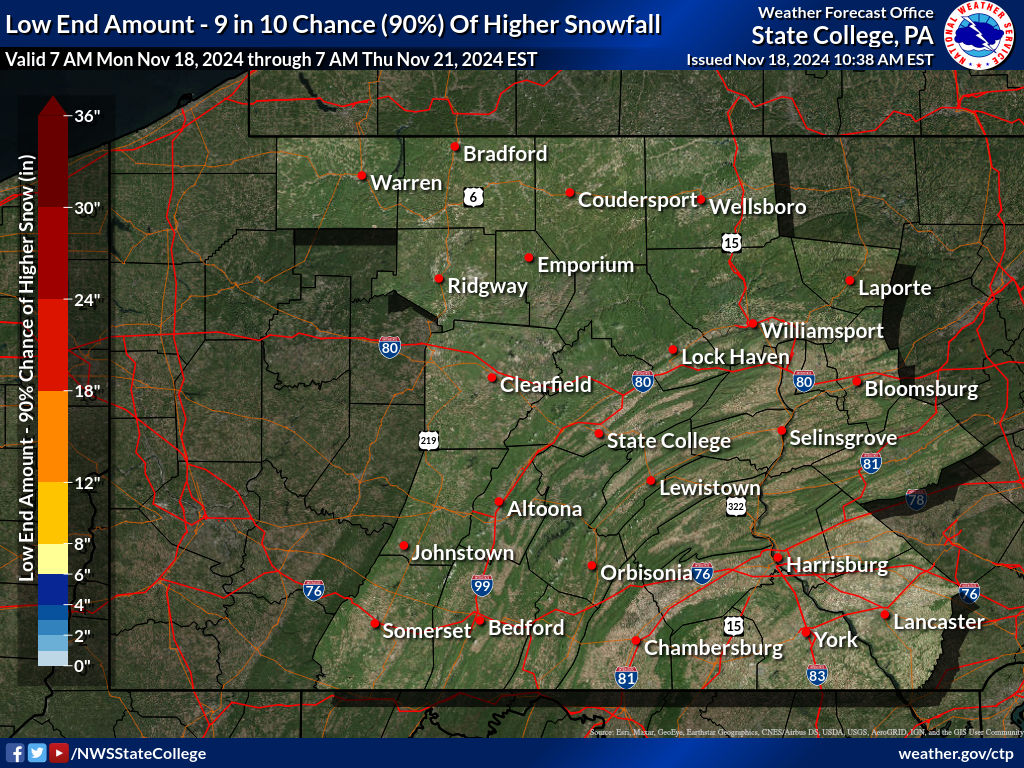 What's this? |
|
|
For more information visit this project's Product/Service Description Document. Please provide us your feedback here. |
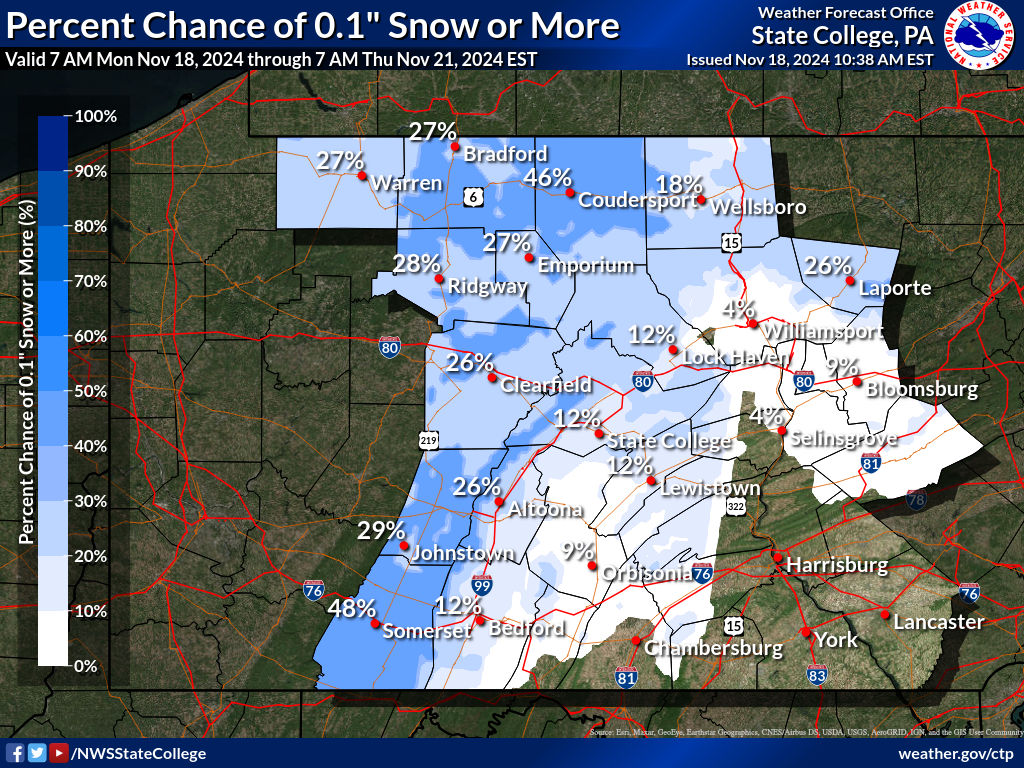
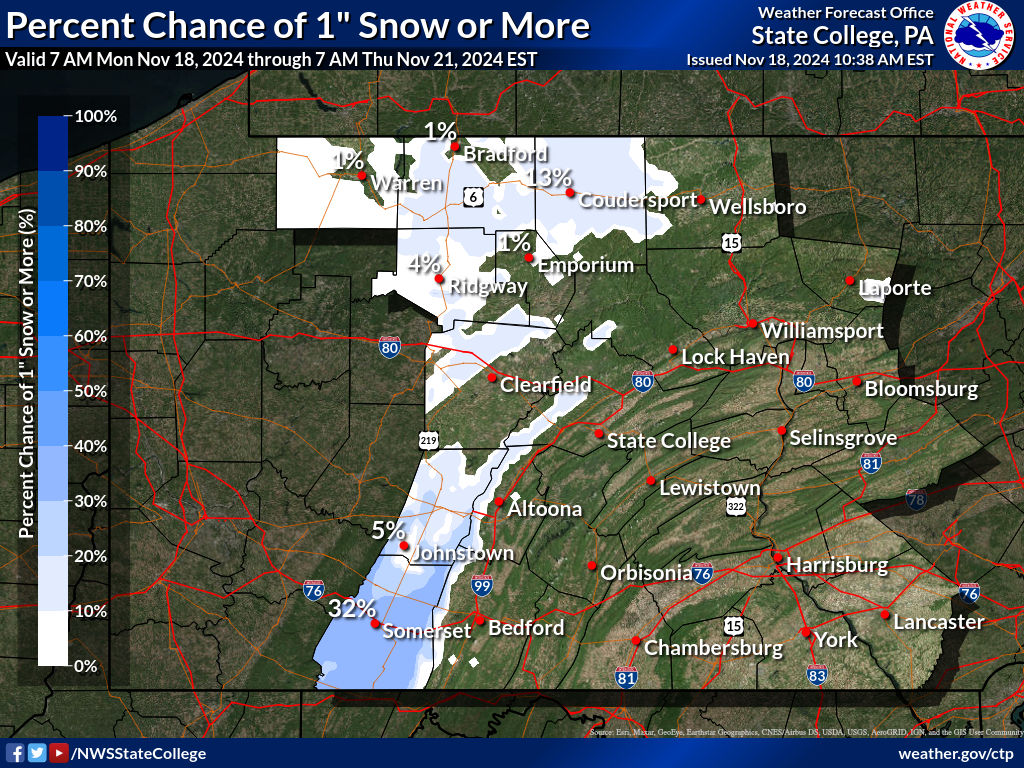
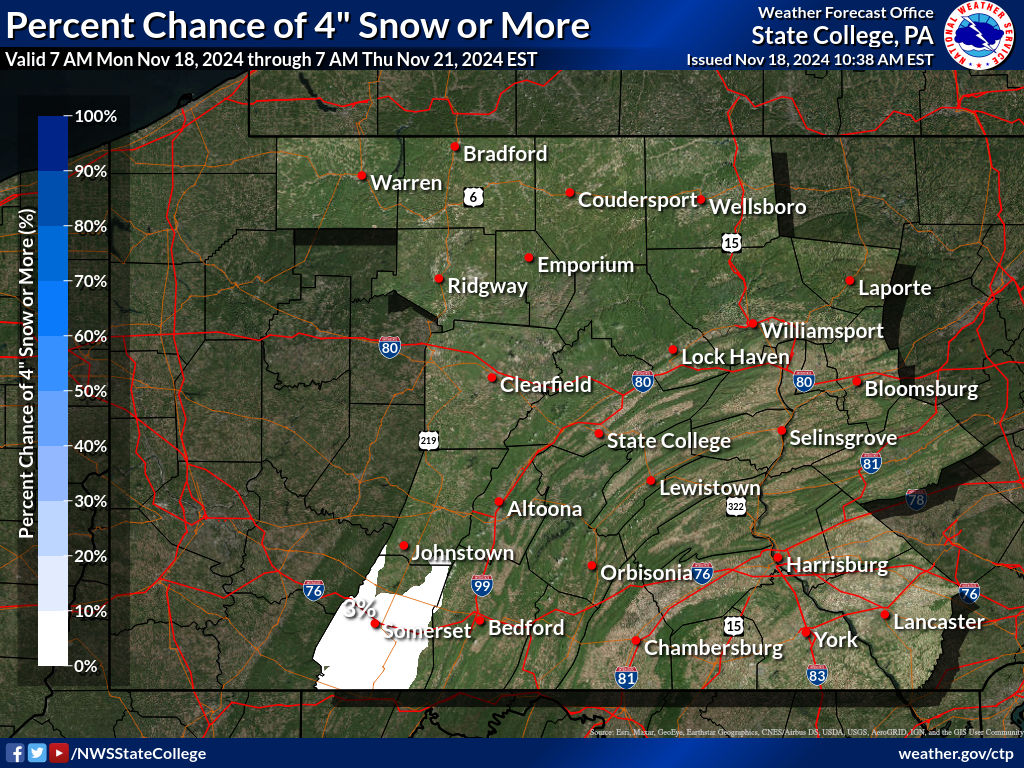
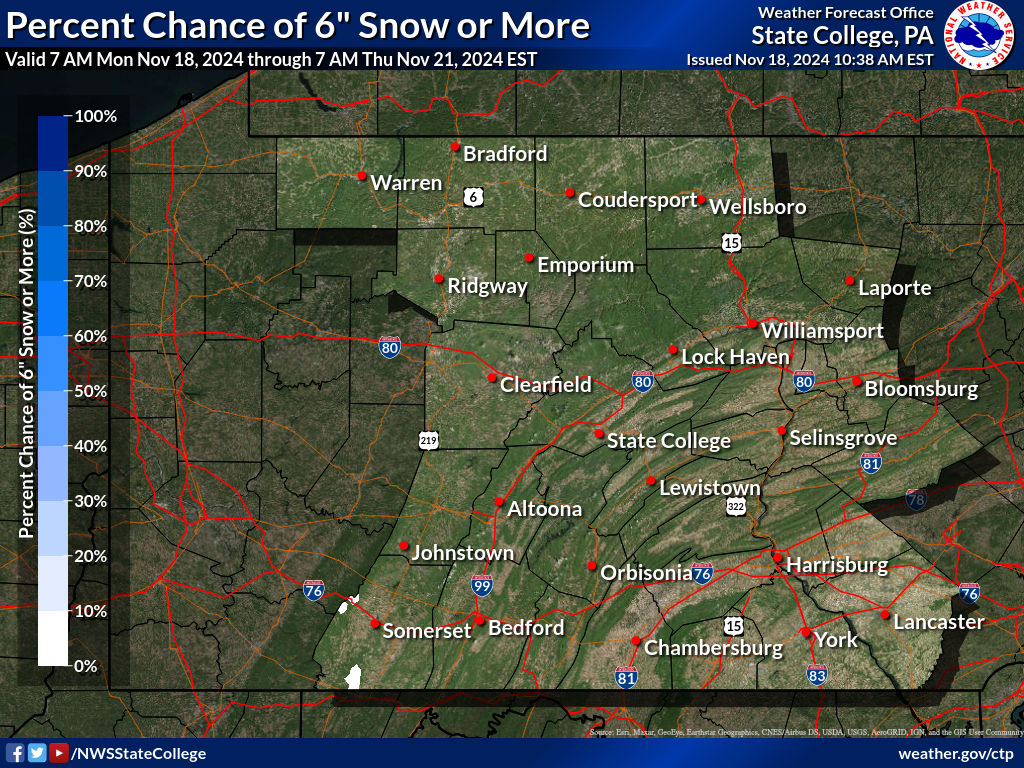
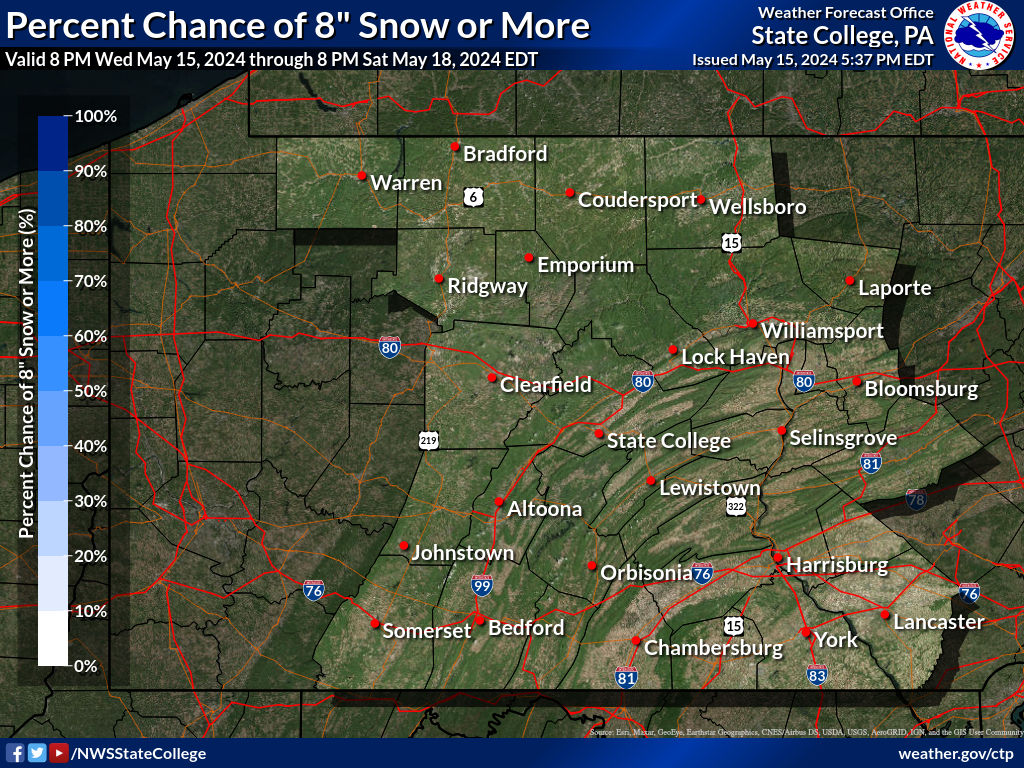
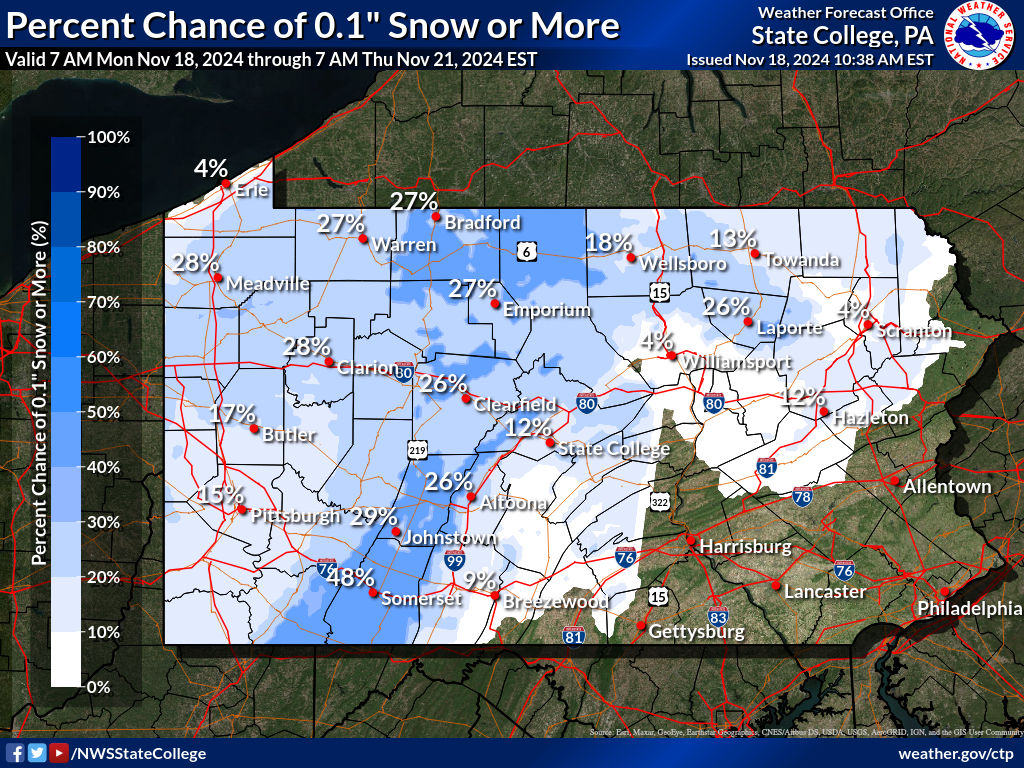
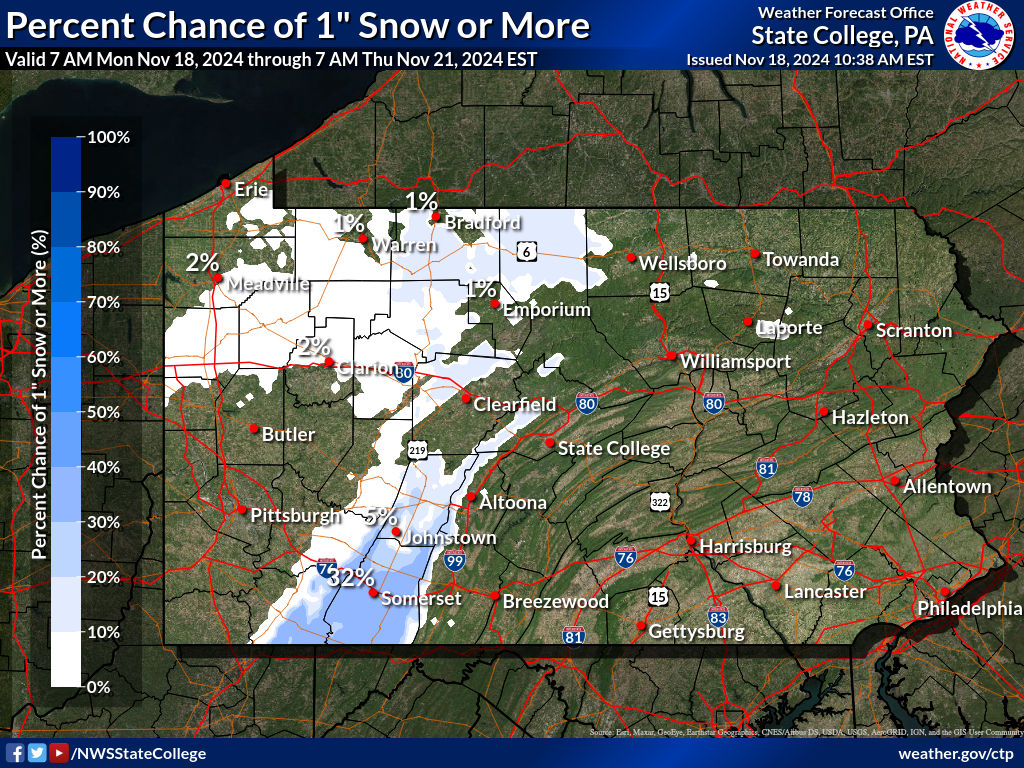
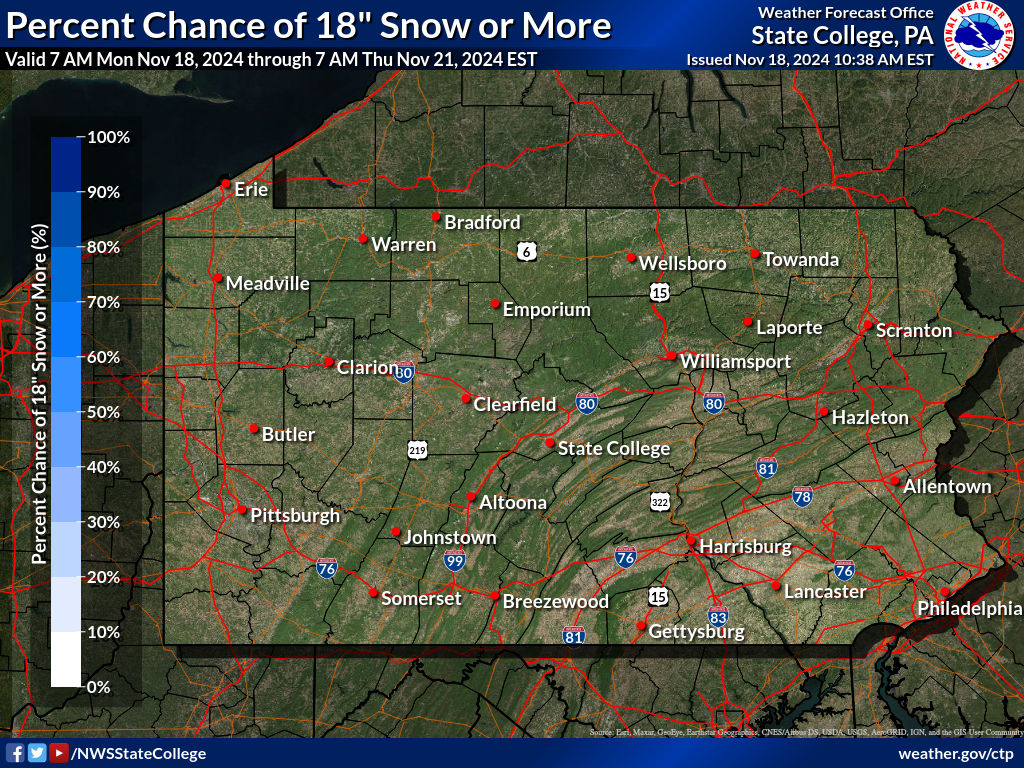
| Percent Chance That Snow Amounts Will Be Greater Than...
Experimental - Leave feedback
|
||||||||||||||||
|
Hover over thumbnails below to view larger image.
|
||||||||||||||||
| Snowfall Totals by Location
Experimental - Leave feedback
|
|
|
| Snow Amount Potential
Experimental - Leave feedback
|
|
| Expected Snowfall - Official NWS Forecast
Point Range
What's this?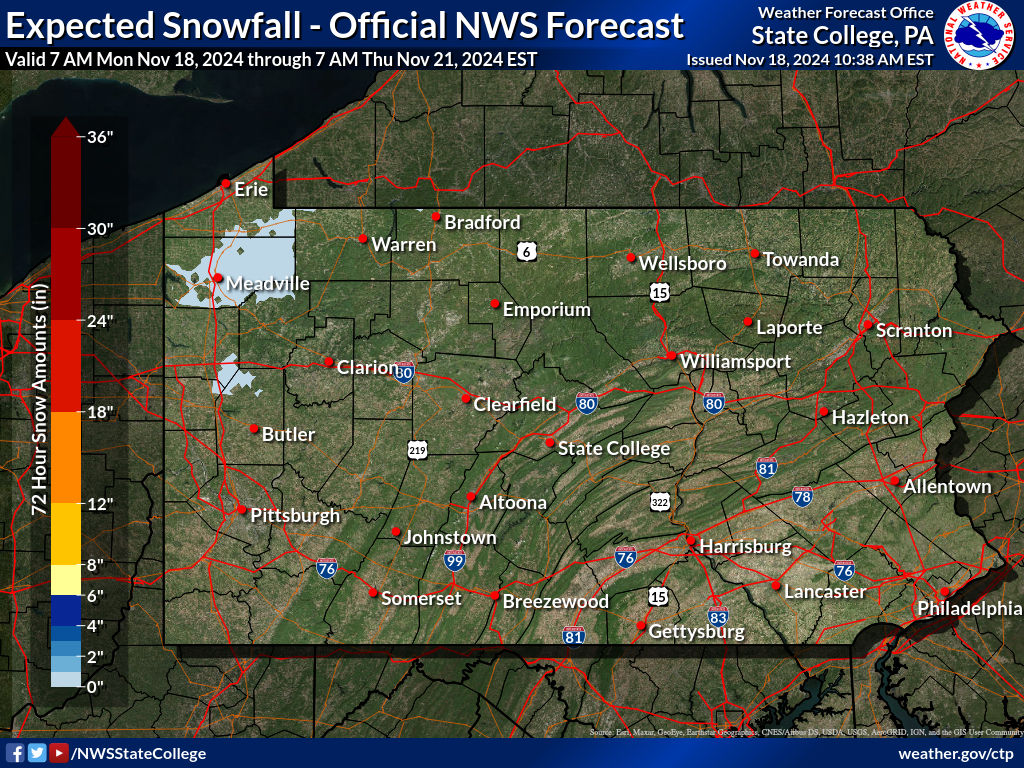 |
High End Amount 1 in 10 Chance (10%) of Higher Snowfall 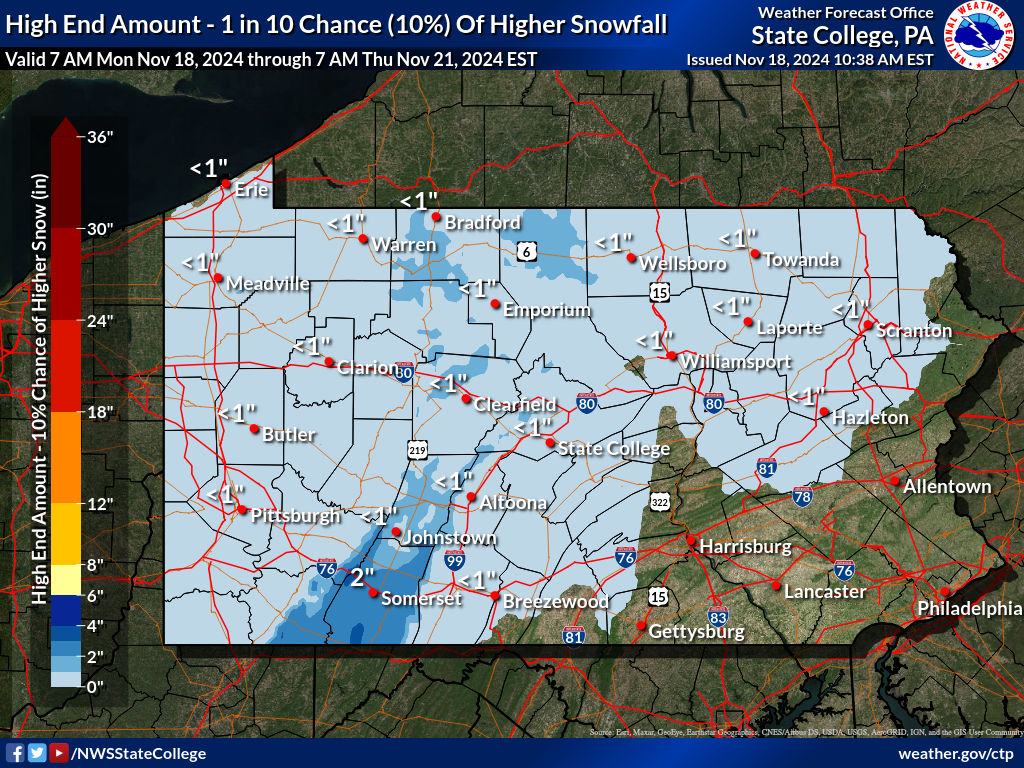 What's this? |
| Low End Amount 9 in 10 Chance (90%) of Higher Snowfall 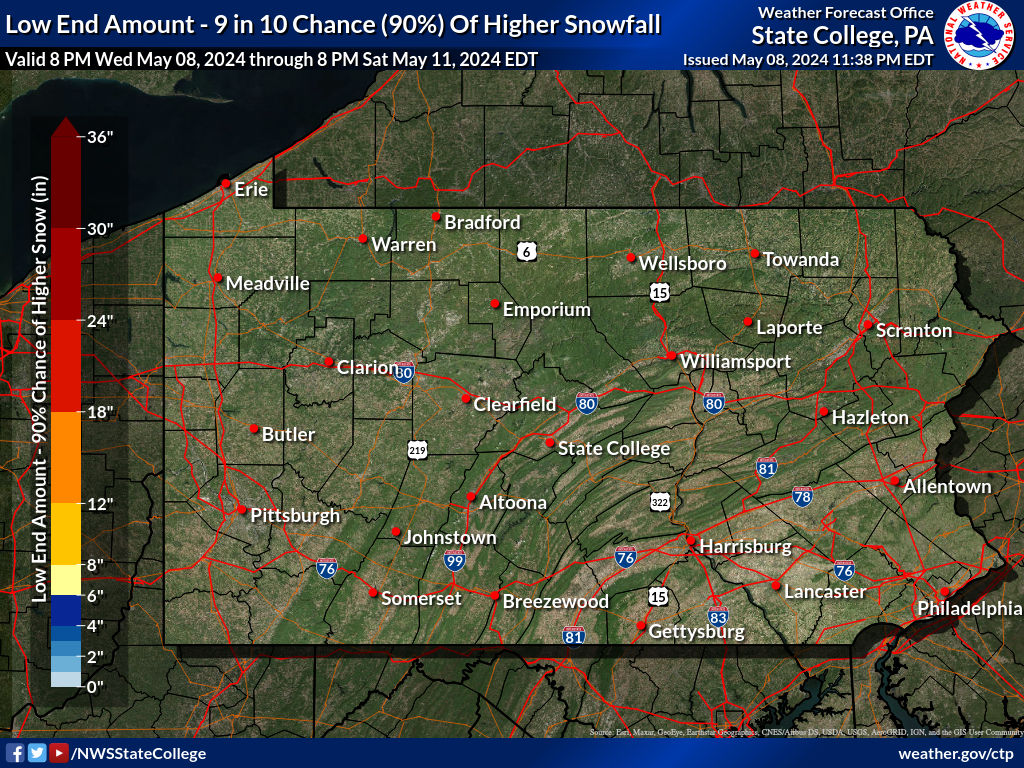 What's this? |
|
|
For more information visit this project's Product/Service Description Document. Please provide us your feedback here. |
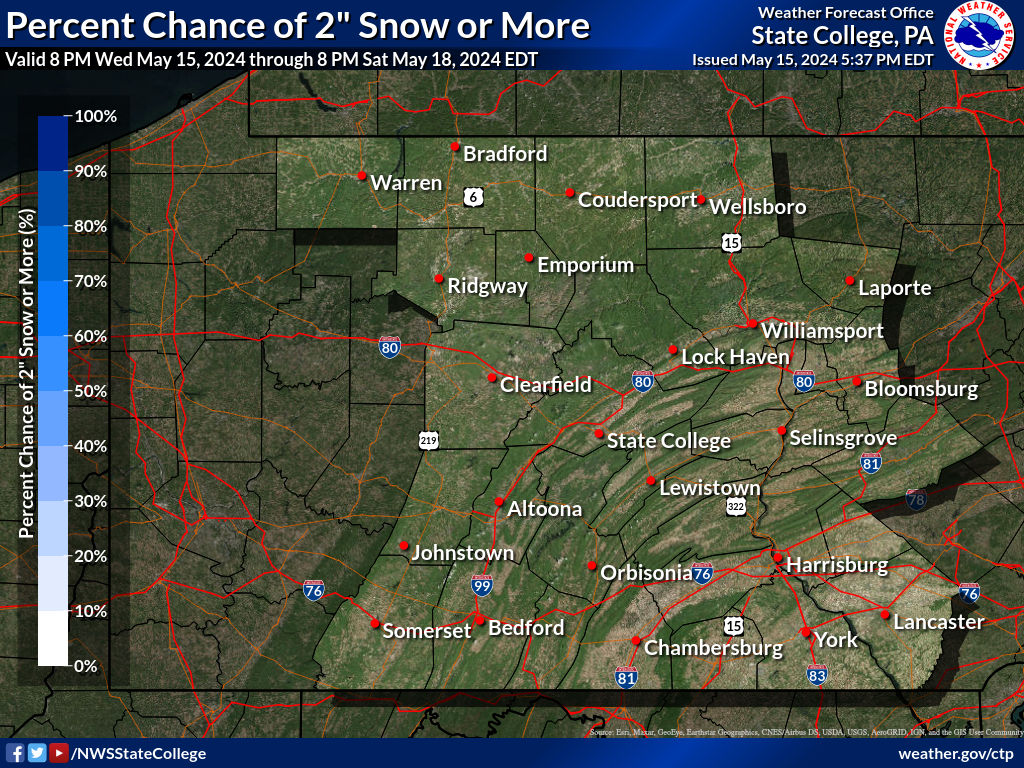
| Percent Chance That Snow Amounts Will Be Greater Than...
Experimental - Leave feedback
|
||||||||||||||||
|
Hover over thumbnails below to view larger image.
|
||||||||||||||||
| Ice Accumulation Potential
|
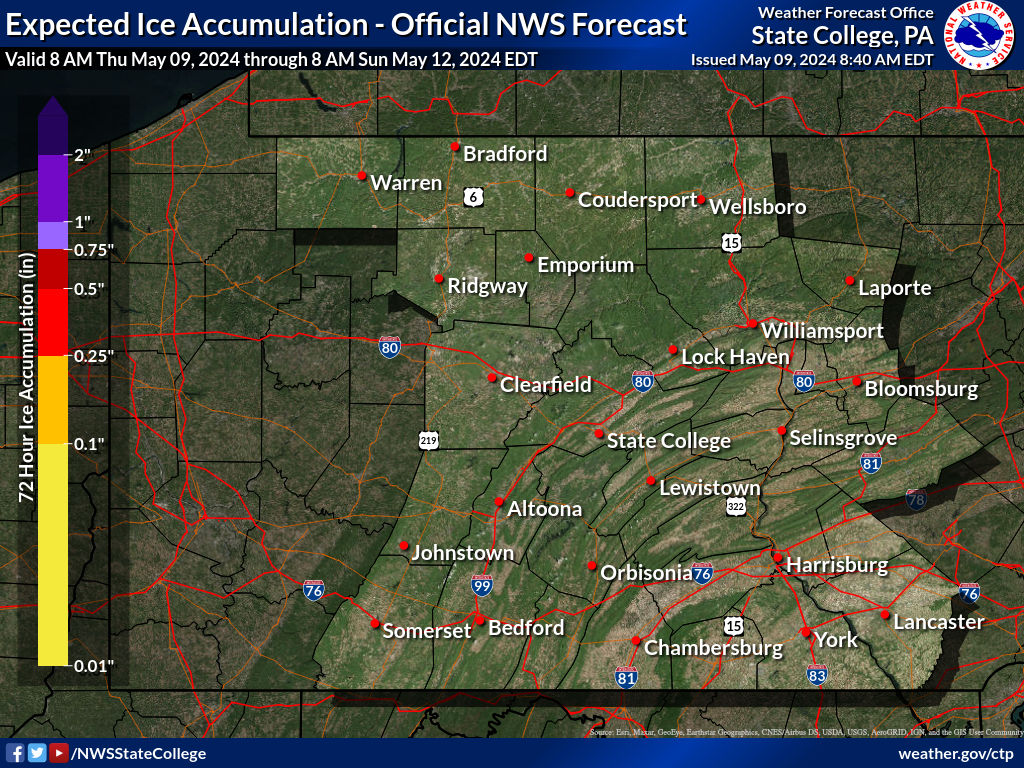
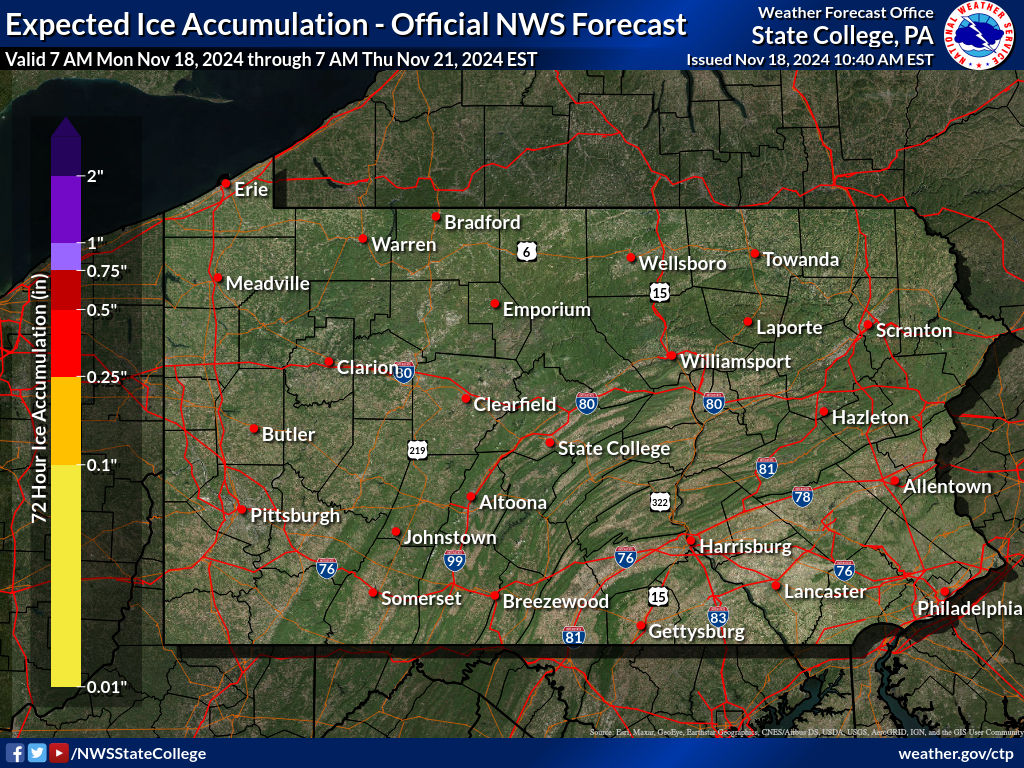
Expected Ice Accumulation - Official NWS Forecast |
|---|
 What's this? |
| Ice Accumulation Potential
|
Expected Ice Accumulation - Official NWS Forecast |
|---|
 What's this? |
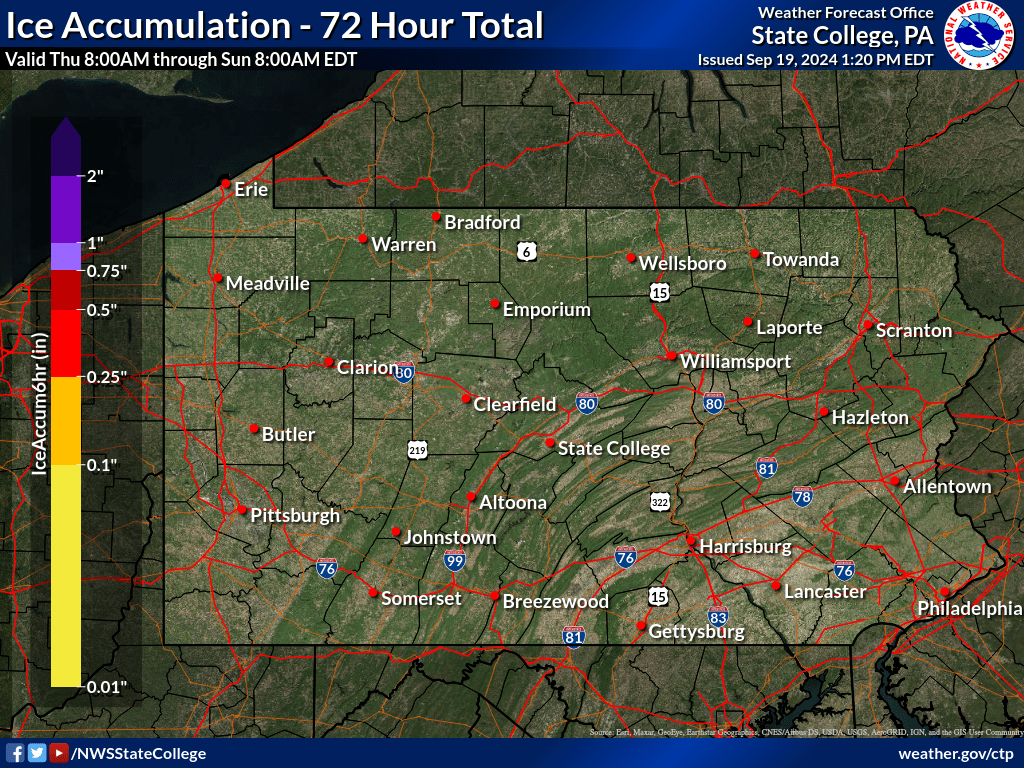
| 72 Hour Snowfall / Ice Accumulation Forecasts | ||
| 72 Hour Snowfall Forecast | 72 Hour Ice Accumulation Forecast | |
|---|---|---|
 |
 |
|
| 12 Hour Snowfall / Ice Accumulation Forecasts | ||
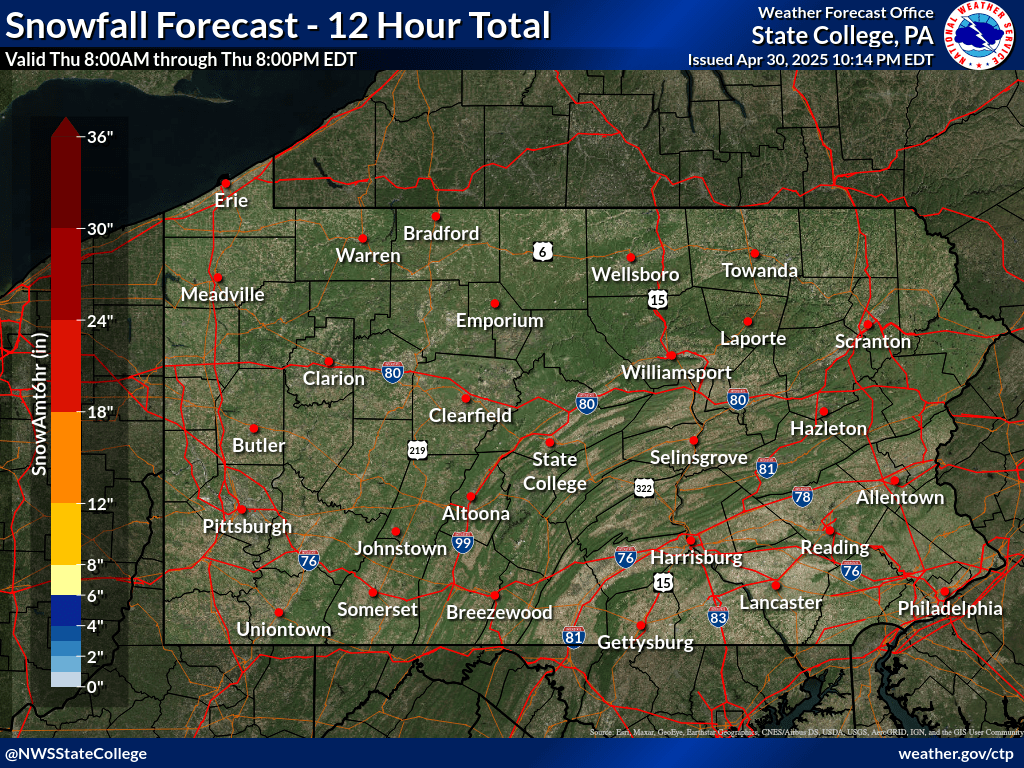
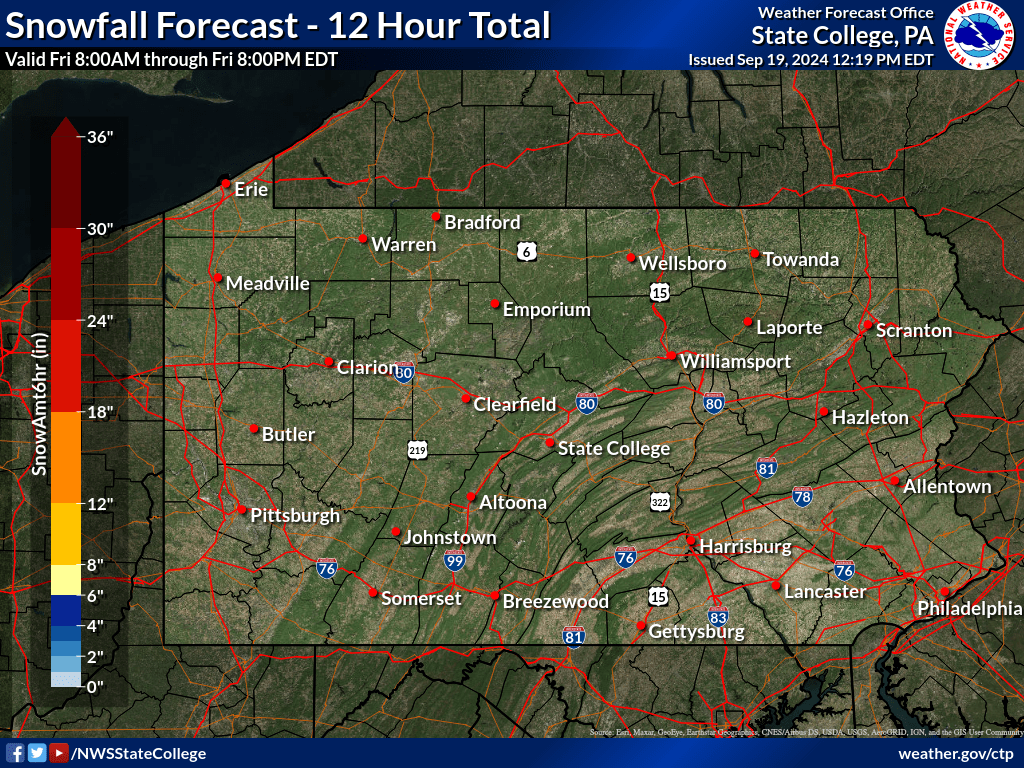
| 12 Hour Snowfall Forecasts (through 72 Hours) | |||||
|---|---|---|---|---|---|
| 0 to 12 Hours | 12 to 24 Hours | 24 to 36 Hours | 36 to 48 Hours | 48 to 60 Hours | 60 to 72 Hours |
 |
 |
 |
 |
 |
 |
| 12 Hour Ice Accumulation Forecasts (through 72 Hours) | |||||
|---|---|---|---|---|---|
| 0 to 12 Hours | 12 to 24 Hours | 24 to 36 Hours | 36 to 48 Hours | 48 to 60 Hours | 60 to 72 Hours |
 |
 |
 |
 |
 |
 |
| Days 4-7 Winter Weather Outlook | |
|
Days 4-7 |
|
| Day 4 Winter Weather Outlook | Day 5 Winter Weather Outlook |
 |
 |
| Day 6 Winter Weather Outlook | Day 7 Winter Weather Outlook |
 |
 |
| Days 4-7 Precipitation Forecast | |
| Days 4-5 Forecast Precipitation | Days 6-7 Forecast Precipitation |
 |
 |
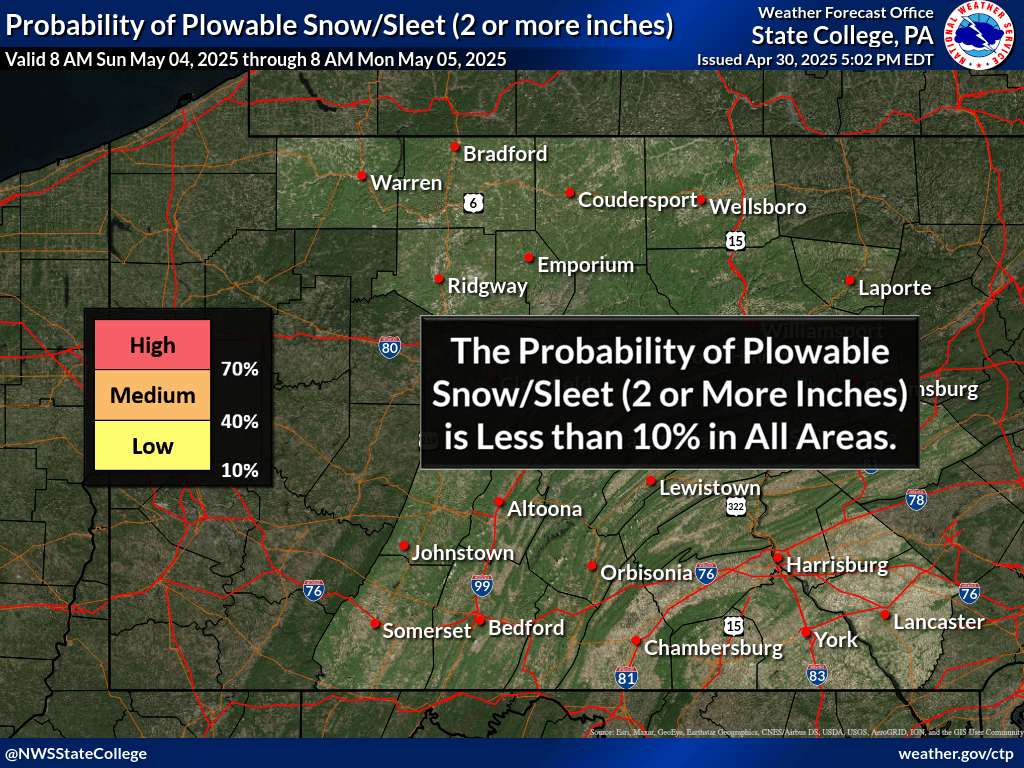
| CPC Week-2 Experimental Heavy Snow Risk | |
 |
|
| CPC Temperature & Precipitation Maps | |
|
Days 6-10 |
|
| Temperature | Precipitation |
 |
 |
|
Days 8-14 |
|
| TEMPERATURE | PRECIPITATION |
 |
 |
|
Week 3-4 |
|
|
TEMPERATURE |
PRECIPITATION |
 |
 |
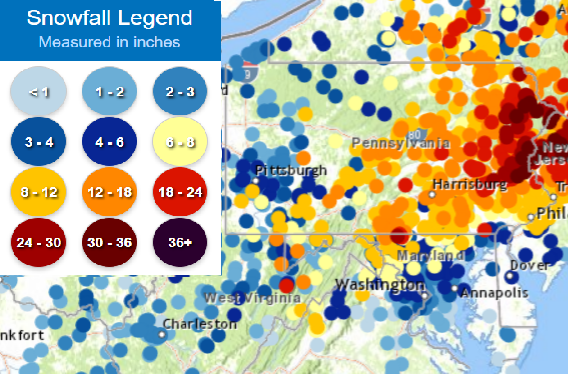
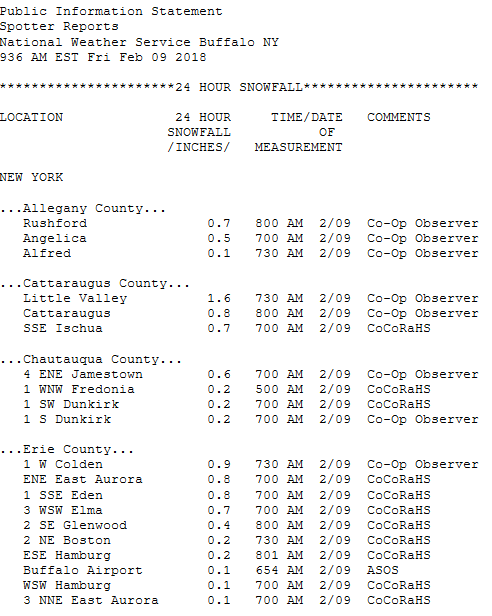
| Daily Snow / Ice Reports | ||
Reported Snow/Ice Totals |
Text Reported Snow/Ice Totals |
Snow/Ice Analysis |
|---|---|---|
 |
 |
 |
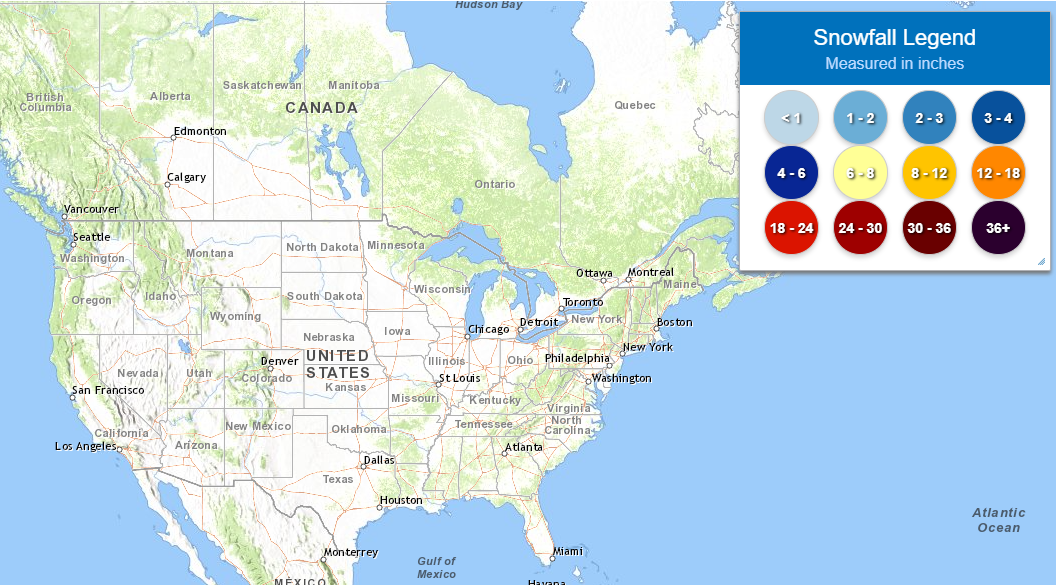
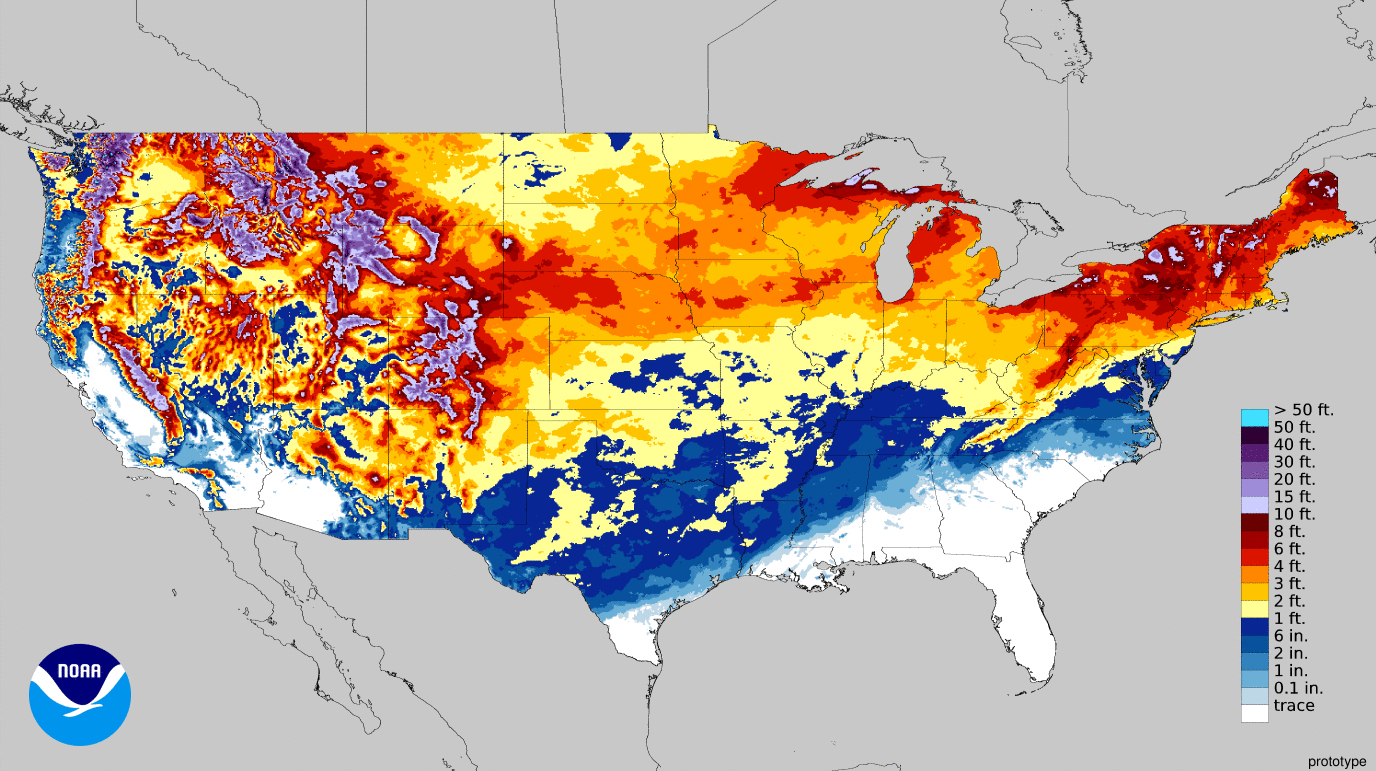
| National Snowfall Reports/Analysis | ||
| National Snow Reports | National Snowfall Analysis | |
|---|---|---|
 |
 |
|
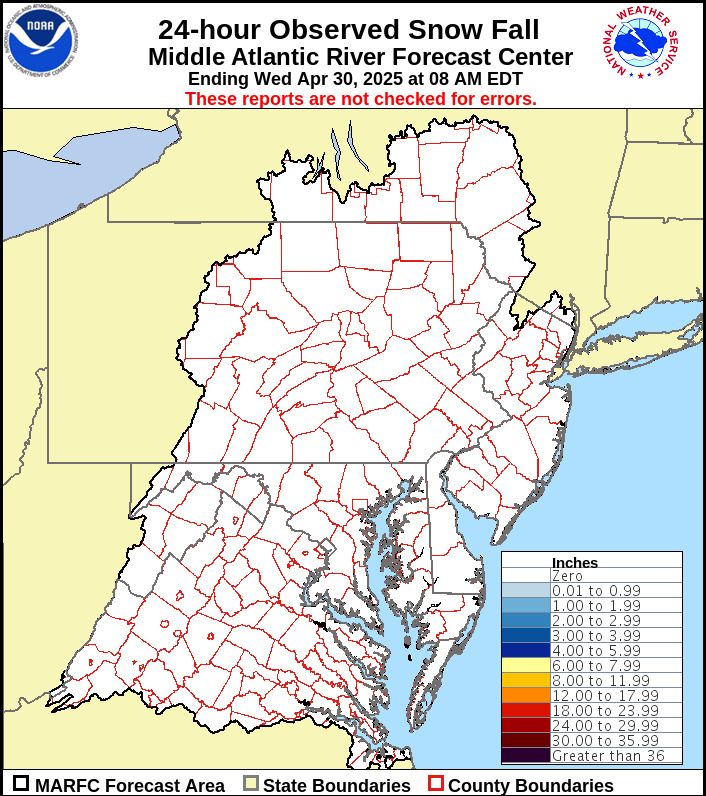
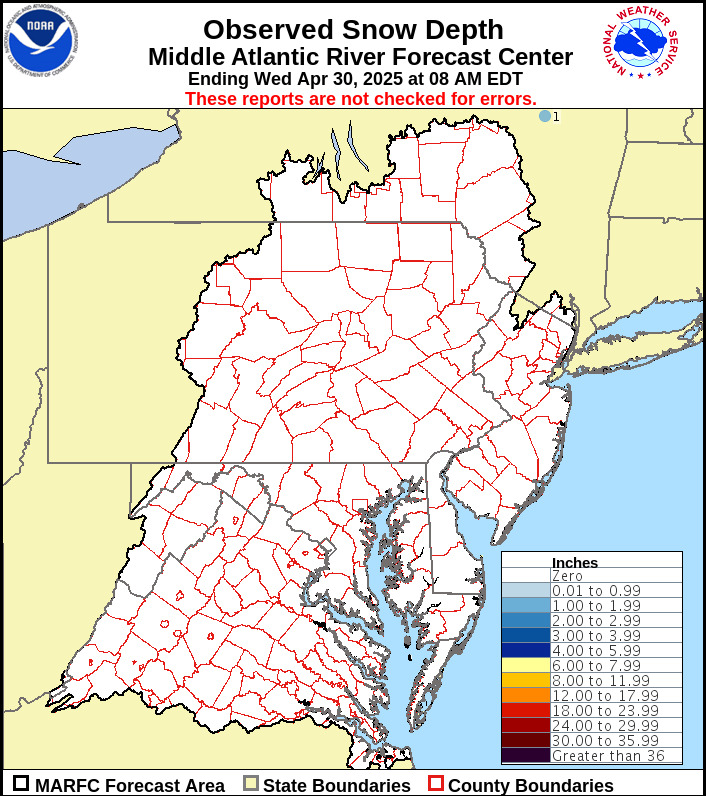
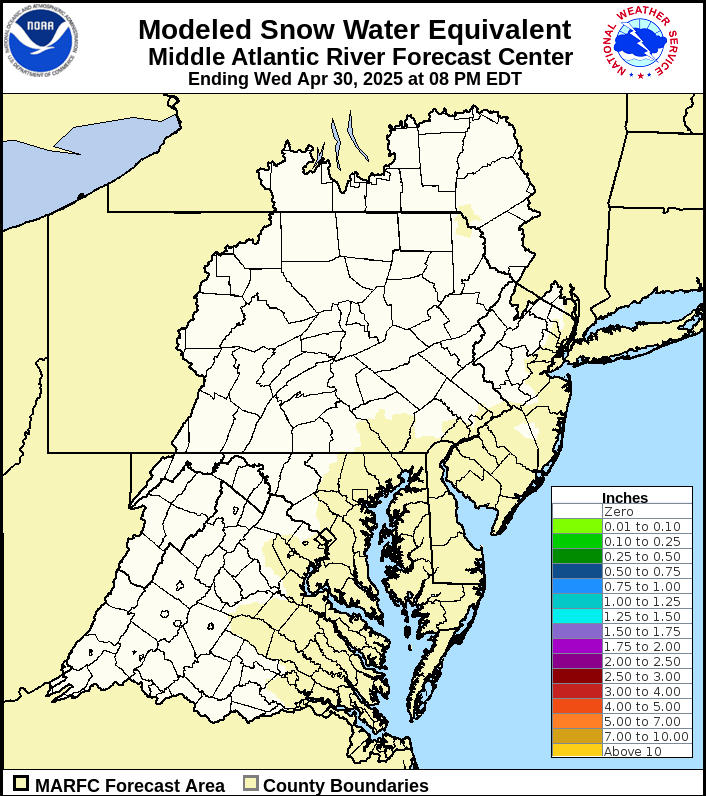
| From the Middle Atlantic River Forecast Center | ||
24-hr Observed |
Observed Snow Depth |
Modeled Snow Water Equivalent |
|---|---|---|
 |
 |
 |
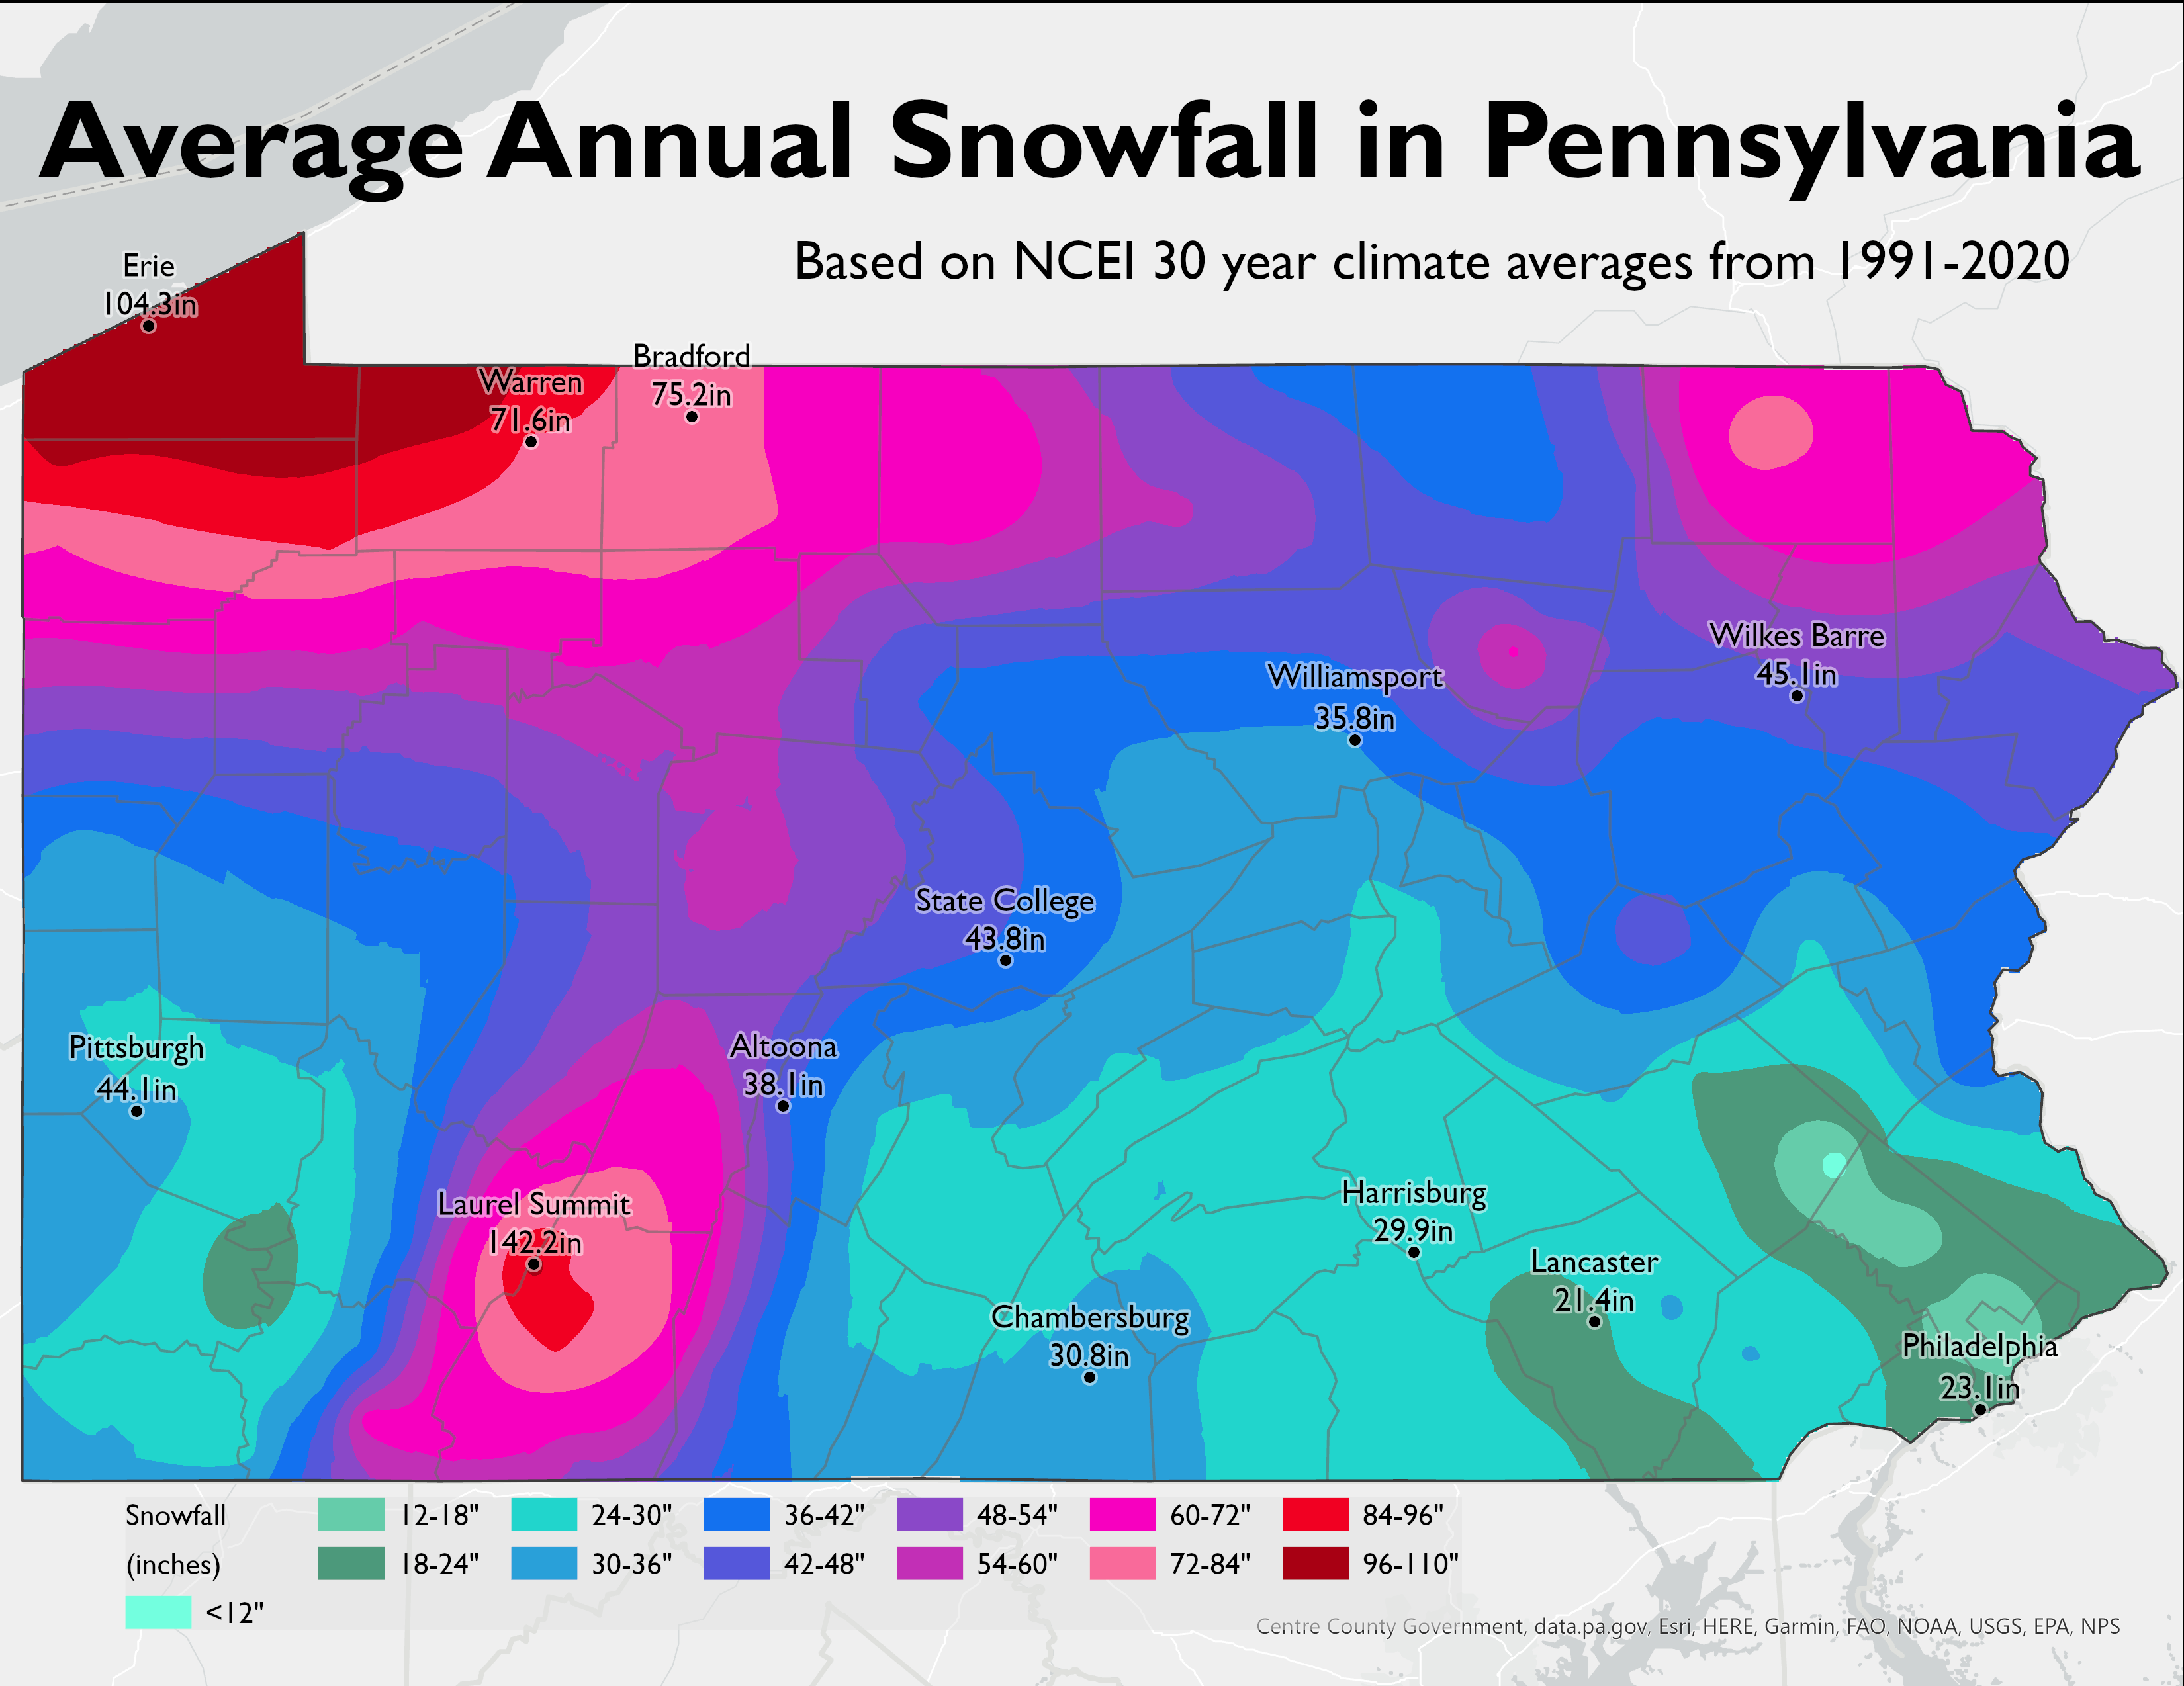
| Average Snowfall (30-Year Average / 1991-2020) | ||
 |
** EXPERIMENTAL ** EXPERIMENTAL ** EXPERIMENTAL **Day 4-7 Winter Weather Outlook(Winter Liquid Equivalent Exceedance Graphics) |
| Day 4 | Day 5 | Day 6 | Day 7 | |
|---|---|---|---|---|
 |
 |
 |
 |
|
|
||||
|
These images are created using WPC Probability of Exceeding 0.25"
|
| High | High Threat for a Plowable Snow. Potential impacts include travel delays and closures. Plan ahead to minimize impact on you and your family. |
|---|---|
| Medium | Moderate Threat for a Plowable Snow. Primary threat is disruption to travel. |
| Low | Slight Threat for a Plowable Snow. If threat materializes, may cause travel disruptions. |
| None | No significant winter storm threat is currently expected. However, light wintry precipitation may still be possible. |
| Precipitation Onset/End Timing | ||
| Onset of Wintry Precipitation | End Timing of Wintry Precipitation | |
|---|---|---|
 |
 |
|
| What's this? | What's this? | |
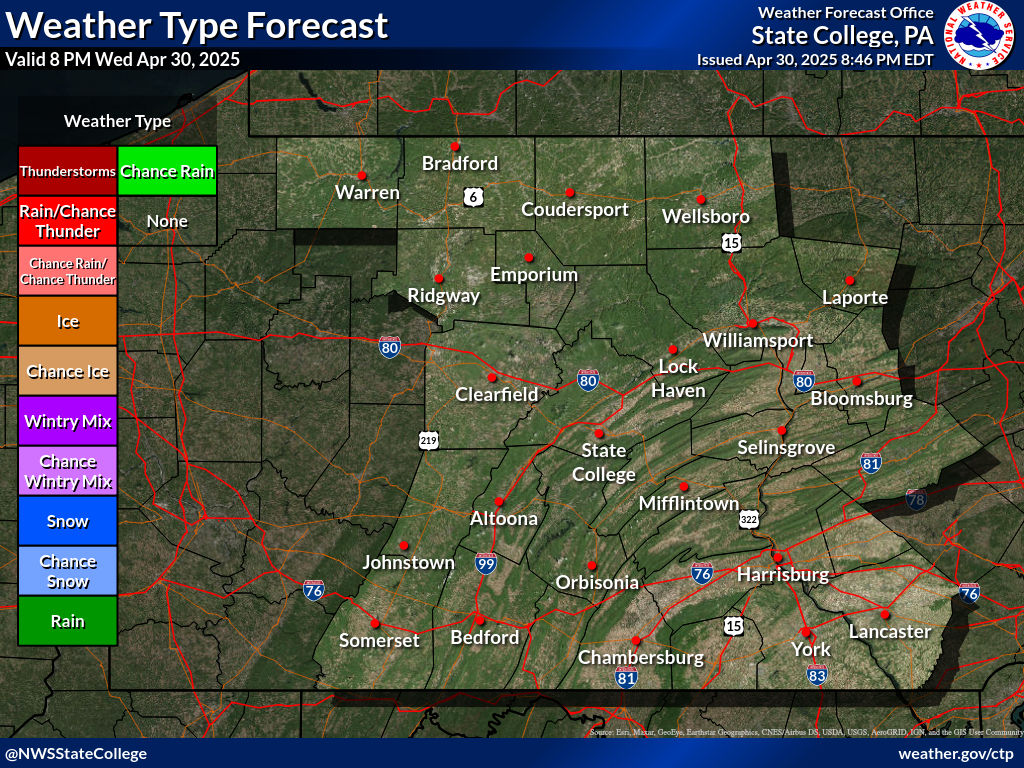
| Weather Type and Coverage Forecast |
**Prototype Under Development** **Not to be relied on for operational decision making**
|
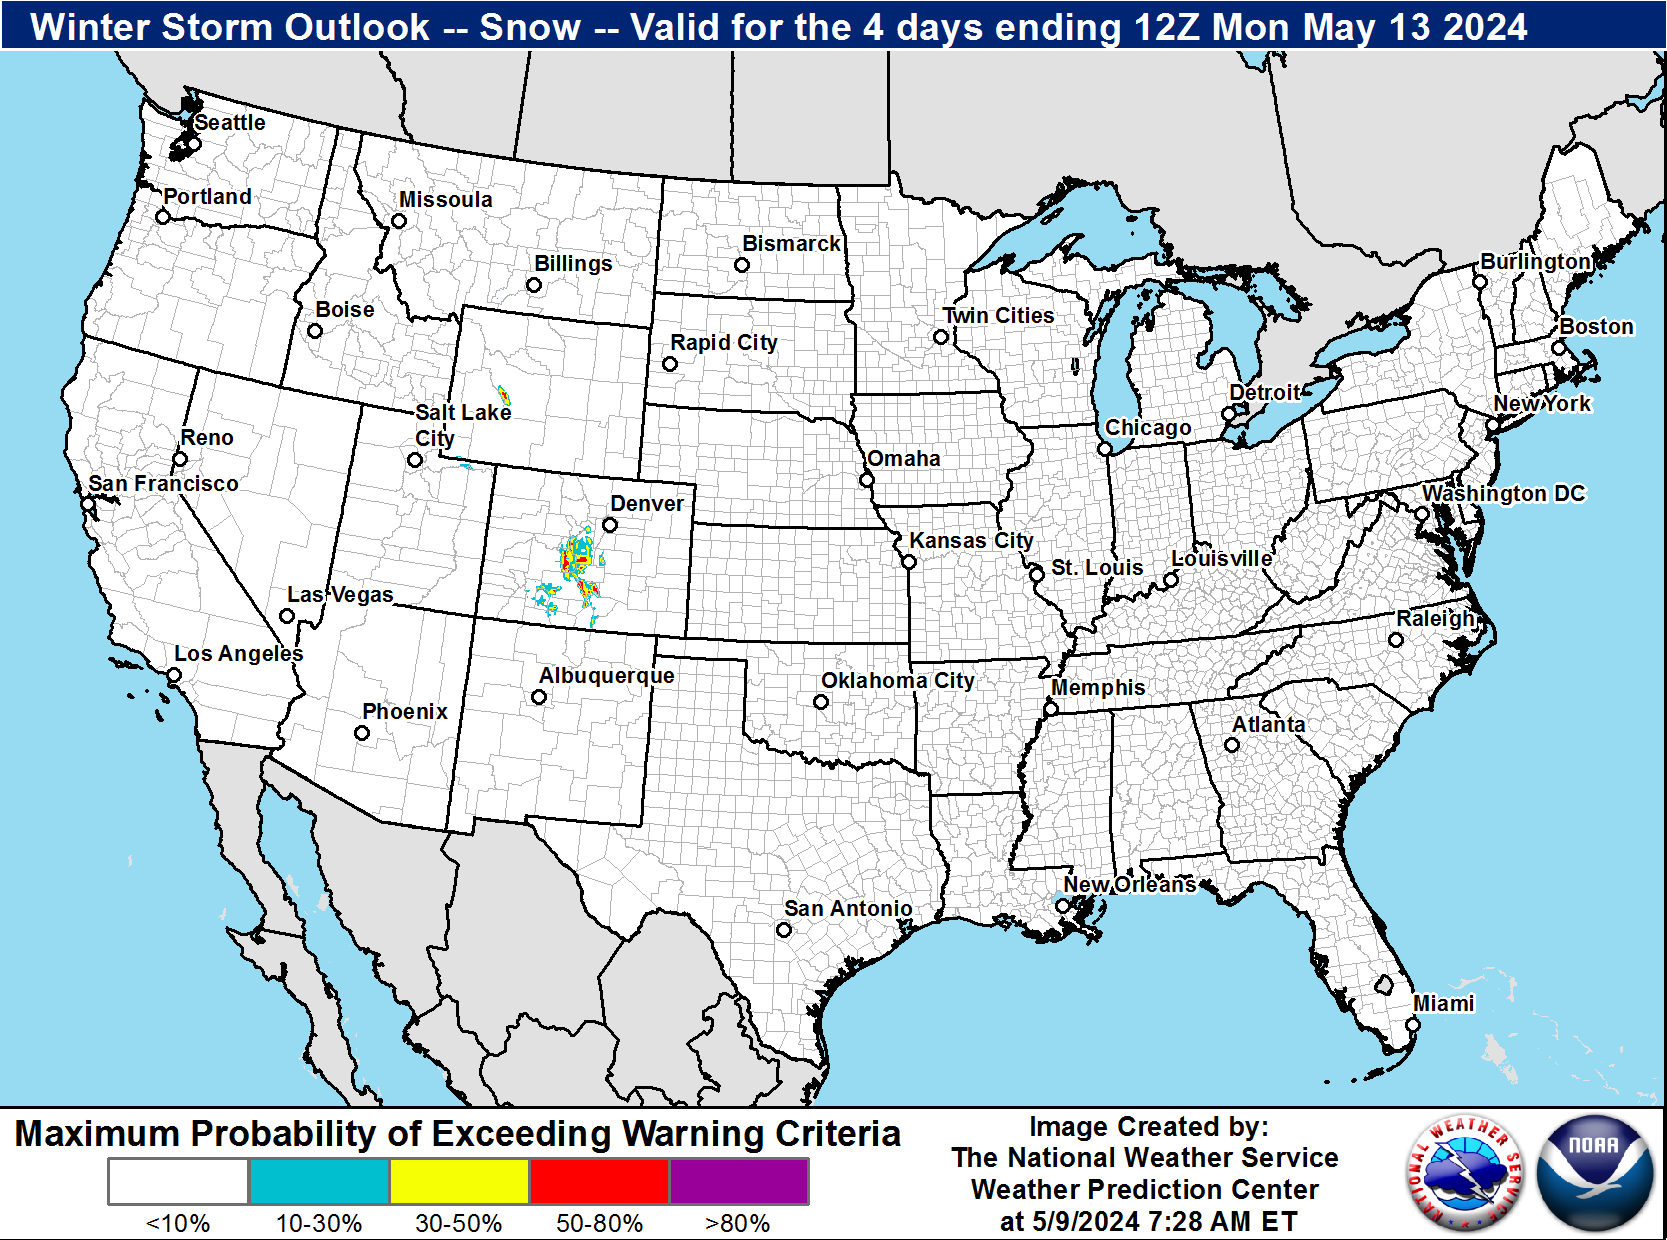
| Winter Storm Outlook (WSO) | |
|
|
|
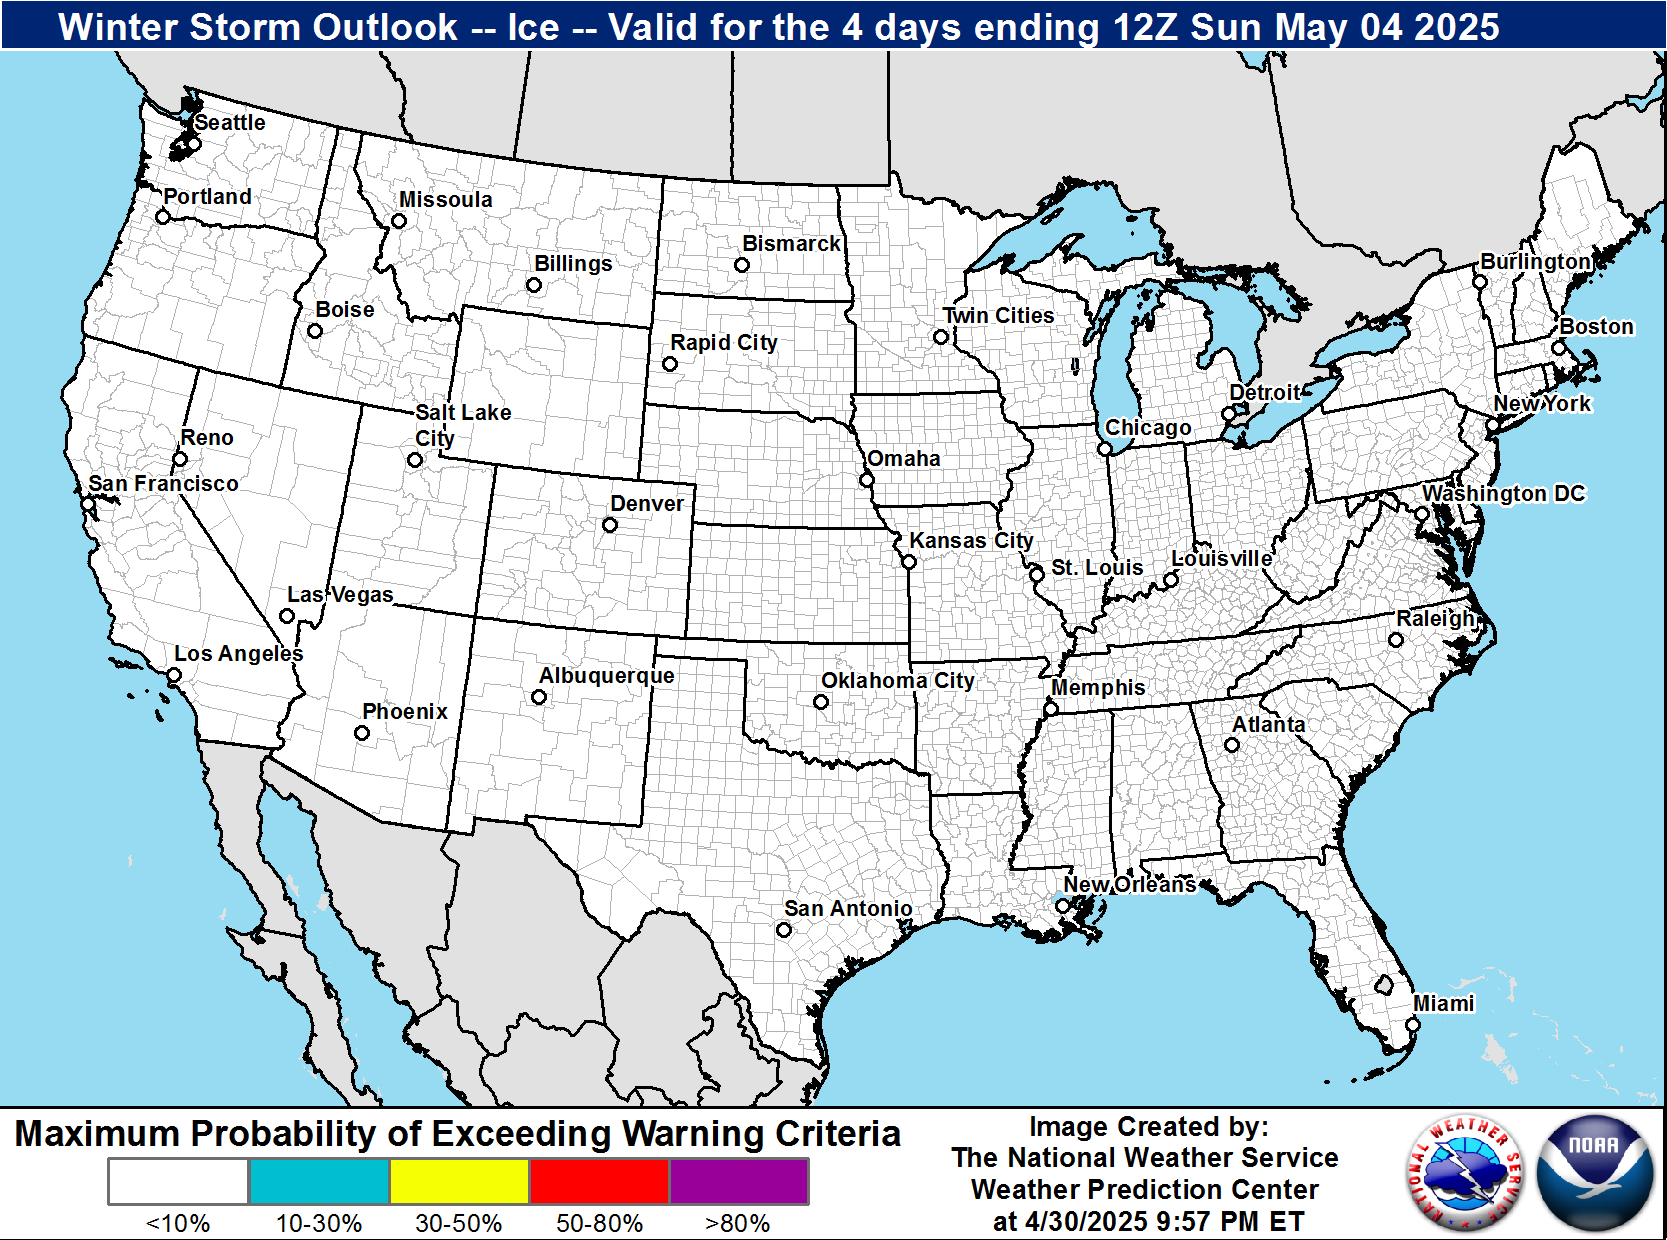
| Winter Storm Outlook (WSO) for Snow |
Winter Storm Outlook (WSO) for Ice |
|---|---|
|
|
|
| Winter Storm Severity Index (WSSI) | |
|
|
|
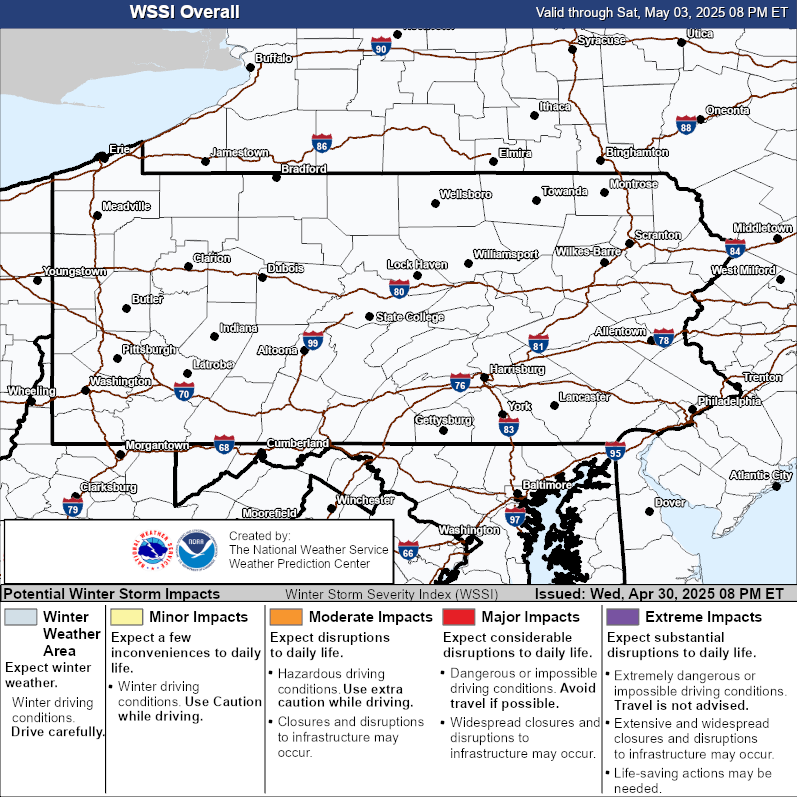
| Winter Storm Severity Index (WSSI) Overall Impact |
|
|---|---|
|
|
|
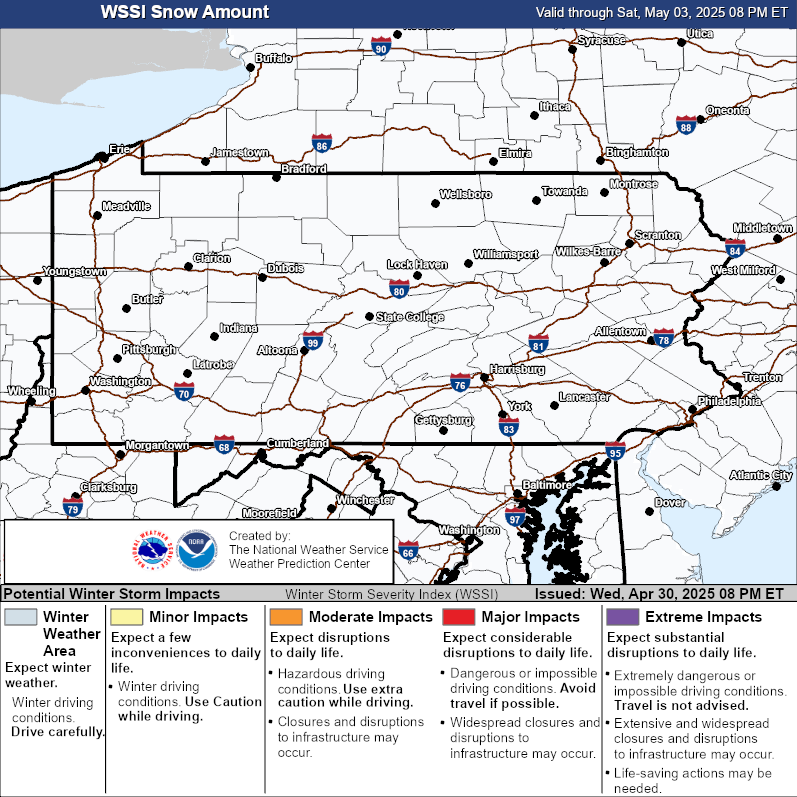
| Winter Storm Severity Index (WSSI) Snow Amount |
Winter Storm Severity Index (WSSI) Ice Accumulation |
|
|
|
| Winter Storm Severity Index (WSSI) Snow Load |
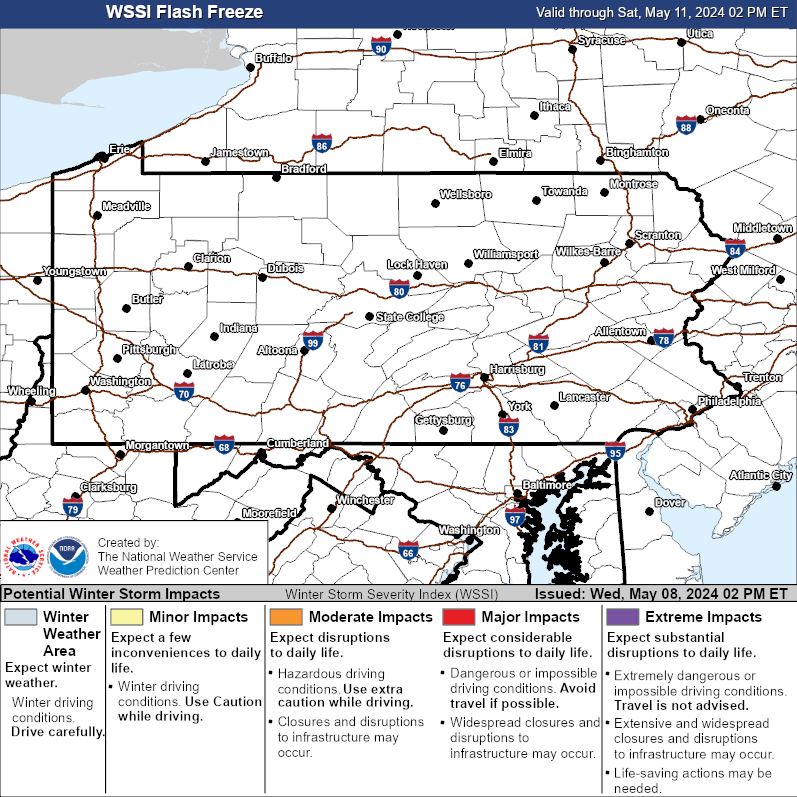
Winter Storm Severity Index (WSSI) Flash Freeze |
|
|
|
| Winter Storm Severity Index (WSSI) Blowing Snow |
Winter Storm Severity Index (WSSI) Ground Blizzard |
|
|
|
|
|
| Report Snow/Ice to the National Weather Service |
| REPORT SNOW/ICE AMOUNTS TO US | REPORT SNOW/ICE IMPACTS TO US |
|---|---|
 |
 |
|
Fill in a Form
|
Send an email to: |
Use Social Media: We are always monitoring
|


 Send Us a Report