Severe Thunderstorms Tonight in the Mid-Atlantic; Tropical Storm Bertha in the Gulf
Scattered thunderstorms with severe gusts, hail and a tornado risk are possible near a cold front from the Ohio Valley to the Mid-Atlantic tonight. Tropical Storm Bertha is expected to bring tropical storm conditions to portions of the Gulf Coast from the panhandle of Florida into Louisiana through Wednesday.
Read More >
The main weather themes of 2019 were the overall warmth, the active spring (23 total tornadoes) and a wet fall. The year ended as the 21st warmest on record in Lubbock, finishing with an average yearly temperature of 61.5 degrees. Precipitation was fairly regular through the spring and early summer, nearly ceased during the second half of the summer, and returned in frequency and robustness in the fall. The fall wetness helped subdue an emerging late-summer drought. In total, 24.37 inches of precipitation fell at Lubbock during 2019, which was the 18th wettest in the historical record and over 5 inches above average.
2019 Map of Significant Weather Events
The map below highlights some of the more significant weather events that occurred across the area in 2019. The severe weather season kicked off a bit early with a brief but damaging tornado touching down near Anton in mid-March. The spring season was active, in particular May, when 19 tornadoes were observed. Multiple tornadoes occurred on May 4th, 5th, 7th, 20th, 25th and 26th. In total, 2019 brought 23 tornadoes to the South Plains region. Of the 23 tornadoes, 18 were rated EF-U or EF-0, two were rated EF-1 and three were rated EF-2. The most intense thunderstorms also dropped large hail and heavy rainfall. This included baseball size near Peacock & Swenson on April 27th, near Aiken on April 30th, in Shallowater on May 23rd, and near Tahoka on June 24th. Apple-sized hail (3" diameter) was also reported in Slaton on June 24th. Seven inches of rain created flooding in and around Amherst July 6th and 7th. The second half of the summer turned dry and hot, and Lubbock recorded its second hottest August on record. High-based thunderstorms provided little rainfall, but sparked several wildfires, including the Bird Ranch Fire, in western Cottle County in mid-August. The Bird Ranch Fire consumed nearly 10,000 acres and even helped generate clouds which grew into thunderstorms that ignited additional wildfires on August 18th. The fall brought more widespread and heavy rainfall, which helped ease any growing drought concerns. Wintry weather was tough to come by in 2019, but the southeast Texas Panhandle (near Memphis) did receive several inches of snow on January 3rd and the southwest Texas Panhandle measured 3-5 inches of snow October 24th.
Map displaying many of the more notable weather impacts to the region in 2019. Note that this is just a sampling of events, many more have been omitted due to space constraints. Click on the image to view a larger map.
Twenty-three tornadoes were observed in the Lubbock 24-county service area in 2019, well above the 6 observed the previous year, and the long-term average of 18. The season began early, as a line of thunderstorms spawned a quick-moving tornado near Anton on March 12th. Unfortunately, the tornado directly impacted a homestead just east of Anton and did considerable damage, resulting in an EF-1 rating. A couple of brief tornadoes followed in late April in Stonewall County, but they were short-lived and were rated EF-U. The bulk of the tornadic storms to affect the South Plains region in 2019 struck in May. The longest track tornado of the year occurred on May 5th, when a large and dusty tornado formed north of Tahoka, then tracked southeastward for over 17 miles. The Lynn County tornado was assessed an EF-2 rating. Another tornado, from the same storm complex, obtained an EF-1 rating in far southern Lynn County, near the community of Draw, later on the 5th. Two days later, on May 7th, three additional tornadoes occurred, this time across the south-central Texas Panhandle. All three tornadoes were rated EF-U, remaining over rural areas outside of the communities of Halfway, Tulia and Vigo Park. After a brief reprieve, May 20th brought four brief tornadoes (rated EF-0 or EF-U), two in Dickens County and two in Cottle County. Another four tornadoes occurred on May 25th. The most significant of these tornadoes skimmed the north side of Plainview, inflicting EF-2 damage when it down a cell phone tower. The next day brought three more tornadoes (near Lariat, Earth and Sunnyside) as a persistent supercell thunderstorm tracked steadily from eastern New Mexico across the northwest South Plains and into the south-central Texas Panhandle. The tornado that passed near Earth knocked down a large electrical transmission tower, giving it an EF-2 rating. The other two tornadoes on May 26th were rated EF-0. After the active May, only one additional tornado was reported in 2019, when storm researchers observed a brief tornado near Summerfield on June 15th.
Precipitation Summary
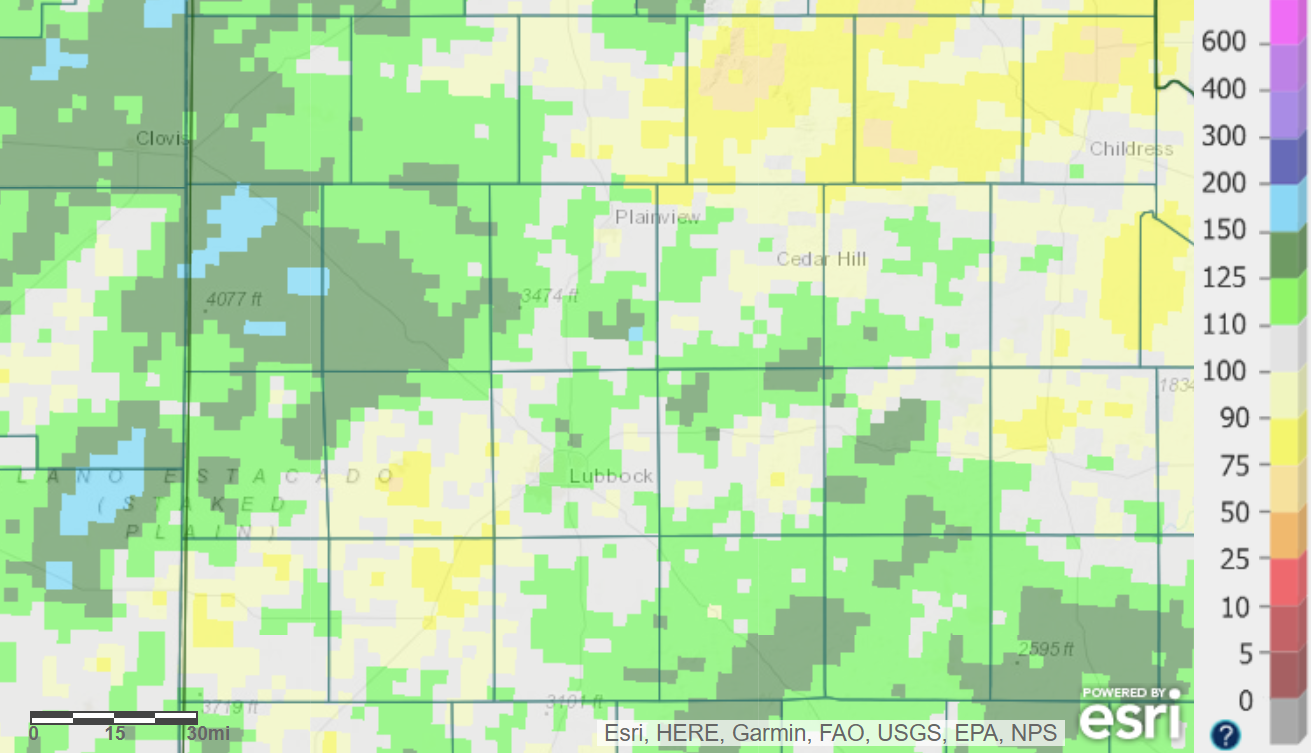
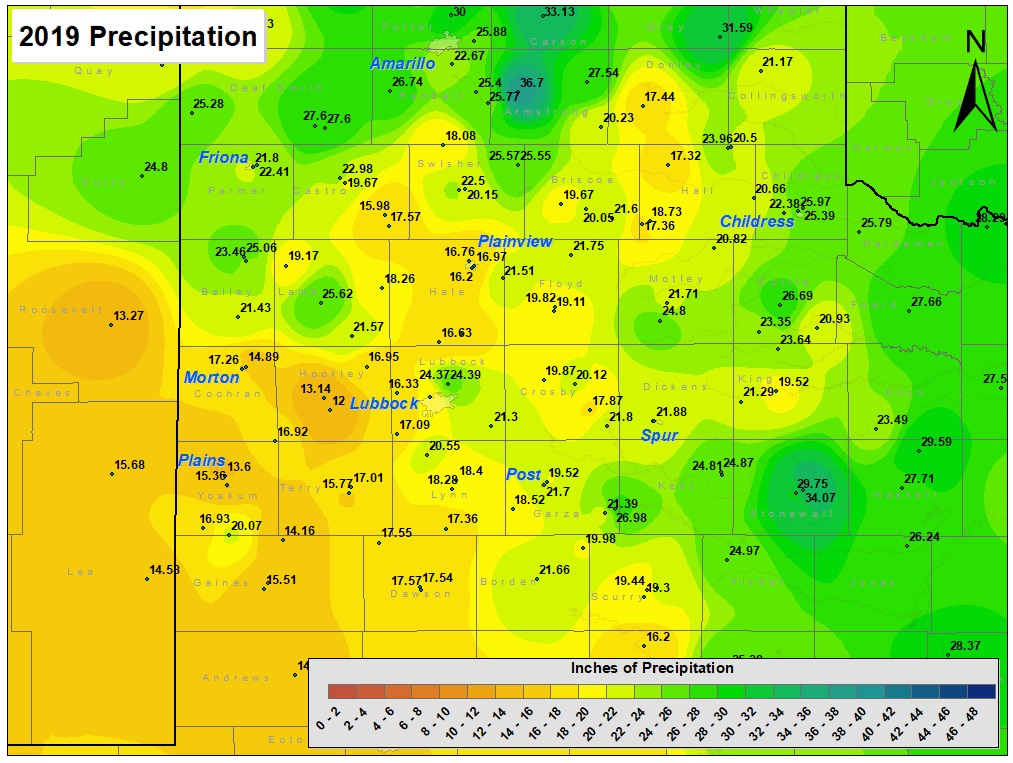
This map displays the 2019 radar-estimated and bias-corrected precipitation totals (inches). Click on the map to view a full-sized version.
Precipitation in 2019 varied greatly, but generally favored the northwest South Plains and southwest Texas Panhandle as well as the Rolling Plains. Lower annual rain totals were found across the southwest South Plains and the south-central Texas Panhandle. The biggest winners were found in parts of Stonewall County where 30+ inches of rain occurred. The West Texas Mesonet site located just northeast of Aspermont recorded 34.07 inches, while the COOP observer on the northwest side of town measured 29.75 inches. Many other locations tallied more than 20 inches of rain. The lowest rain totals measured were in Levelland and Plains at 13.14 inches and 15.79 inches, respectively.
Lubbock International Airport officially recorded 24.37 inches of precipitation, over five inches above the long-term average of 19.12 inches. This was fairly representative of the center part of Lubbock County, including the city of Lubbock. Rain totals were lighter on the eastern, western and southern parts of Lubbock County.
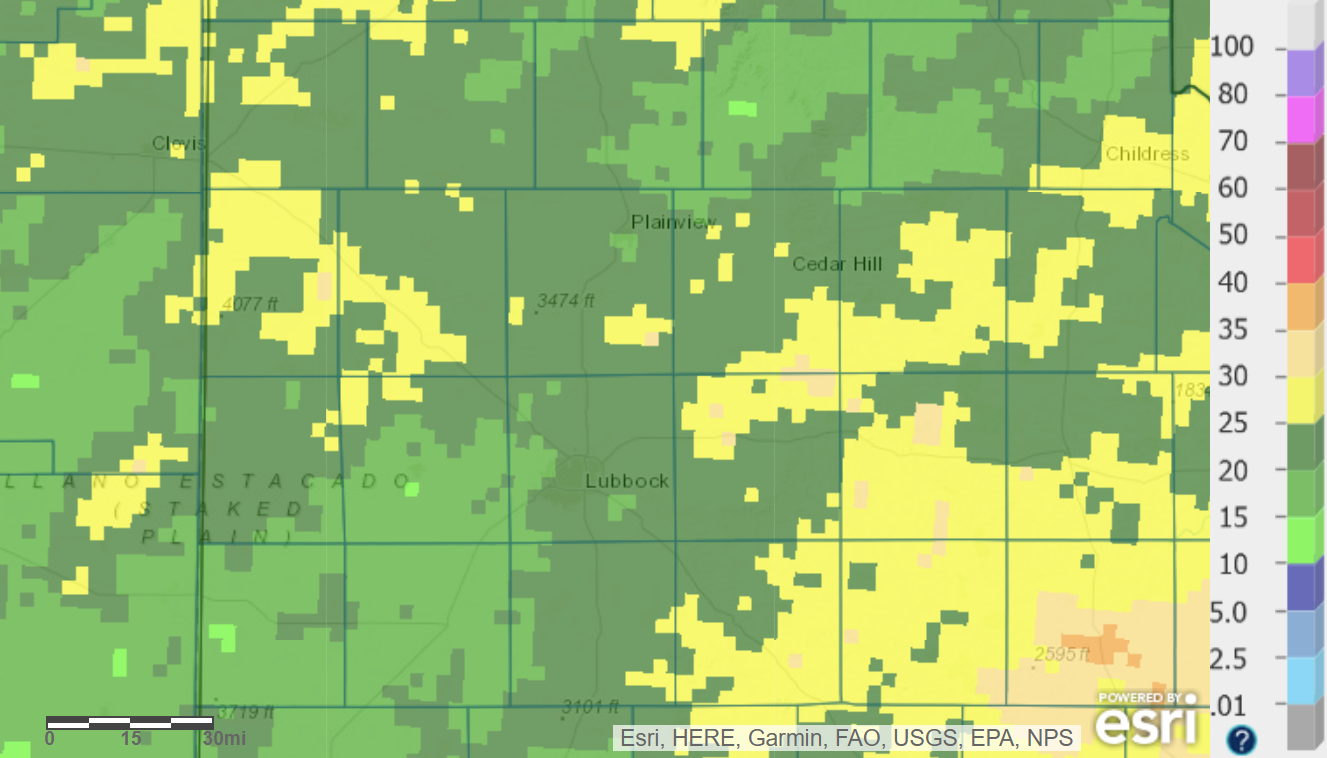
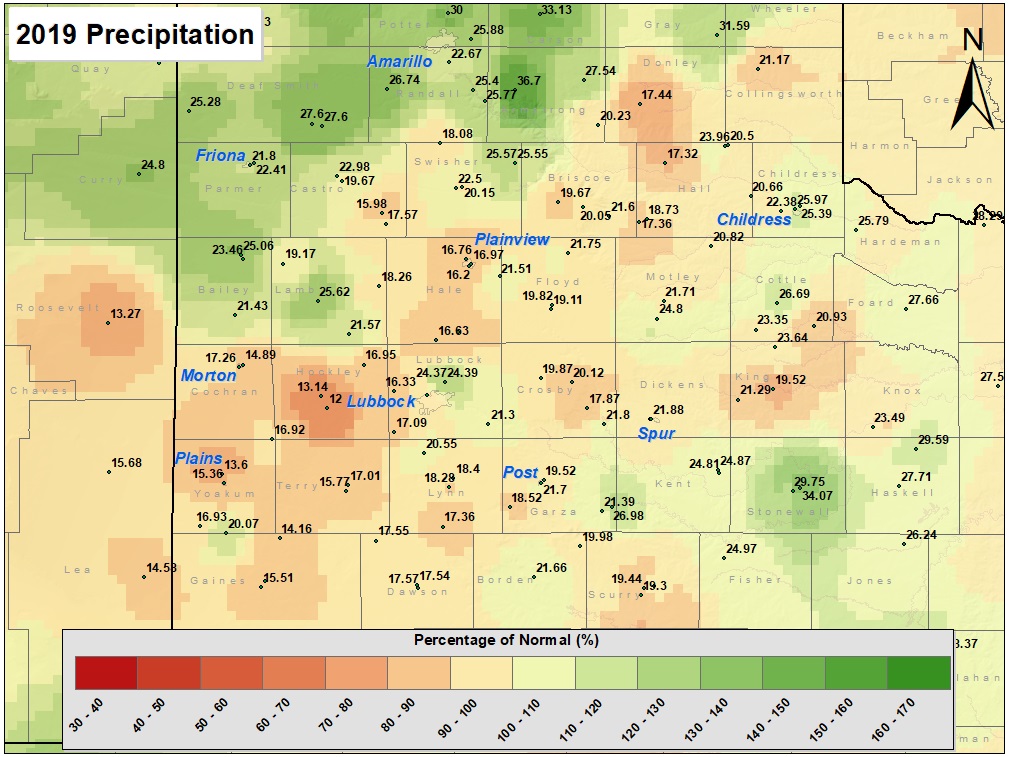
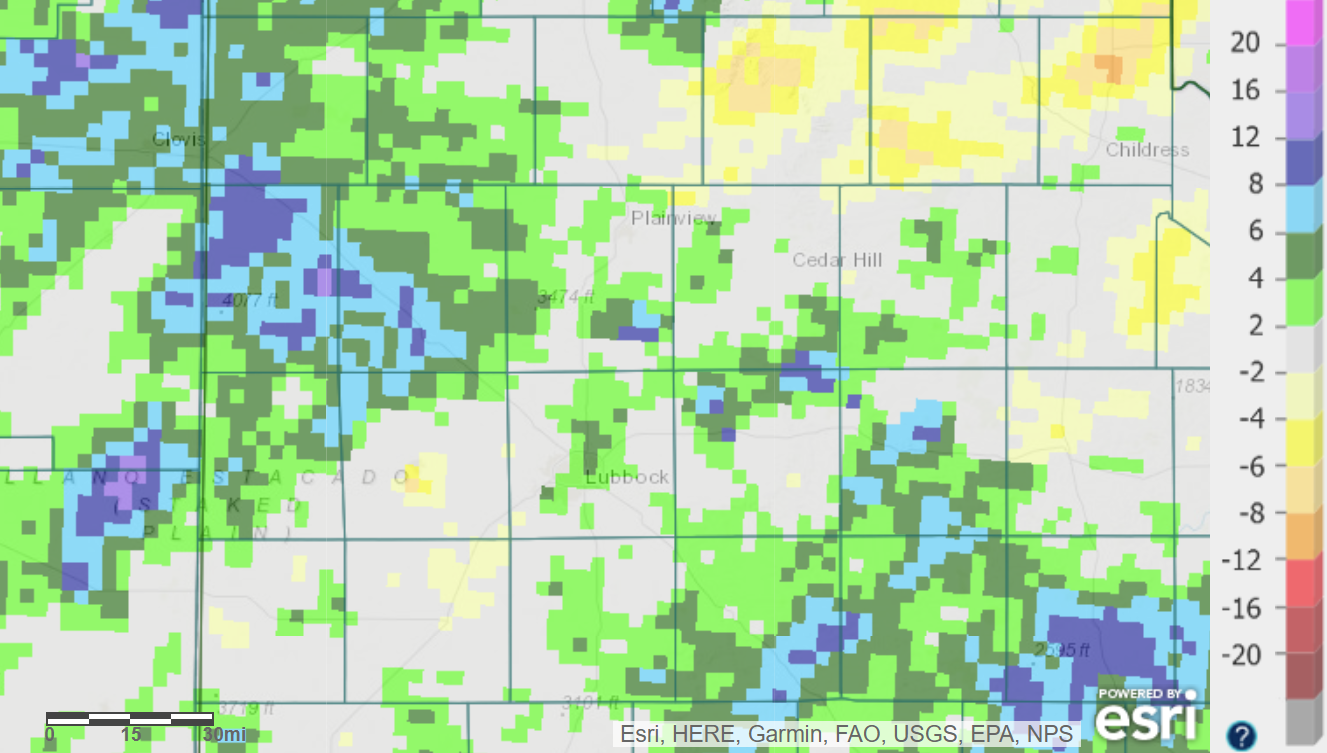
The map below shows the 2019 precipitation as a percent of the long-term average, or "normal". This image shows the driest region (50-90% of average) across the southeast Texas Panhandle, with other below average pockets across the northern Rolling Plains and southwestern South Plains. On the other side of the spectrum, well above average precipitation, 125+ percent of normal, fell over much of the northwest South Plains, far southwest Texas Panhandle, and then in small patches from the central South Plains into the southern Rolling Plains.
This map shows the 2019 radar-estimated and bias-corrected precipitation as a percent of normal. Click on the map to view a full-sized version. If you would like to see the precipitation as a departure from normal (inches) please CLICK HERE.
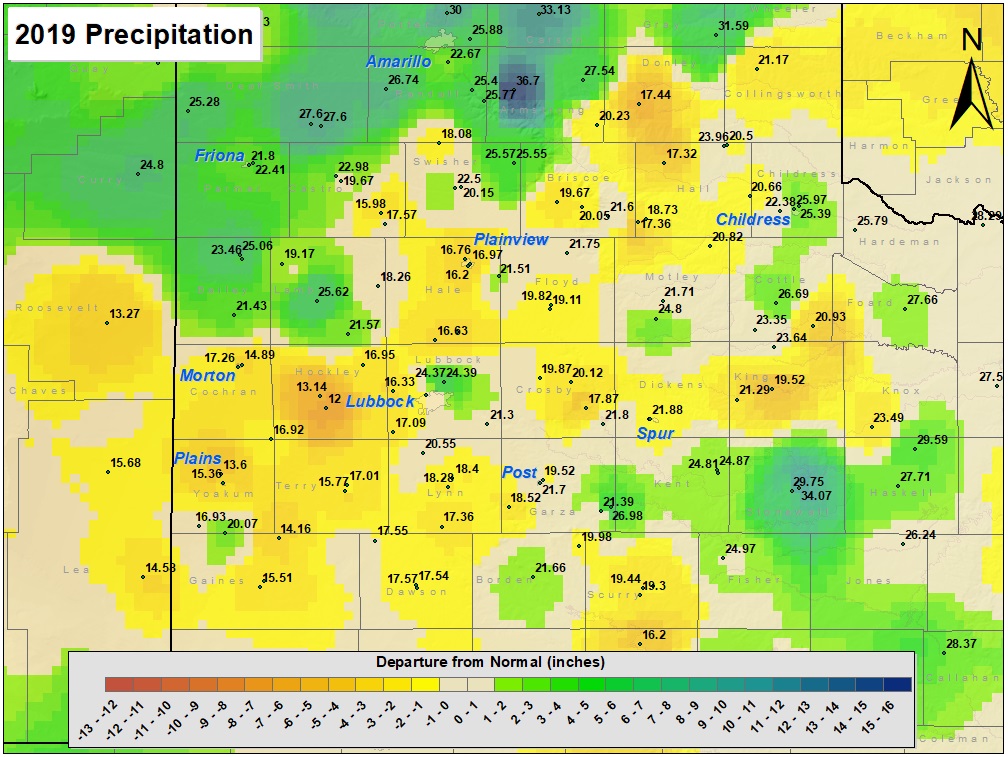
The next map shows the 2019 precipitation as recorded by the various weather stations across a slightly wider area. The overall pattern remains the same as the radar-derived maps above but plotting the individual stations helps to highlight some of the local areas with higher variation.
This map displays the 2019 year precipitation totals. The map was created with data gathered from the NWS Cooperative observers and automated stations, and the West Texas Mesonet. Click on the map to view a full-sized version.
The map below shows the 2019 precipitation as a percent of the long-term average, or "normal". This image shows the pronounced wet region (120-150% of average) extending from the northwest South Plains including much of Bailey and Lamb Counties, northeastward through the western and central Texas Panhandle, with other smaller wet pockets near Lubbock (including the Lubbock Airport), and Stonewall County. On the other side of the spectrum, below average precipitation was common across the southwest South Plains as far east as western Lubbock County, and parts of the central and eastern Rolling Plains.
This map shows the 2019 rainfall as a percent of the 30-year normal rainfall (1971-2000). Also plotted is the rainfall observed, in inches, at each collection site. Please click on the map to view a full-sized version. If you would like to see the precipitation as a departure from normal please CLICK HERE.
Drought Update and Reservoir Levels
The year began with minimal drought across the entire state of Texas. Drought conditions ticked upward through February, as dry conditions prevailed, but they were quickly drenched by a couple bouts of thunderstorms in March. Relatively regular rounds of showers and thunderstorms kept any drought concerns at bay through spring and the first half of the summer. That changed the second half of summer when hot and dry conditions became more prevalent, especially over the southern Texas Panhandle into the eastern South Plains and all of the Rolling Plains. The hot and dry weather, coupled with high-based thunderstorms, even sparked several wildfires in the region in mid-late August. The fall brought welcome rain that eroded the drought across roughly the northwestern half of the state.
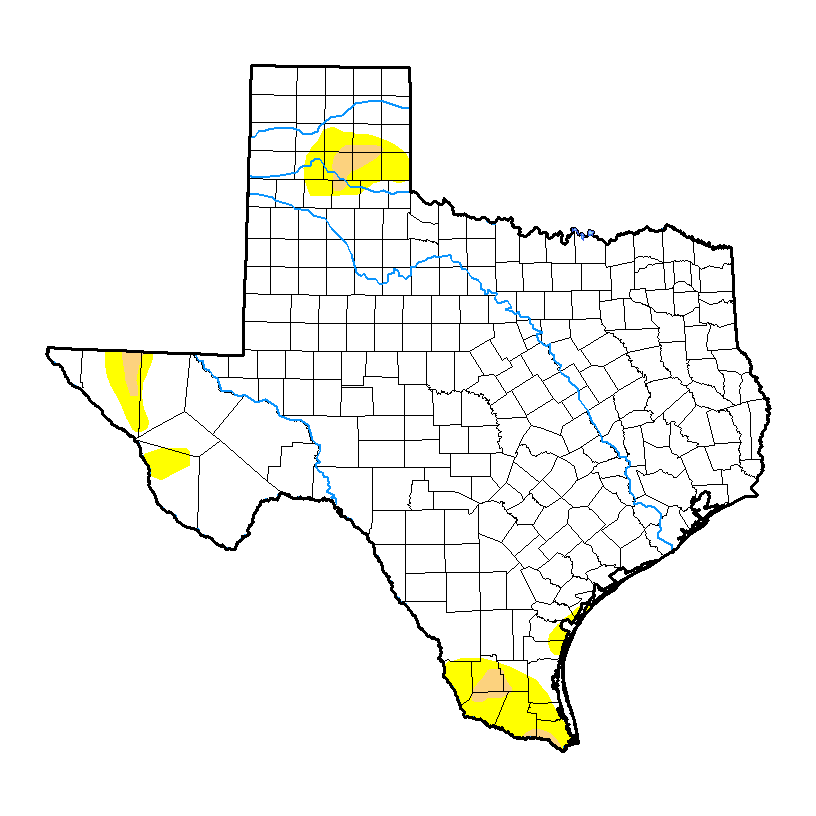
This map shows the drought conditions on January 1, 2019. Click on the map to view a full-sized version.
This map shows the drought conditions on May 7, 2019. Click on the map to view a full-sized version.
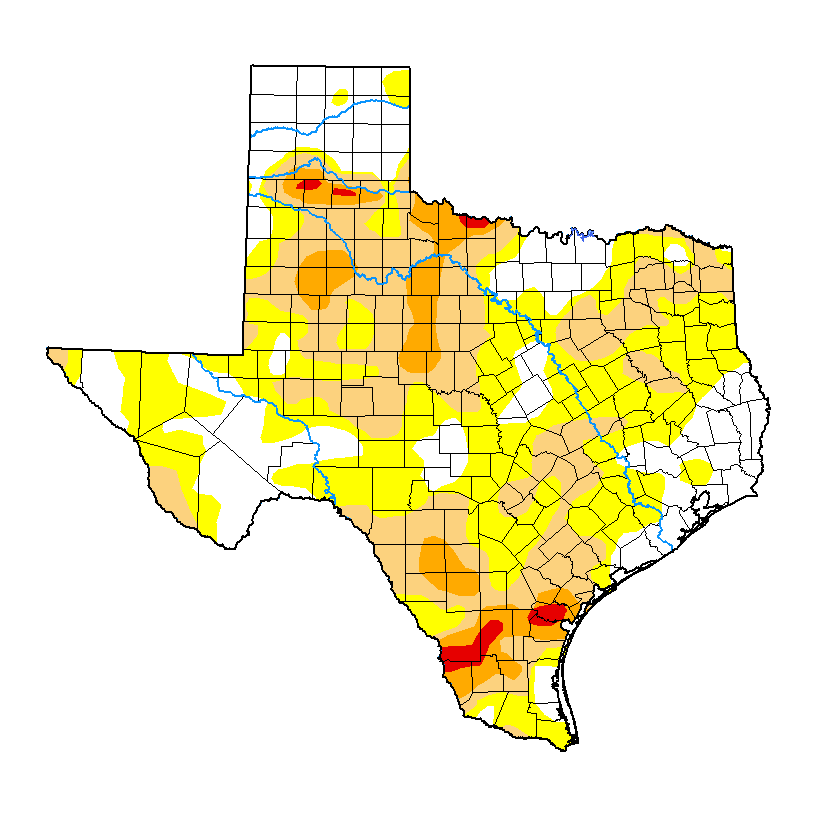
This map shows the drought conditions on August 27, 2019. Click on the map to view a full-sized version.
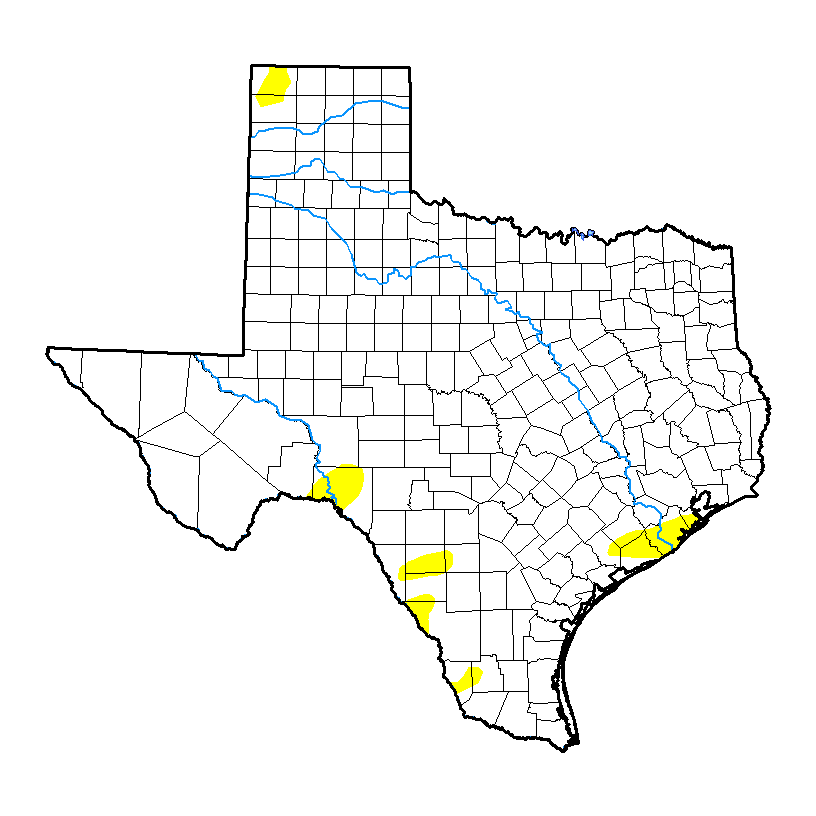
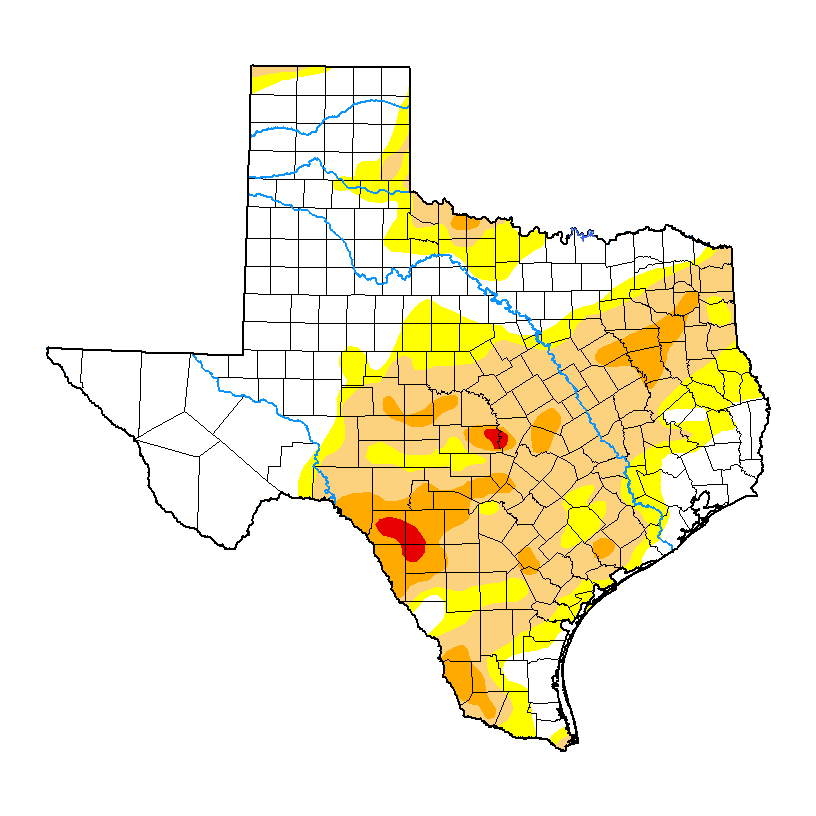
This map shows the drought conditions on December 17, 2019. Click on the map to view a full-sized version.
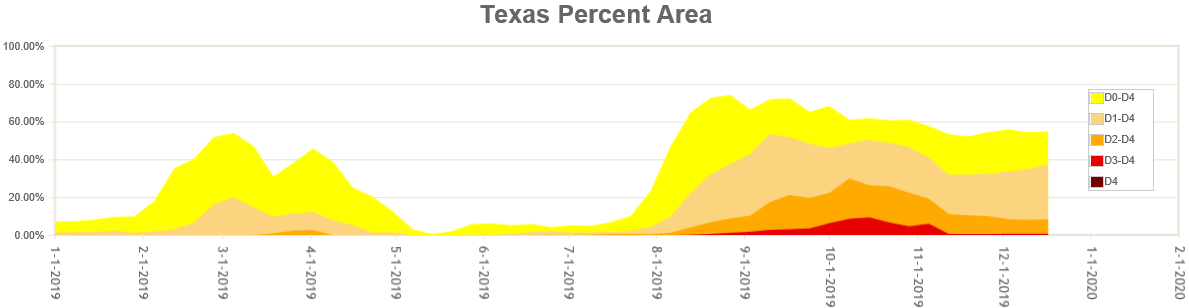
Statewide drought coverage for Texas in 2019. The South Plains followed the same general trend as the entire state, except in fall when rains removed the drought from West Texas. Click on the above image for a larger view.
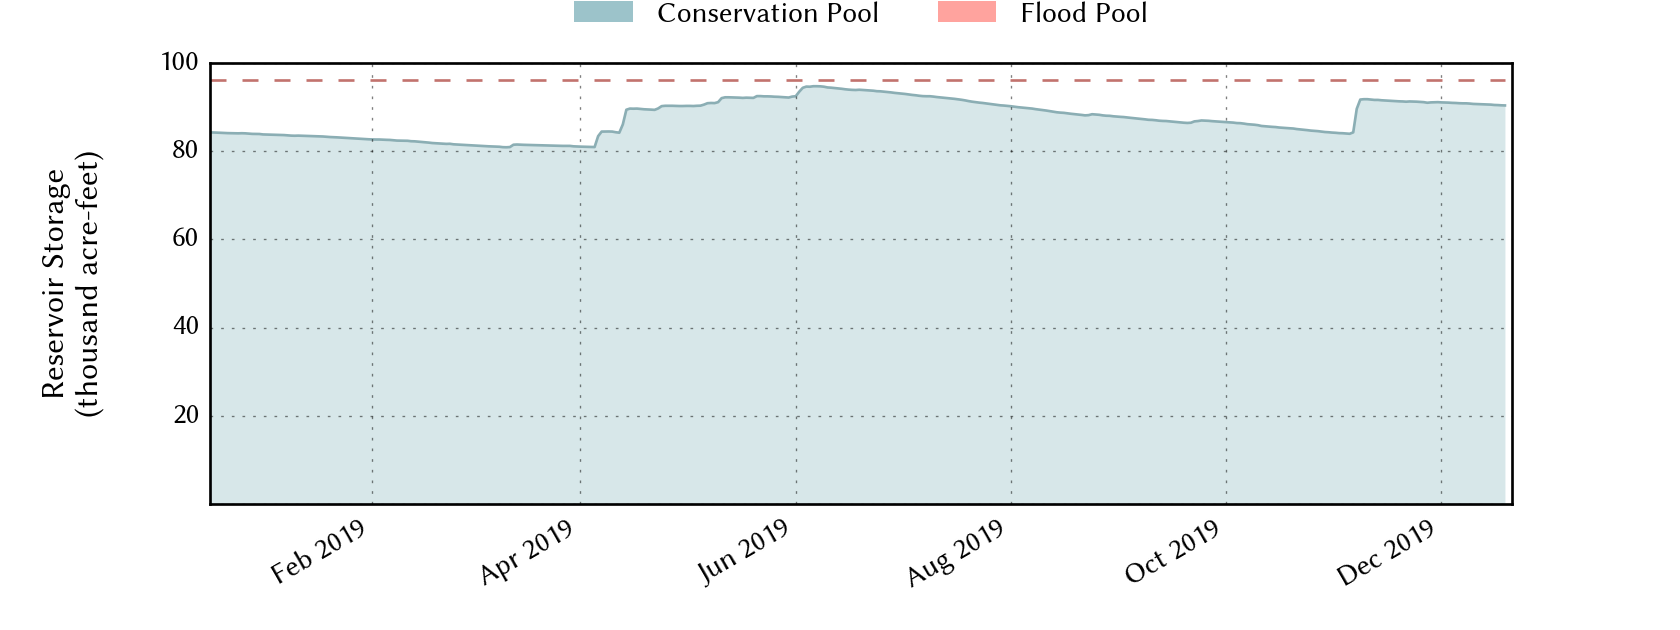
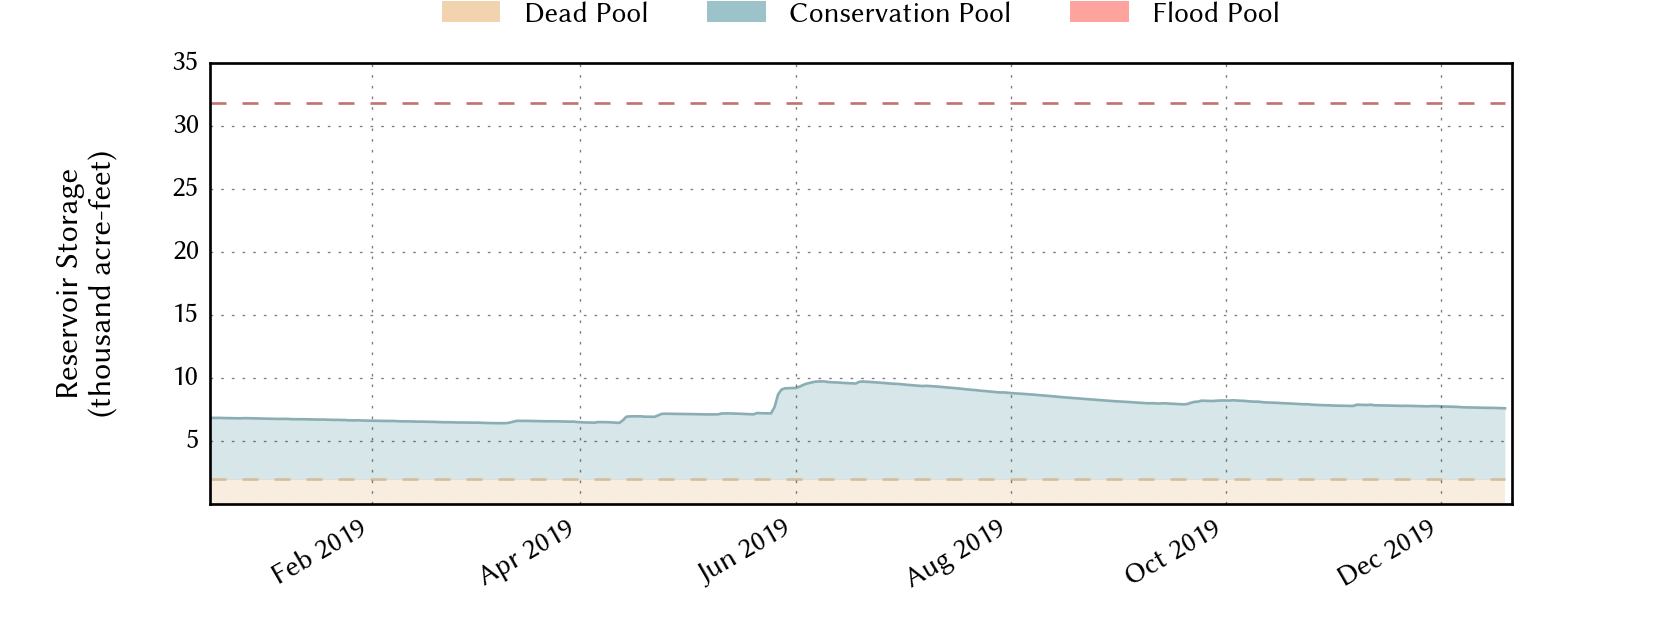
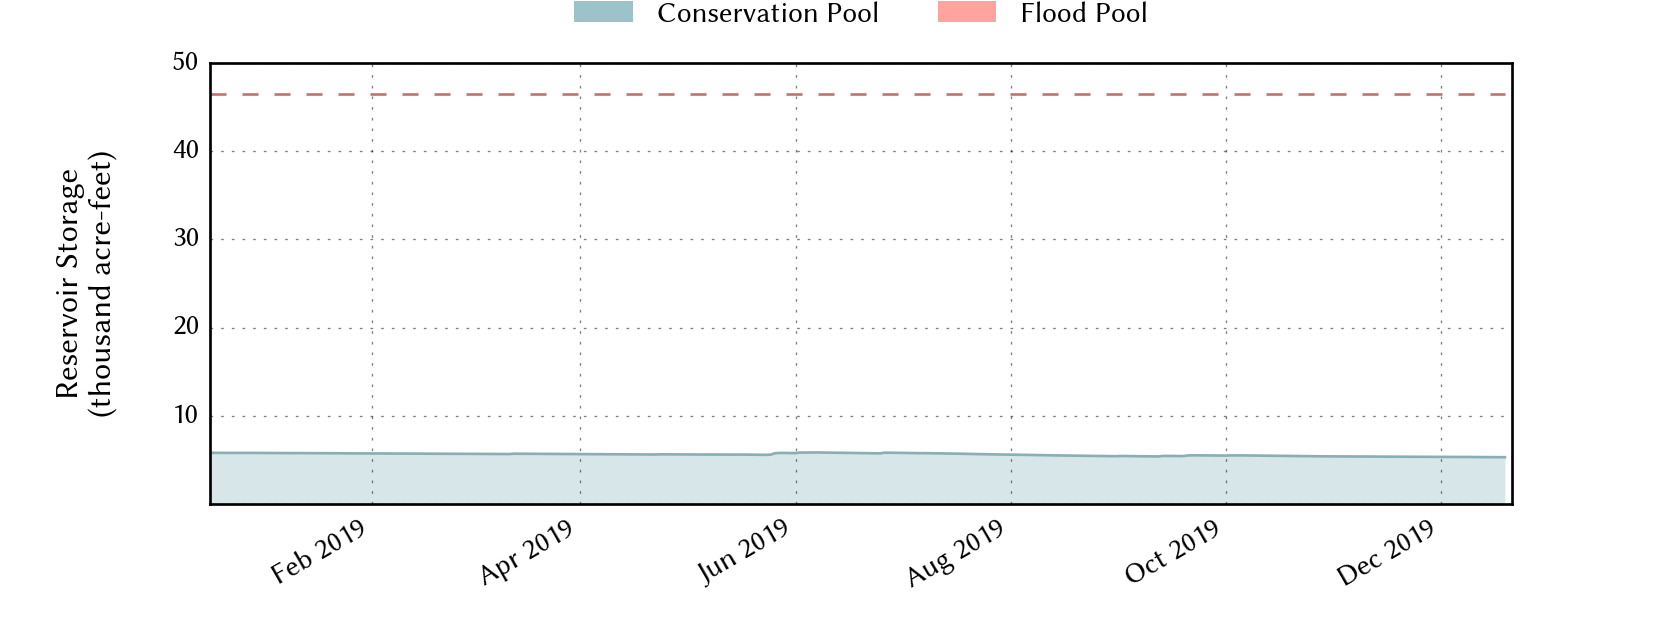
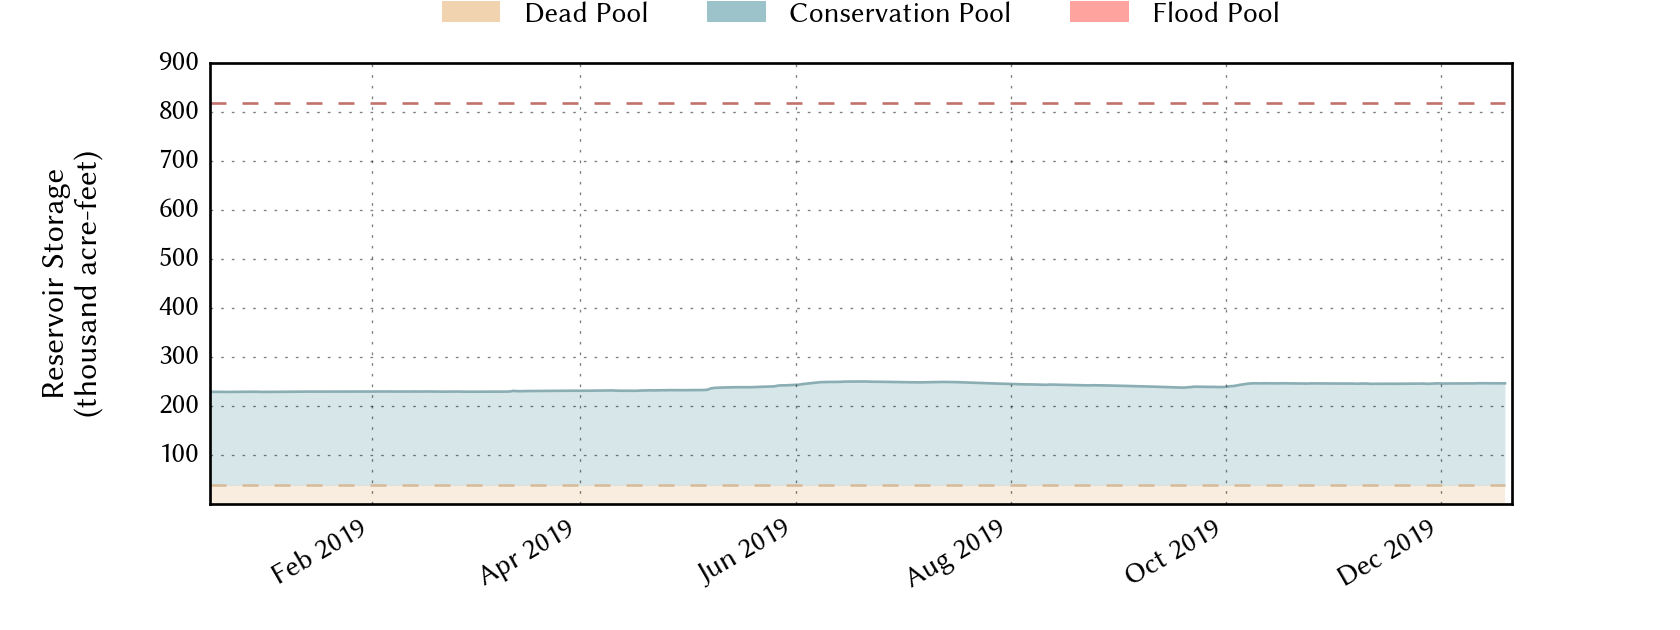
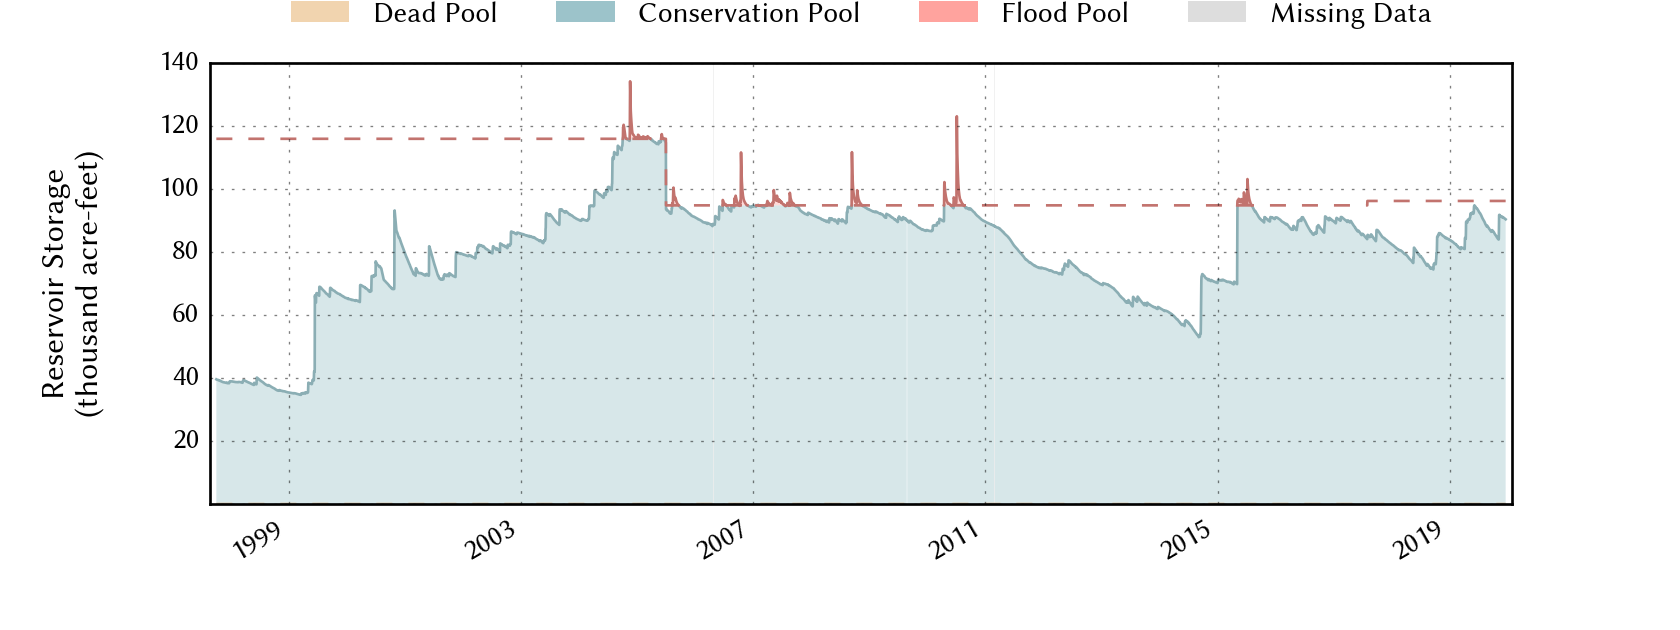
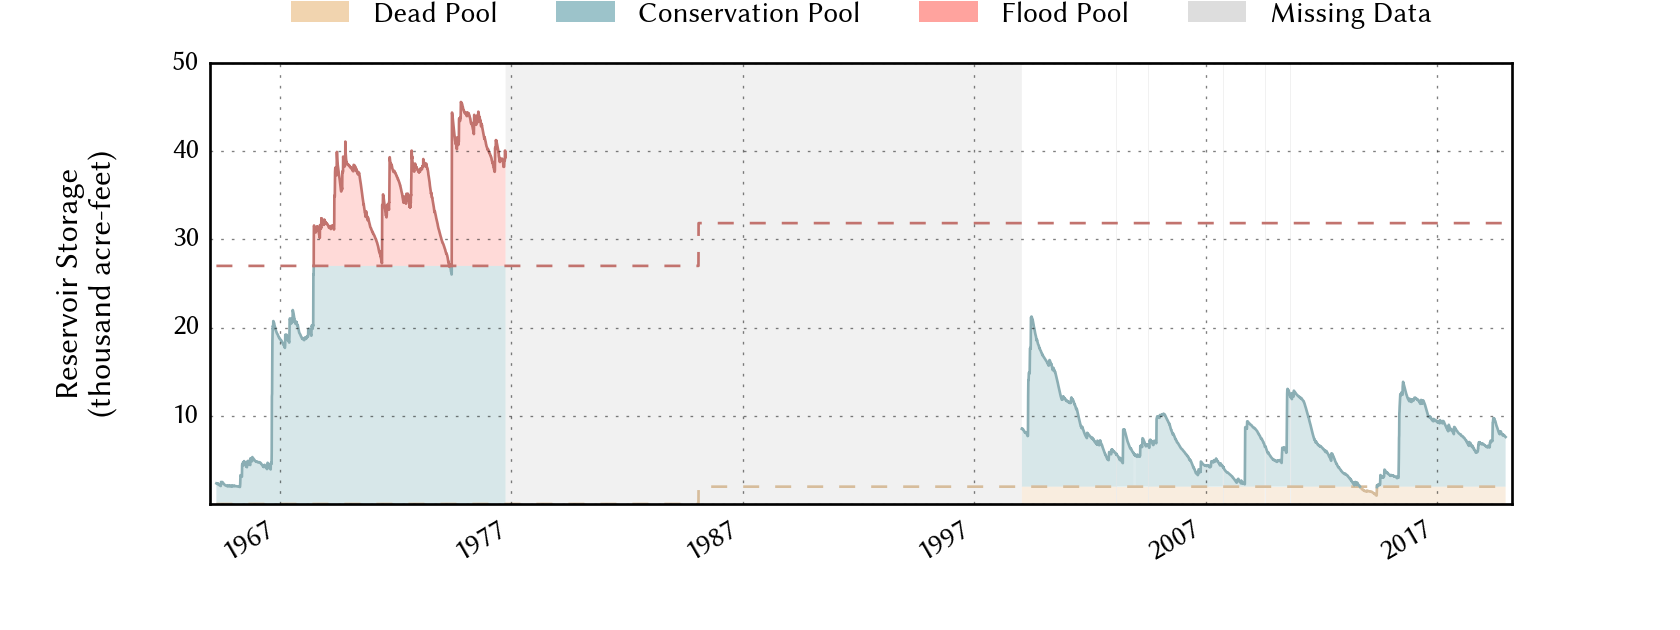
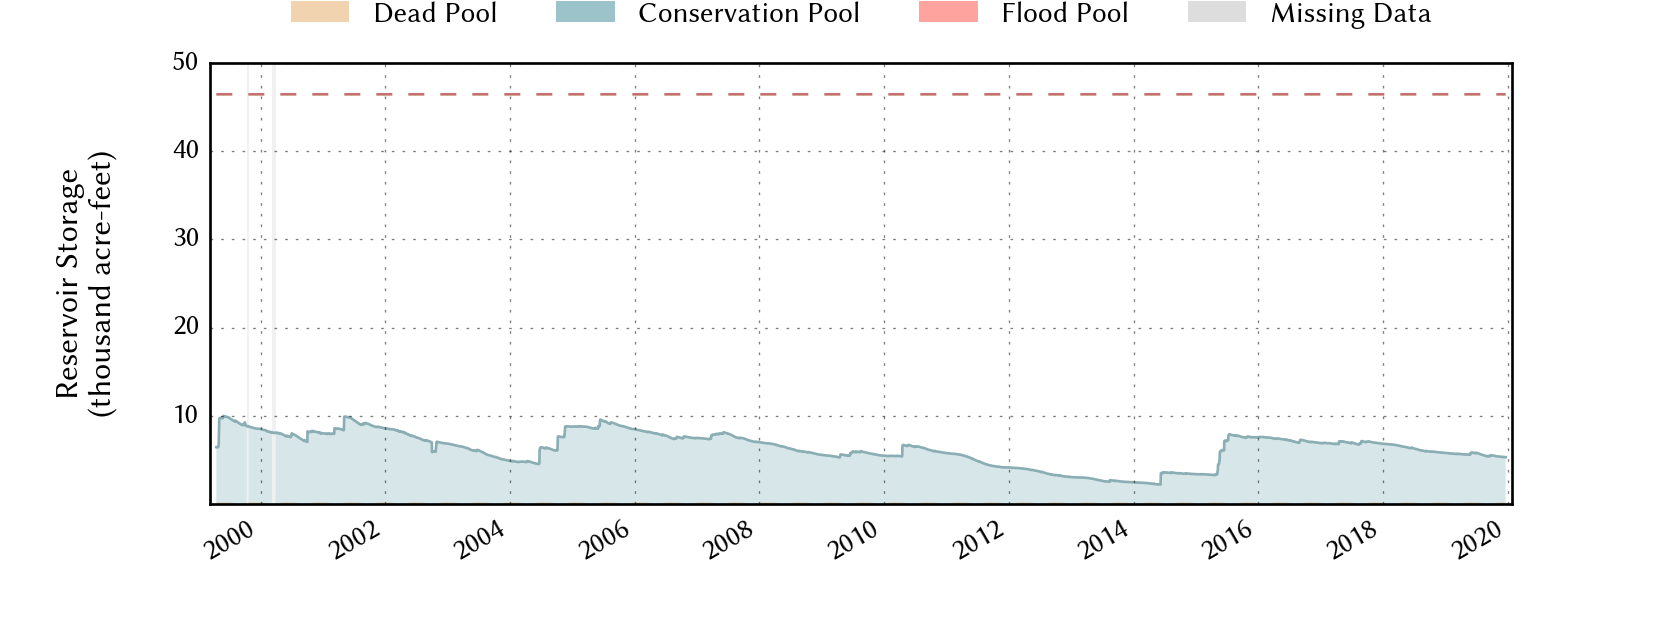
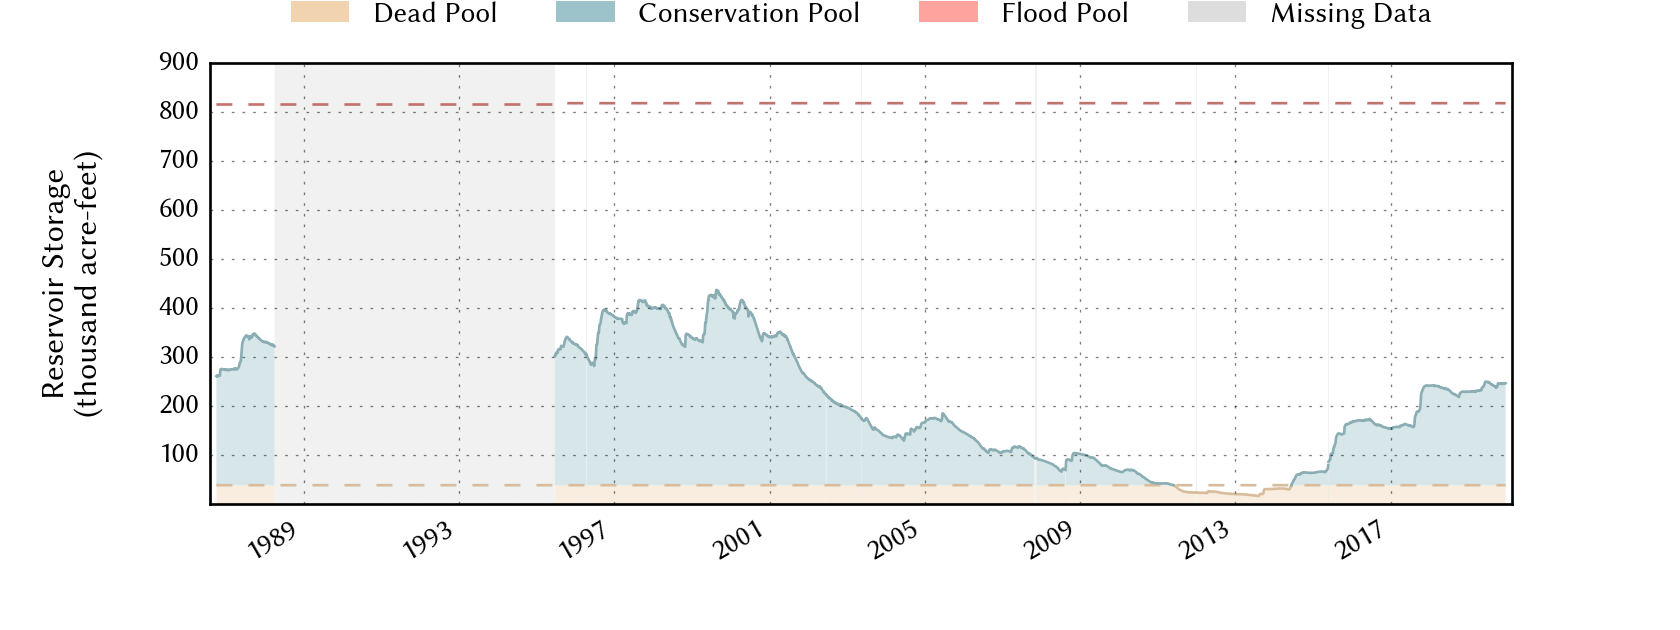
The spring and fall rains kept the area reservoir levels fairly stable. Over the course of 2019, Lake Meredith (from 38% to 42%), Lake Alan Henry (from 87% to 94%) and White River Lake (from 16% to 19%) each saw modest increases in their conservation levels while Lake Mackenzie lost one percentage point (from 15% to 14%).
Recent plot of the water level for Lake Alan Henry. Click on the image for a full-sized version. A longer record of data for Lake Alan Henry can also be VIEWED HERE. The graphs are courtesy of: www.waterdatafortexas.org
Recent plot of the water level for White River Lake. Click on the image for a full-sized version. A longer record of data for White River Lake can also be VIEWED HERE. The graphs are courtesy of: www.waterdatafortexas.org
Recent plot of the water level for Mackenzie Reservoir. Click on the image for a full-sized version. A longer record of data for Mackenzie Reservoir can also be VIEWED HERE. The graphs are courtesy of: www.waterdatafortexas.org
Recent plot of the water level for Lake Meredith. Click on the image for a full-sized version. A longer record of data for Lake Meredith can also be VIEWED HERE. The graphs are courtesy of: www.waterdatafortexas.org
Lubbock Statistics
2019 will go down in the books as the 21st warmest and 18th wettest year since records began in 1911 at Lubbock. Mean monthly temperatures were warmer than average for 7 months and cooler than average 5 months. The warmest months, with respect to average, were September (+5.9°F), August (+5.4°F) and December (+4.2°F). The coolest months, with respect to average, were October (-4.4°F) and March (-2.8°F).
Precipitation was tough to come by the first couple months of the year, but then increased in frequency and amount through the spring of 2019. Summer began with fairly regular rainfall, but was interrupted by a prolonged dry stretch through much of July and August before more regular rains returned in the fall. In total, seven months recorded above average rainfall and five months fell short of average. The wettest month was September, tallying 5.97 inches of rain (3.46 inches above the monthly average). Near average rainfall closed out the final three months of the year. Impressively, only 0.2" of snow fell at Lubbock in 2019, tying 1950 for the second lowest annual snow total on record (1953 only had a trace of snow). The Lubbock Airport recorded a total of 24.37 inches of precipitation for 2019, finishing 5.25 inches above average. Five daily record rainfall were set in 2019: 0.76" on April 13th; 2.60" on May 24th; 3.98" on July 6th; 1.26" on September 28th; and 0.47" on November 6th. Seven days in 2019 recorded an inch or more of rain, and three days had more than two inches. The highest single-day rainfall in 2019 was 3.98 inches on July 6th.
The hottest temperature in 2019 was 109°F, reached on August 26th. The high reached or exceeded 105°F on one other occasion: August 18th (105°F). In all, temperatures reached the triple digits on 19 occasions, well above the long-term average of 10. On the other side of the pendulum, the coldest temperature of the year was a chilly 13 degrees, experienced February 8th. Thirteen nights fell below 20°F for the entire year. Three record highs were tied or set in 2019: 104°F on August 17th; 105°F on August 18th; and 109°F on August 26th. The 109°F also set an all-time record high for August, and tied for the 7th hottest day on record. In addition, 10 record high minimum temperatures were set or tied in 2019. Six record lows were tied or set in 2019: 33°F on October 11th; 31°F on October 12th; 28°F on October 25th; 26°F on October 26th; 16°F on October 31st; and 15°F on November 12th. In addition, three record low maximum temperatures were set in 2019.
LUBBOCK
Average High
Average Low
Precip (inches)
January
56.4
28.7
T
February
60.1
30.1
0.04
March
61.9
36.3
1.13
April
76.5
47.8
1.75
May
79.9
55.6
3.96
June
89.9
63.9
2.06
July
94.8
69.1
4.51
August
97.7
71.2
2.14
September
88.9
66.2
5.97
October
71.0
43.3
1.11
November
62.2
34.1
1.05
December
59.0
30.6
0.65
Annual
74.9
(37th warmest)
48.2
(16th warmest)
24.37
(18th wettest)
Normal
74.3
47.0
19.12
Departure
+0.6
+1.2
+5.25
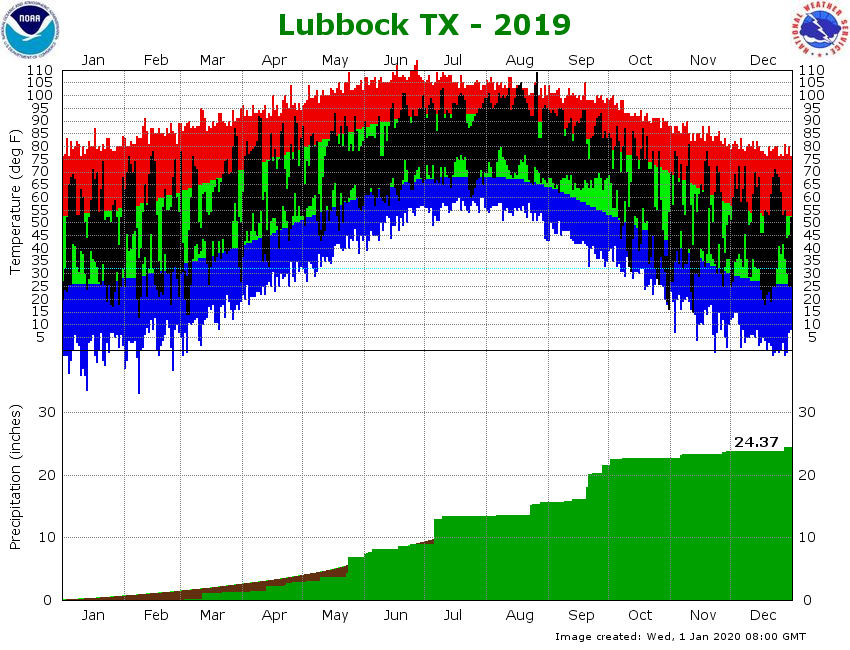
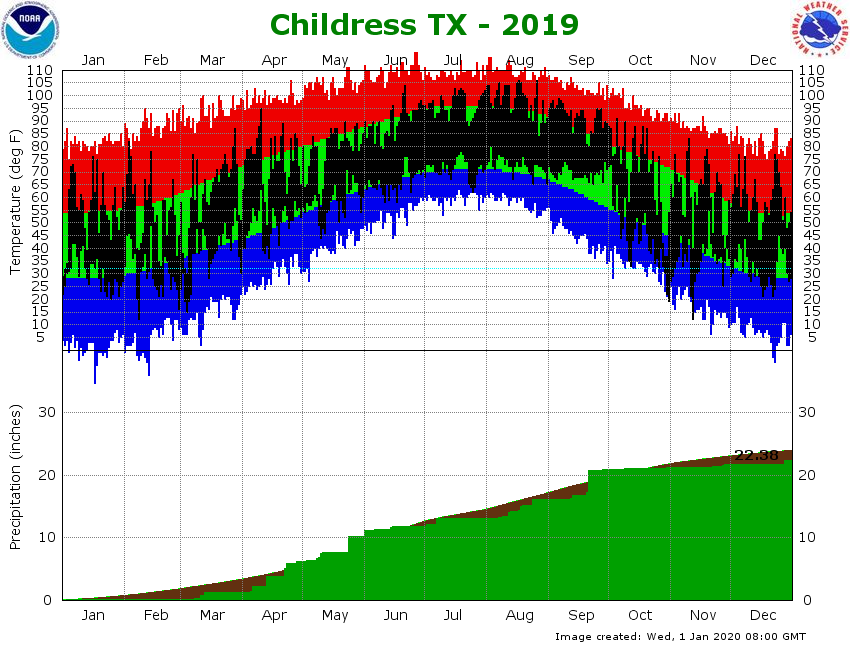
The upper section of the below graph shows the daily high and low temperature distribution for 2019 at Lubbock Preston Smith International Airport. A majority of the year yielded temperatures at or above average, with 7 of the 12 months finishing warmer than average. August and September were particularly warm when compared to average, setting three daily record highs (all in August), only recording two days (both in August) with a below average mean temperature and concluding 5-6 degrees above average. The coolest month, with respect to average, was October, which experienced a few cold air intrusions, tied or set 5 record daily lows and finished 4.4 degrees below average. The year concluded on the mild side, with December ending over four degrees above average.
(Top) Plot of the maximum and minimum temperatures (connected by a black line) observed at the Lubbock Preston Smith International Airport in 2019. Also plotted are the respective normals (green - range of average highs and lows) and record highs (red) and record lows (blue) for each date. Units are in degrees Fahrenheit. (Bottom) Plot of the rain accumulation (green), in inches, observed at the Lubbock Preston Smith International Airport in 2019. Also plotted is the distribution of the average rainfall (brown). Click on the graph for a larger view. Click HERE to view the graph for Childress.
The bottom section of the chart above shows how much rain accumulated through 2019. Lubbock finished with a grand total of 24.37 inches, over five inches above the 30-year average. The year began on a dry note, but precipitation events picked up through the spring. Heavy rain in late May boosted the total to date precipitation above average for the first time in the year. The running rainfall total briefly slipped below average in early July, but 3.98 inches of rain on July 6th lifted it back to the plus side of average where it stayed the rest of the year. Rainfall was difficult to come by through the second half of the summer, but picked back up in fall, particularly from mid-September into early October. A few lighter precipitation events occurred through the final two months of the year.
2019 snowfall was almost non-existent. A total of 0.2 inches was measured, 0.1 inches in January and another 0.1 inches in October. The light snow in October, specifically on October 24th, was noteworthy in the fact that it was the third earliest measurable snowfall on record for Lubbock, trailing only October 21, 1911 (4.1") and October 17, 1999 (0.6"). Regardless, the two tenths of an inch of snow in 2019 tied 1950 for the second lowest yearly snow total on record. Only 1953 recorded less snow (a trace).
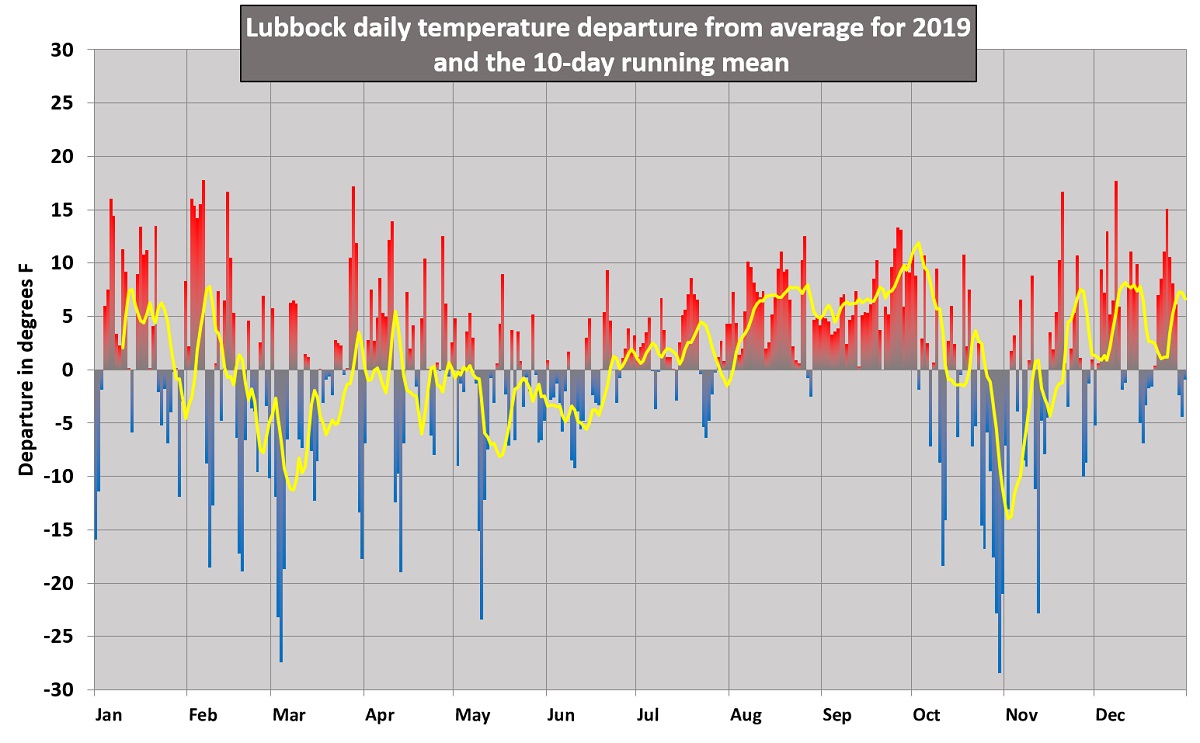
The graph above shows the 2019 daily temperature and a 10-day running mean (yellow line) at Lubbock as a departure from the 1981-2010 normals. Click on the graph for a larger view.
The graph above displays the daily temperature as the departure from the "normal", or 30-year average temperature. The yellow line represents the 10-day running mean of the daily temperature departure and is used to smooth out the day-to-day extremes so that longer trends are easier to see. It is clear that above average temperatures dominated most August and September. In contrast, several prolonged cooler than average stretches occurred, including from late February through much of March, over a good chunk of May and June, and from October into the first half of November. The beginning and end of 2019 had more variability but generally favored warmer than average temperatures. Overall, the average temperature of 61.5 degrees at Lubbock for the entire year was 0.8 degrees above the 30-year average, and made for the21st warmest year in the historical record for Lubbock.
2019 Monthly Highlights
JANUARY:
3rd: Snow fell across the far southern Texas Panhandle and northern Rolling Plains. The snowfall was mainly confined to areas across Hall and Childress Counties. The most snow reported was 4.5 inches in the town of Memphis. Read more about this small event HERE. 18th: Light showers, mainly virga, accompanying a small but potent upper-level storm system brought strong wind gusts to the area. Dimmitt and Friona recorded a dusting of snow as temperatures dropped below freezing after dark. Details from this event can be READ HERE.
FEBRUARY:
23th: February was a quiet month, but on the 23rd a powerful upper level storm system brought intense winds to the southern High Plains. Wind gusts of 50 to 64 mph resulted in some minor damage. To learn more about this event CLICK HERE.
MARCH:
8th-9th: Early-season thunderstorms brought strong wind gusts and a little bit of rain to the Texas South Plains. A gust to 71 mph was recorded near Childress from one of the storms. To see the wind and rain reports from this event FOLLOW THIS LINK. 12th-13th: Severe weather season got an early start this year as an intense storm system moved through the plains (you may recall that this storm system was dubbed, "The Bomb Cyclone"). A small tornado embedded in a line of thunderstorms hit the town of Anton. Details on this extreme event can be FOUND HERE.
22nd: Isolated thunderstorms moved across the South Plains during the evening hours. One severe thunderstorm produced one to two inch diameter hail in southern Lubbock County. More information on these storms can be VIEWED HERE.
APRIL:
3rd: A lone severe thunderstorm brought heavy rain and hail up to two inches in diameter to the far southeast Texas Panhandle. More on this nasty storm can be VIEWED HERE. 5th: A severe thunderstorm takes aim on the town of Jayton in Kent County, causing wind damage and flooding. Other storms also produced large hail and heavy rain. Learn more about this event HERE. 10th: A windy and dry day resulted in blowing dust and a few wildfires. View the report on this day HERE.
12th-13th: A chilly and moist storm system brought as much as three inches of rain to the eastern Rolling Plains. See how much rain fell HERE.
22nd-23rd: More rain across the area and some severe weather in the Rolling Plains. See the full report HERE.
27th: An intense storm system spawned severe thunderstorms with very large hail in the Rolling Plains, and a tornado was reported in Stonewall County. More information can be found HERE.
30th: Severe weather shifted west to the Caprock. Thunderstorms produced large hail across Lamb, Hale and Floyd Counties. See the full report HERE.
MAY:
1st: Severe thunderstorms developed near Aspermont, dropping large hail in eastern Stonewall County before moving east. More information HERE.
1st-10th: The first ten days of May were very busy across the South Plains with several episodes of severe thunderstorm activity. View the details of this active period HERE.
5th: A long-lived supercell thunderstorm produced a strong tornado across Lynn County, barely missing the town of Tahoka. See the report on this storm HERE.
25th: Several tornadic thunderstorms develop across the northern South Plains. Four tornadoes were reported in all, including one near Plainview, Texas. To learn about this event CLICK HERE. Late May: Rounds of severe storms visited the region in the late May. In addition to the storms on the 25th, there was high wind damage in Lubbock on the 20th, flooding in Ralls and Idalou on the 24th, and a rare late-night tornado on the 26th. A more detailed write-up on these active weather days can be FOUND HERE.
JUNE:
5th: A line of severe thunderstorms moving from the western South Plains into the central South Plains produced a haboob - a sharp boundary or "wall" of blowing dirt along the leading edge of the thunderstorm outflow. For more information, CLICK HERE.
24th: Severe thunderstorms pound Lubbock with large hail and heavy rain. Up to baseball-sized hail also fell in some surrounding communities. Details on this event can be READ HERE.
JULY:
6th-8th: Several rounds of thunderstorms brought some heavy rain to the South Plains. Late on the 6th into the early morning hours of the 7th, over seven inches of rain fell near the town of Amherst. Read more about this wet weather HERE.
10th: Thunderstorms develop on a very hot day and produce landspouts, hail and damaging winds. More info can be FOUND HERE.
AUGUST:
Entire Month: August was generally hot and dry across the Texas South Plains. Many high and low temperatures records at Lubbock were broken. Lightning from a dry thunderstorm sparked a wildfire in Cottle County on the 18th. Details on this hot period can be FOUND HERE.
SEPTEMBER:
19th-21st: Several rounds of showers and thunderstorms brought widespread rain to the region. Moisture from Tropical Storm Lorena contributed to some pockets of heavy rain. Read more about this wet period HERE.
28th-30th: More widespread rains graced the South Plains region. Details on this late September wet stretch can be FOUND HERE.
OCTOBER:
1st-4th: The wet finish to September continued into October as Pacific moisture from Tropical Storm Narda stream across West Texas. View a summary of the rainfall HERE.
24th: Winter weather came early to the South Plains as an early season cold front swept through the area. As an upper-level storm system passed over the area light freezing drizzle developed across the area with snow in the far southern Texas Panhandle. Read more about this wintry weather HERE.
29th-31st: October ended on a very chilly note with some record-setting cold temperatures at Lubbock and Childress. In addition, light freezing drizzle made travel dangerous due to icy roads. Additional details about this event can be READ HERE.
NOVEMBER:
6th-7th: A storm system moving across NM and TX tapped into a rich moisture plume from the Pacific Ocean and brought widespread rainfall to the area. Even a few thunderstorms developed with this storm. Some locations across the southern portions of the South Plains and Rolling Plains received more than two inches of rainfall. More information can be found HERE.
26th-28th: Two upper-level storm systems passed quickly across West Texas right before Thanksgiving. The first brought gusty winds and blowing dust, the second brought a wintry mix of precipitation, totaling about a quarter to half inch of liquid equivalent for most of the area. See the details on these storms HERE.
30th: A upper-level storm system moving across the plains brought gusty westerly winds to West Texas. Wind gusts of 55 to 65 mph caused some minor damage. Read more about it HERE.
DECEMBER:
27th-28th: A powerful winter storm generated widespread showers and thunderstorms to close out the year. Rain totals from a quarter to three quarters of an inch were common. Read more about this final round of rain for 2019 HERE.


 The main weather themes of 2019 were the overall warmth, the active spring (23 total tornadoes) and a wet fall. The year ended as the 21st warmest on record in Lubbock, finishing with an average yearly temperature of 61.5 degrees. Precipitation was fairly regular through the spring and early summer, nearly ceased during the second half of the summer, and returned in frequency and robustness in the fall. The fall wetness helped subdue an emerging late-summer drought. In total, 24.37 inches of precipitation fell at Lubbock during 2019, which was the 18th wettest in the historical record and over 5 inches above average.
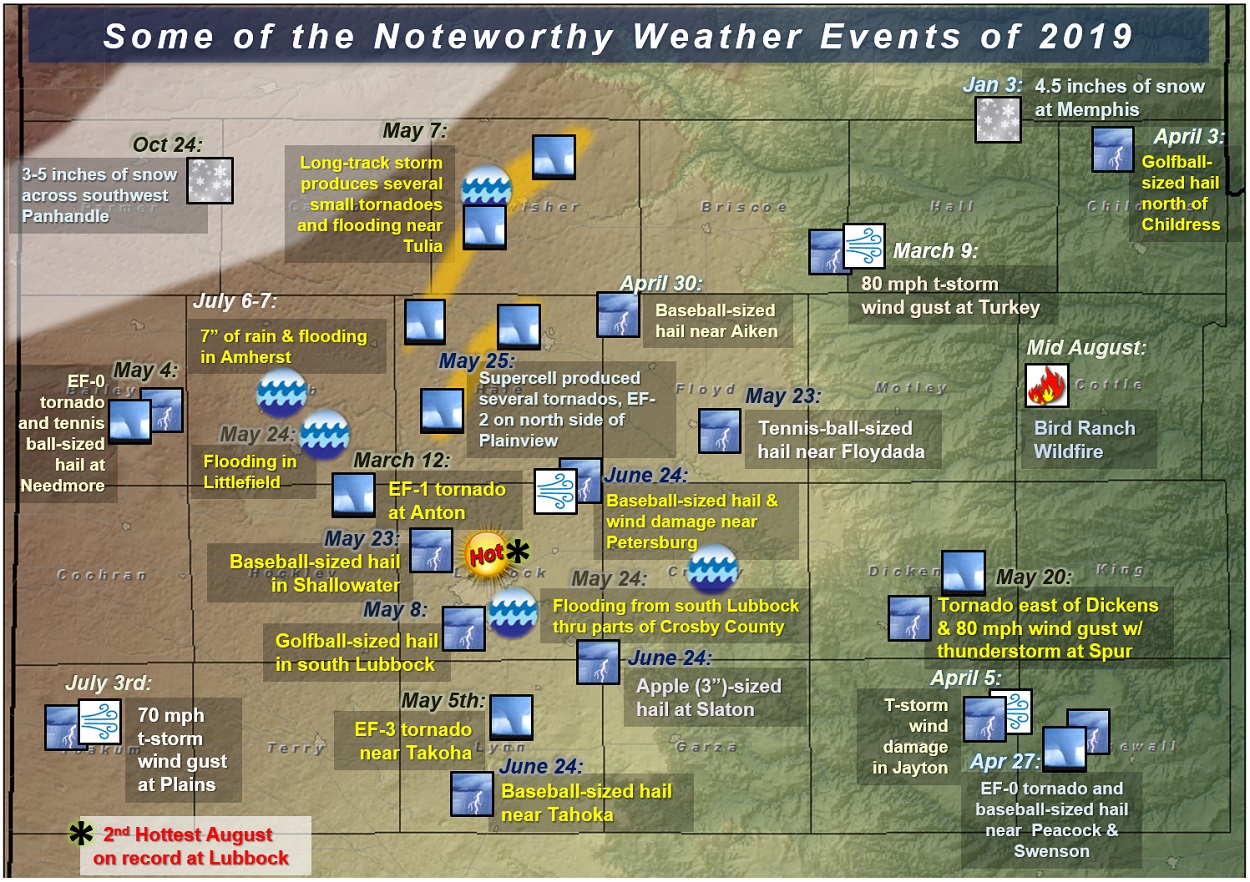

