Heat Across the Center of the Nation; Severe Thunderstorms Across the Great Lakes and Ohio Valley
Heat expands across the Desert Southwest, Plains, Mississippi Valley and Midwest into Monday. Fire weather concerns continue for portions of the Intermountain West. Active monsoonal moisture fuels thunderstorms over the Southwest with possible flash flooding. Tropical cyclone Fausto in the Pacific, should weaken as it approaches Hawaii; Dangerous surf, swells and rip currents are expected.
Read More >
The main weather story of 2017 was the overall warmth. The year ended as the third warmest on record, overtaking 2016 from this distinction by finishing with an average yearly temperature of 63 degrees. Precipitation was regular and heavy enough to keep drought conditions from developing on more than localized and modest levels. 21.95 inches of precipitation fell at Lubbock during 2017, which was the 31st wettest in the historical record.
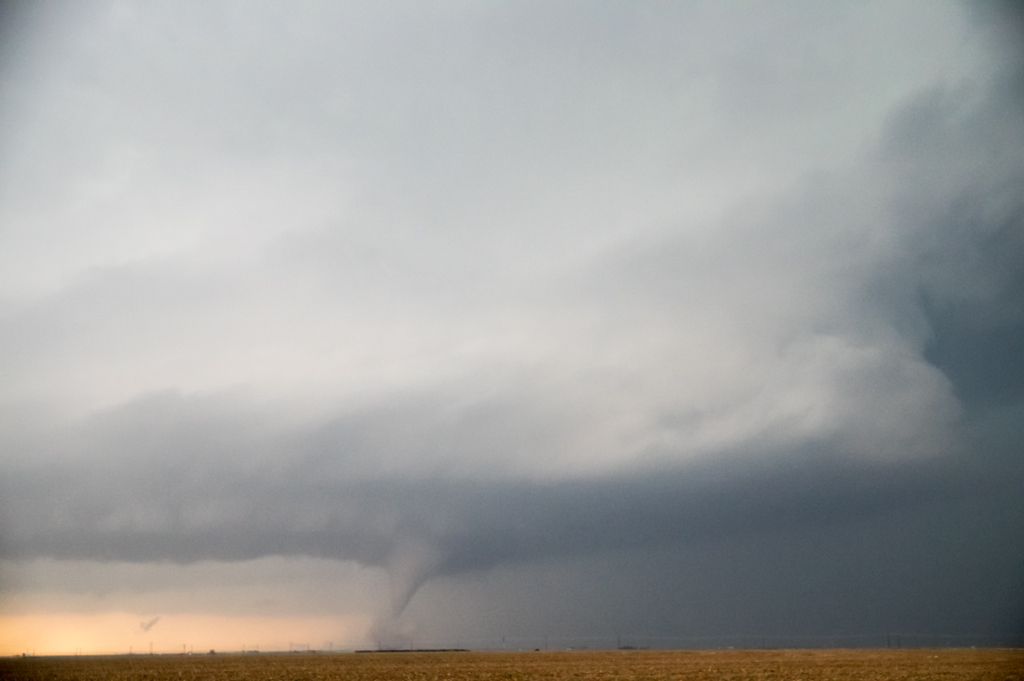
The first four months of the year were much warmer than average with precipitation on the lean side. Severe weather season brought several rounds of intense thunderstorms. Large hail caused some property damage in some towns across the area as did some thunderstorm downbursts. A large tornado barely missed the town of Dimmitt in April. Rain really picked up across the area during the summer into early Autumn, and much of the far southwest Texas Panhandle experienced a very wet year overall. The increase in moisture also brought some welcome cooler summer temperatures. Autumn was generally mild with a few more severe and heavy rainfall episodes, but precipitation really dwindled in the last two months. An arctic front brought very cold temperatures to the region to close out 2017.
2017 Map of Significant Weather Events
The map below highlights some of the more significant weather events that occurred across the area in 2017. Severe weather season kicked off a bit early with severe thunderstorms in late March, one of which produced an EF-1 tornado at Pitchfork Ranch. In April, a supercell thunderstorm moving from east-central Parmer County through much of Castro County produced numerous small tornadoes and one large tornado west of Dimmitt that was rated an EF-3. This was the strongest tornado reported to the west of I-27 in many years. May also was an active period with severe weather outbreaks in the western South Plains and also the southeast Texas Panhandle. Thunderstorm activity became more sporadic in June and July but severe hail and wind storms still produced some damage. August saw an intense thunderstorm impact the town of Turkey in Hall County. September and October, although relatively quiet overall, brought a couple of significant thunderstorm events, one which produced damaging winds at Petersburg and Cone, and another which resulted in flooding across portions of Hall and Childress Counties.
Map displaying many of the more notable weather impacts to the region in 2017. Note that this is just a sampling of events, many more have been omitted due to space constraints. Click on the image to view a larger map.
Twenty one tornadoes were observed in the Lubbock 24-county service area in 2017, well above the eight observed the previous year, and five reported in 2015. This was also the first time since 2009, when 31 tornadoes were observed, that the yearly total finished above the long-term yearly average of 18. Seven tornadoes occurred in March, seven in April and seven in May. The 21 observed tornadoes occurred over the course of four days, March 28th, April 14th, May 9th and May 10th. The most significant and damaging tornado of the year occurred on the evening of April 14th just west and northwest of Dimmitt. This significant tornado lasted for around a half hour, was over a mile wide at its largest and damaged or destroyed several structures, including three homesteads. The tornado damage earned an EF3 rating. Thankfully, no people were injured by this large, intense, slow-moving tornado. The only other tornado of 2017 to garner an EF rating above EF0 was a brief tornado that touched down on Pitchfork Ranch where it damaged a building as well as several trees, garnering an EF1 rating. The remainder of the tornadoes in 2017 were relatively brief and occurred in remote areas doing little to no known damage.
Precipitation Summary
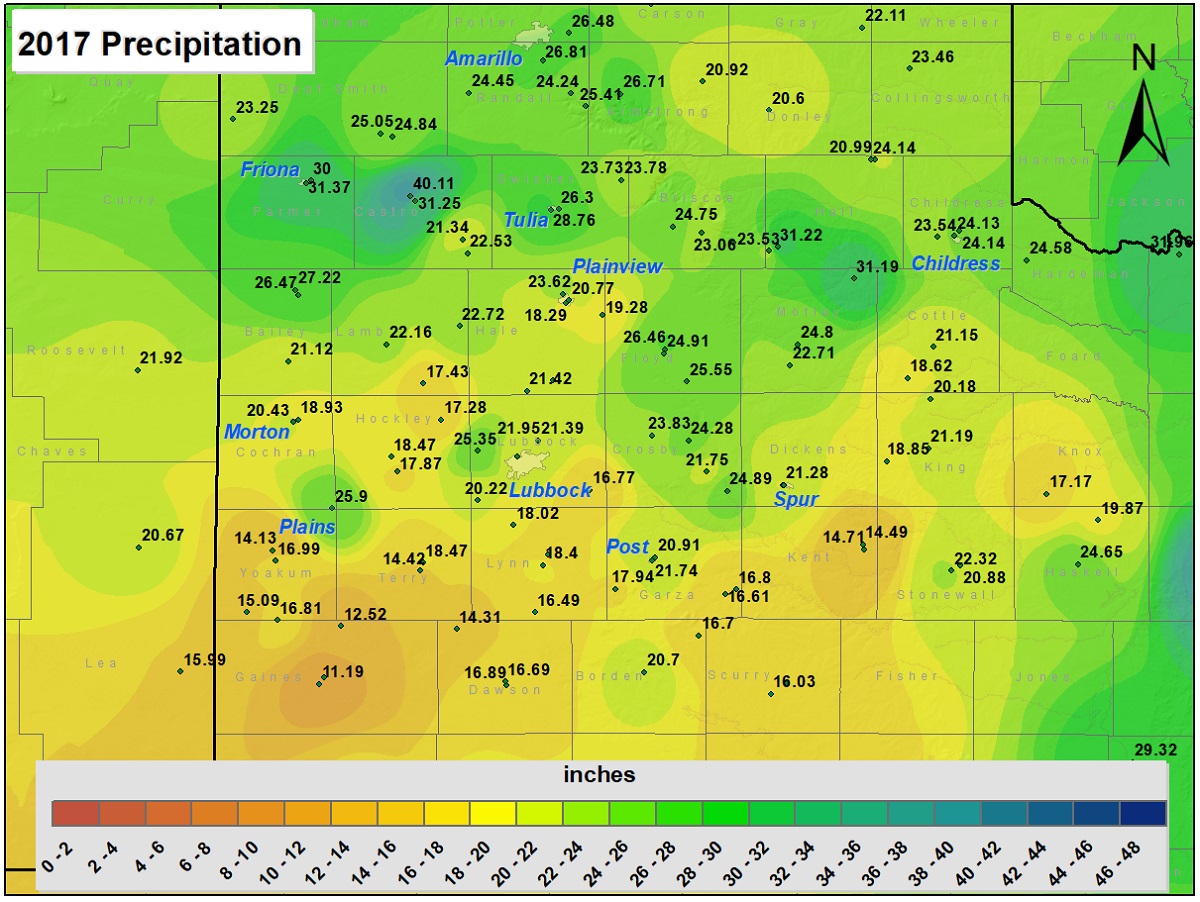
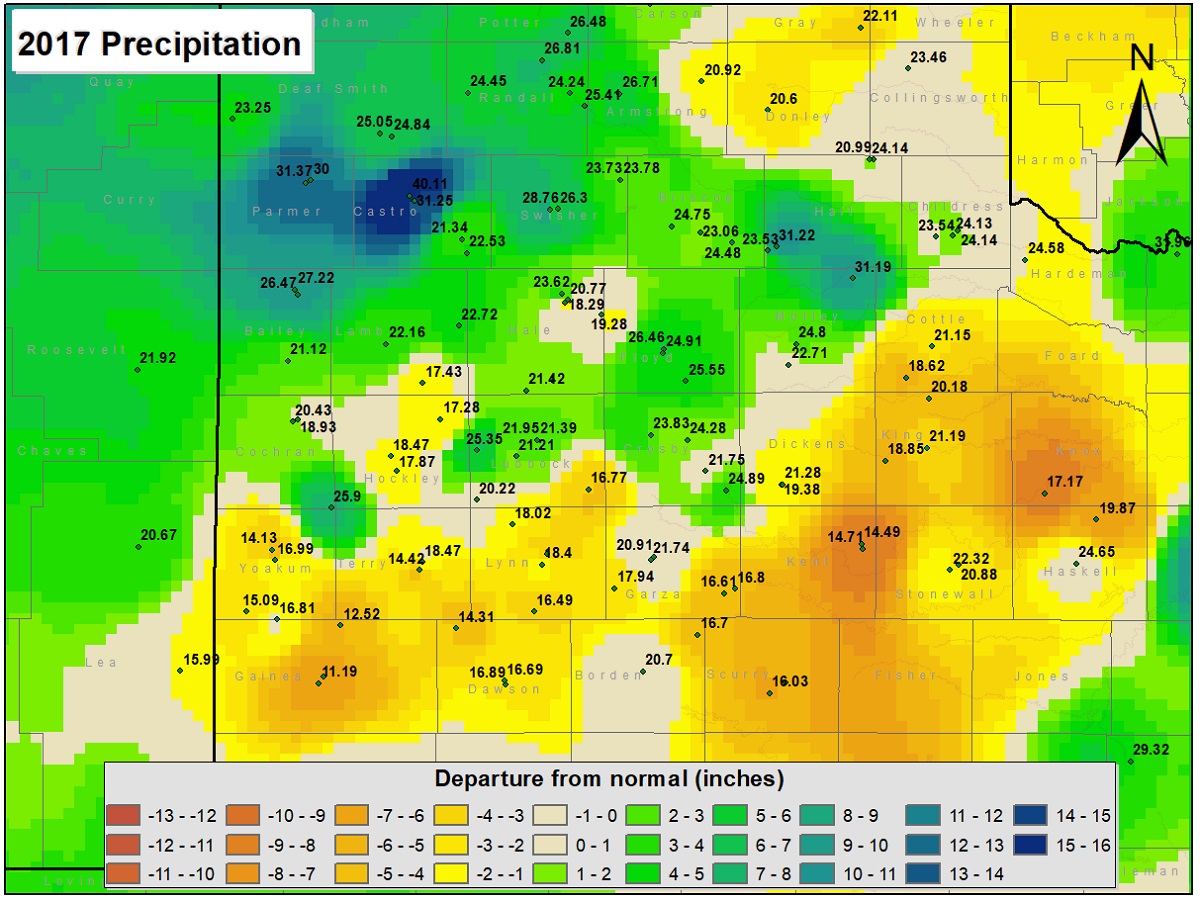
This map displays the 2017 year precipitation totals. The map was created with data gathered from the NWS Cooperative observers and the West Texas Mesonet. Click on the map to view a full-sized version.
Precipitation in 2017 varied greatly, but generally favored the northern areas, with lower totals with southern extent. The biggest winners were found across the southern Texas Panhandle, particularly over parts of Parmer, Castro, Hall and Motley Counties where totals in excess of 30 inches occurred. Rain totals were mixed across the central South Plains into the central Rolling Plains, varying from 16 to 25 inches. The southern South and Rolling Plains, on average, were the lowest, ranging from under 15 inches over parts of the southwest South Plains as well as around Jayton in the Rolling Plains, to just over 20 inches.
Lubbock International Airport officially recorded 21.95 inches of precipitation, nearly three inches above the long-term average of 19.12 inches. This was fairly representative of the city of Lubbock, though the southeast portion of Lubbock County didn't fare as well. Slaton only recorded 16.77 inches for the year.
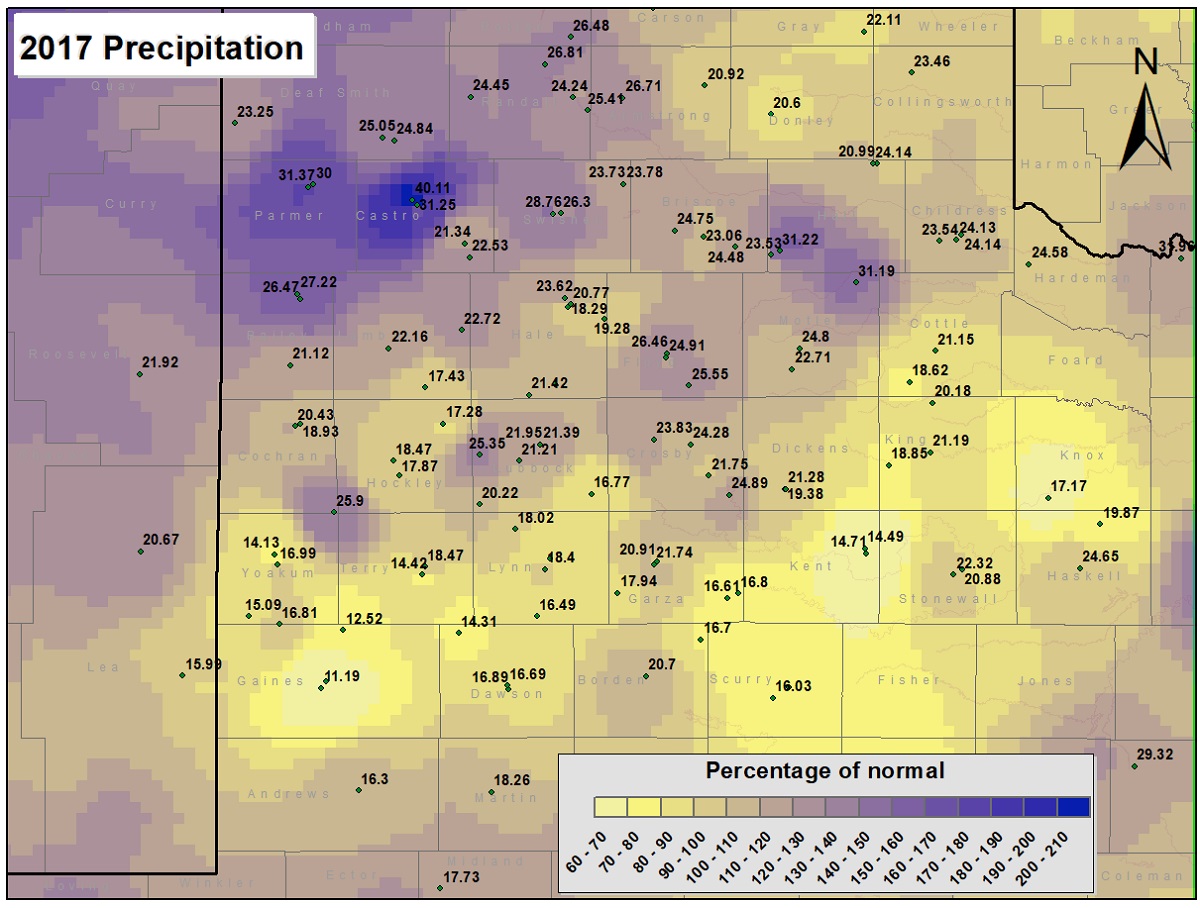
The map below shows the 2017 precipitation as a percent of the long-term average, or "normal". This image shows a dry region extending from the southern South Plains into the central and southern Rolling Plains. The driest areas with respect to normal were in and around Jayton as well as around Seminole where totals were less than 70 percent of average. On the other side of the spectrum, well above average precipitation, from 150 to 200 percent of normal, fell across the southwest Texas Panhandle into the northwest South Plains, from Muleshoe through Friona and Dimmitt.
This map shows the 2016 rainfall as a percent of the 30-year normal rainfall (1971-2000). Also plotted is the rainfall observed, in inches, at each collection site. Please click on the map to view a full-sized version. If you would like to see the precipitation as a departure from normal please CLICK HERE.
Drought Update and Reservoir Levels
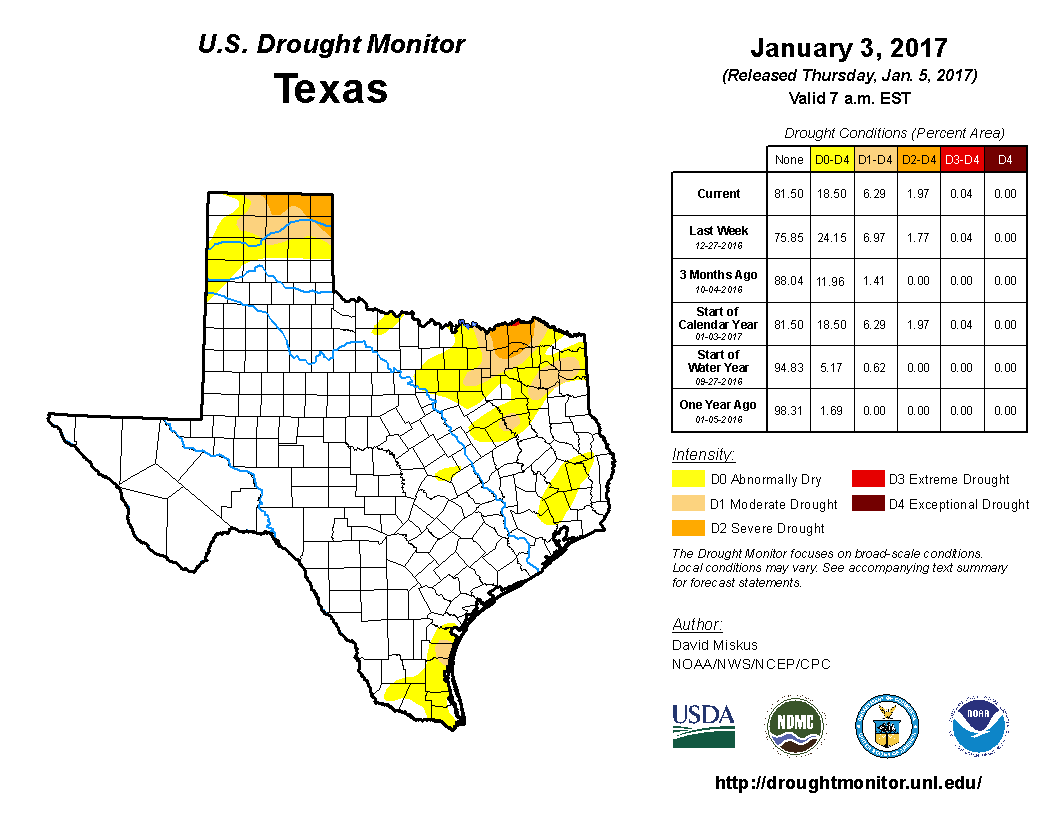
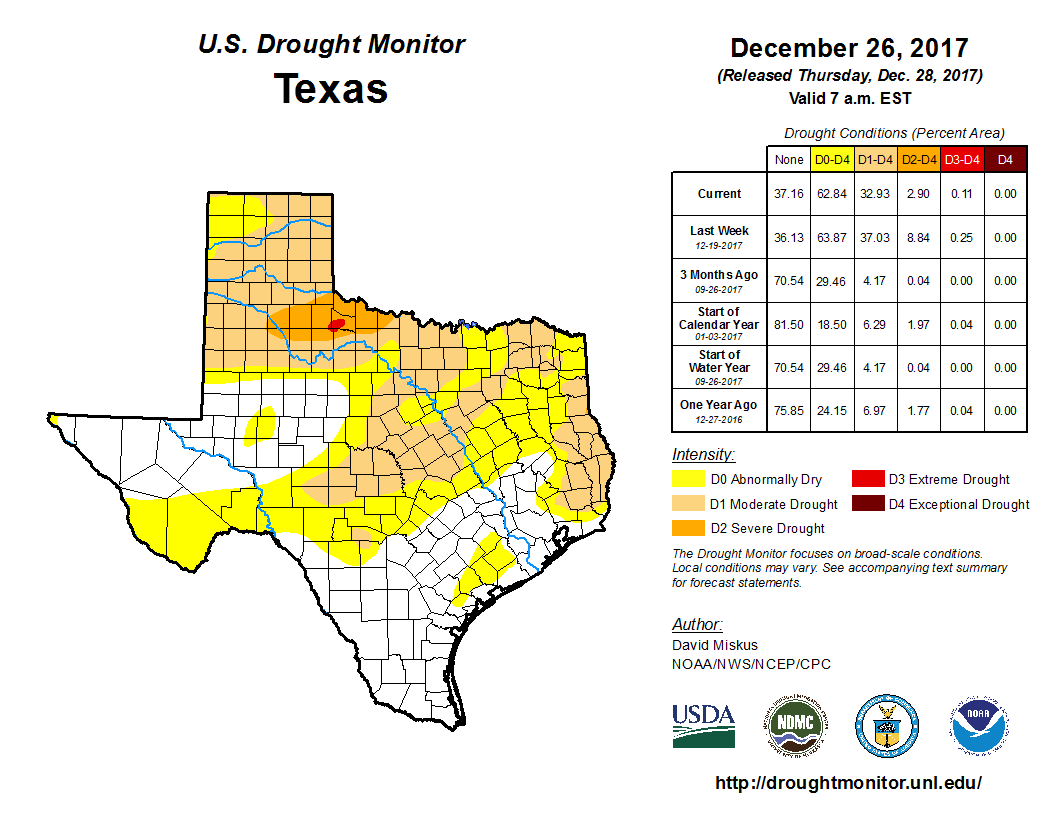
The year started on a decent note with no drought in the South Plains or Rolling Plains, though severe drought (D2) was present over portions of the Texas Panhandle and North Texas. Through the course of the spring and summer portions of the Rolling Plains did stray into moderate and severe drought (D1-D2), while the South Plains generally remained drought free. Widespread heavy rain in August did vanquish the drought for the entire region. However, the year closed out on a dry note, with the final three months bringing very little rain. This allowed drought conditions to reemerge over much of northwest Texas.
This map shows the drought conditions on January 3, 2017. Click on the map to view a full-sized version.
This map shows the drought conditions on December 26th, 2017. Click on the map to view a full-sized version.
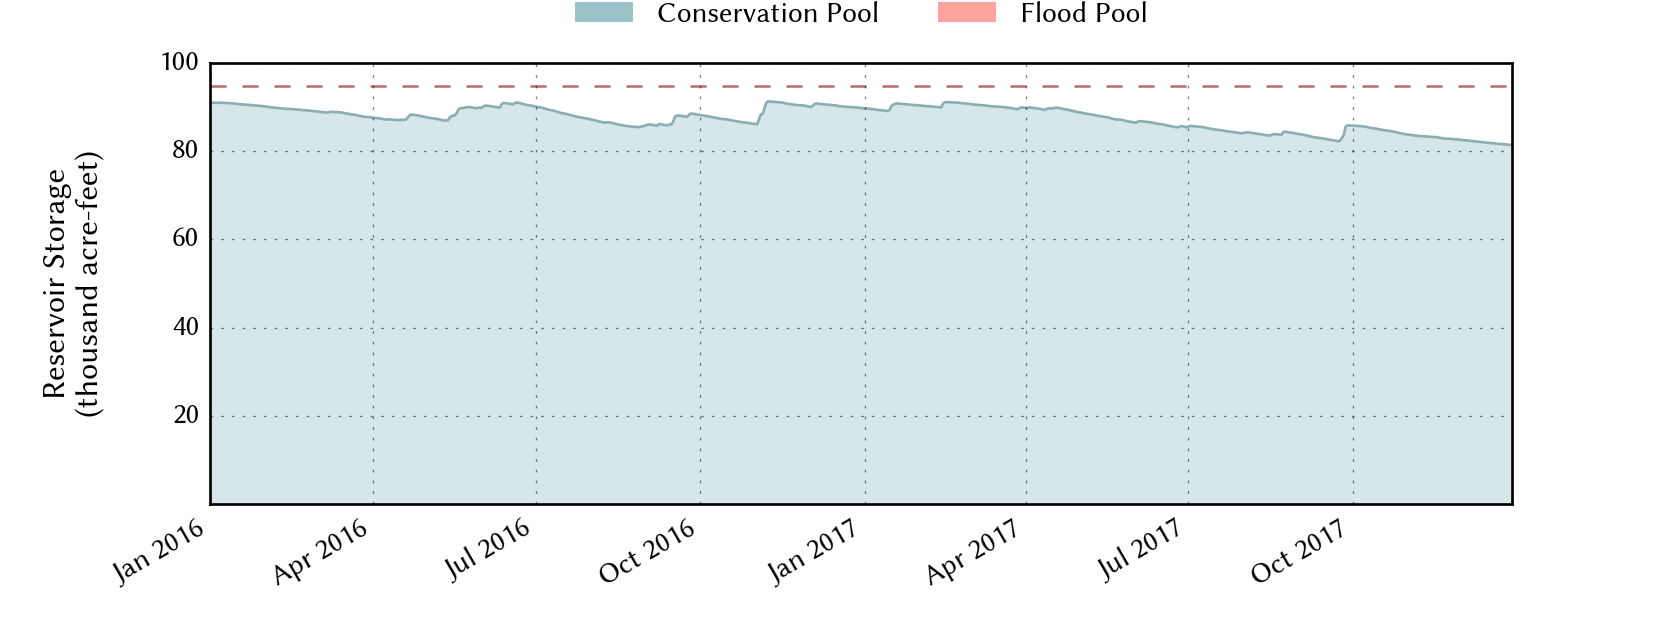
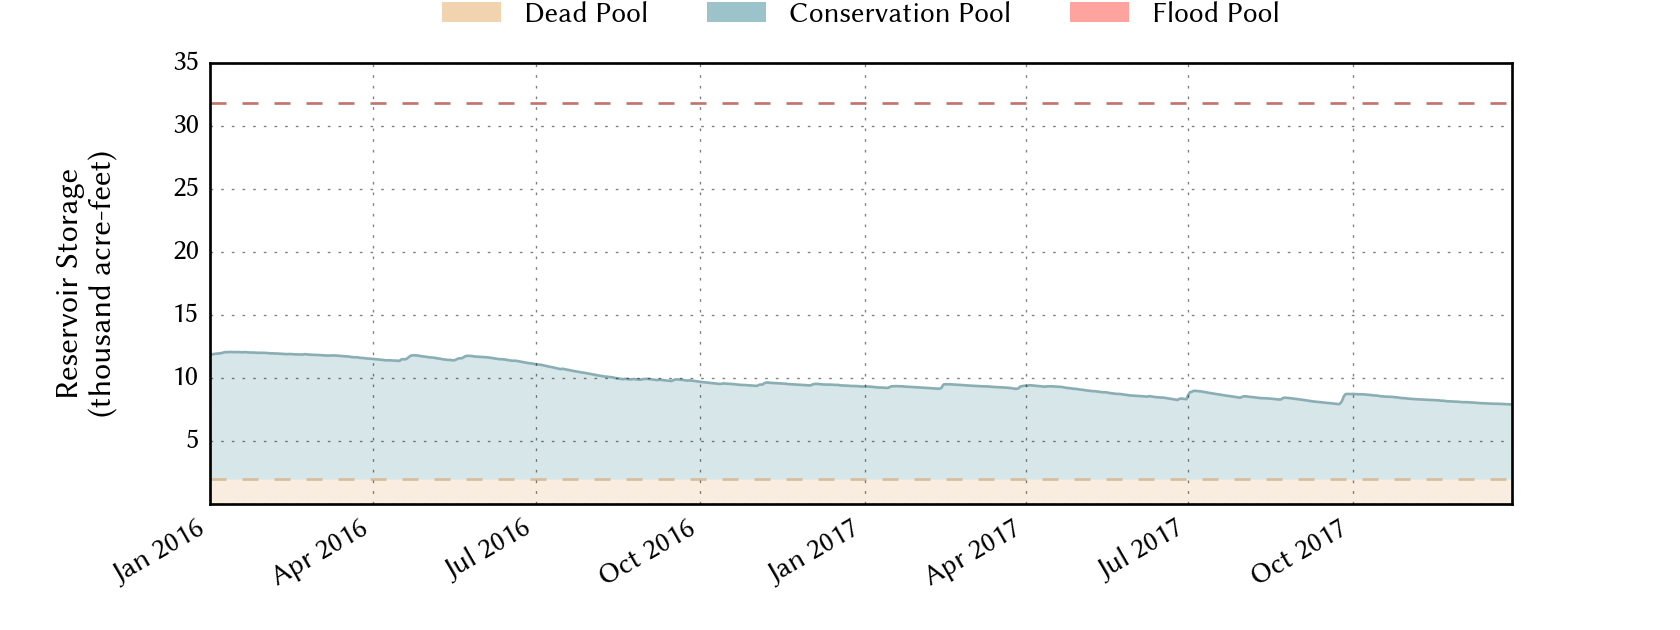
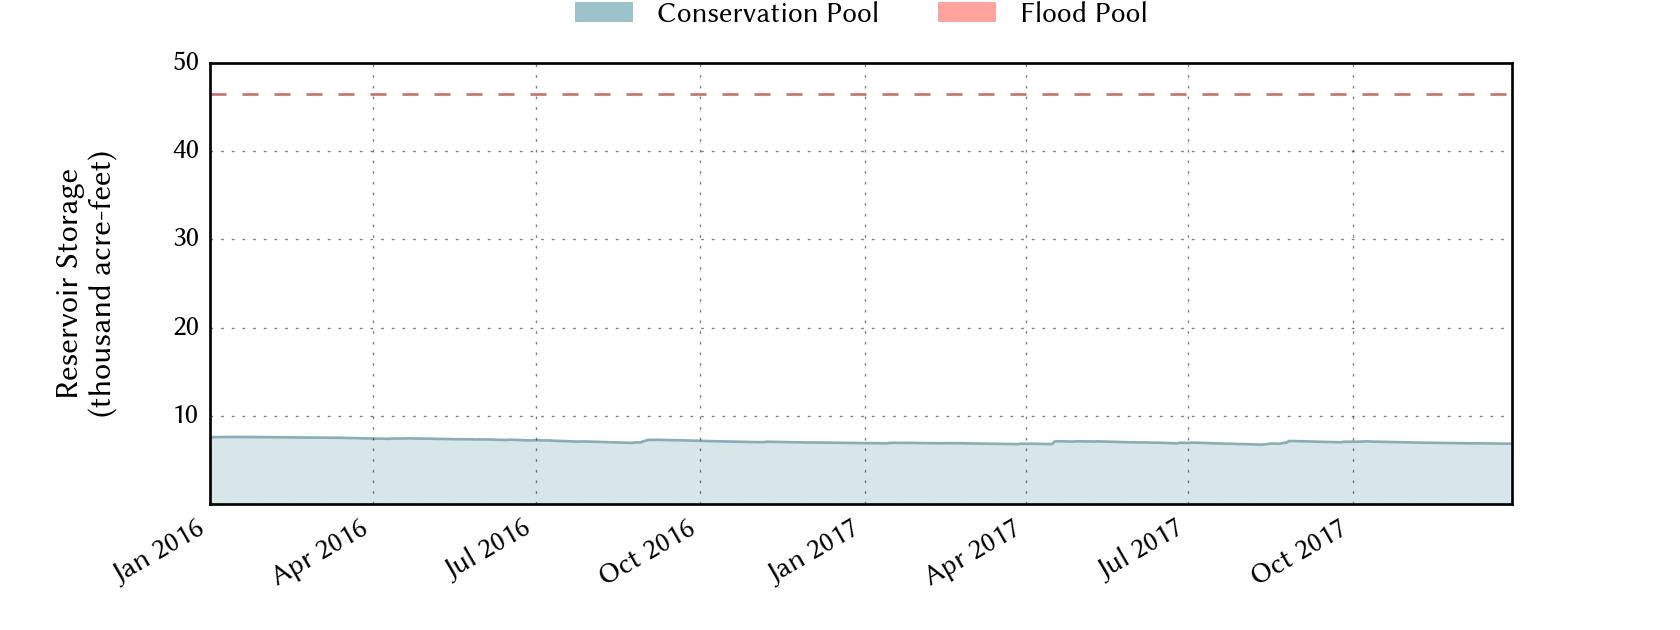
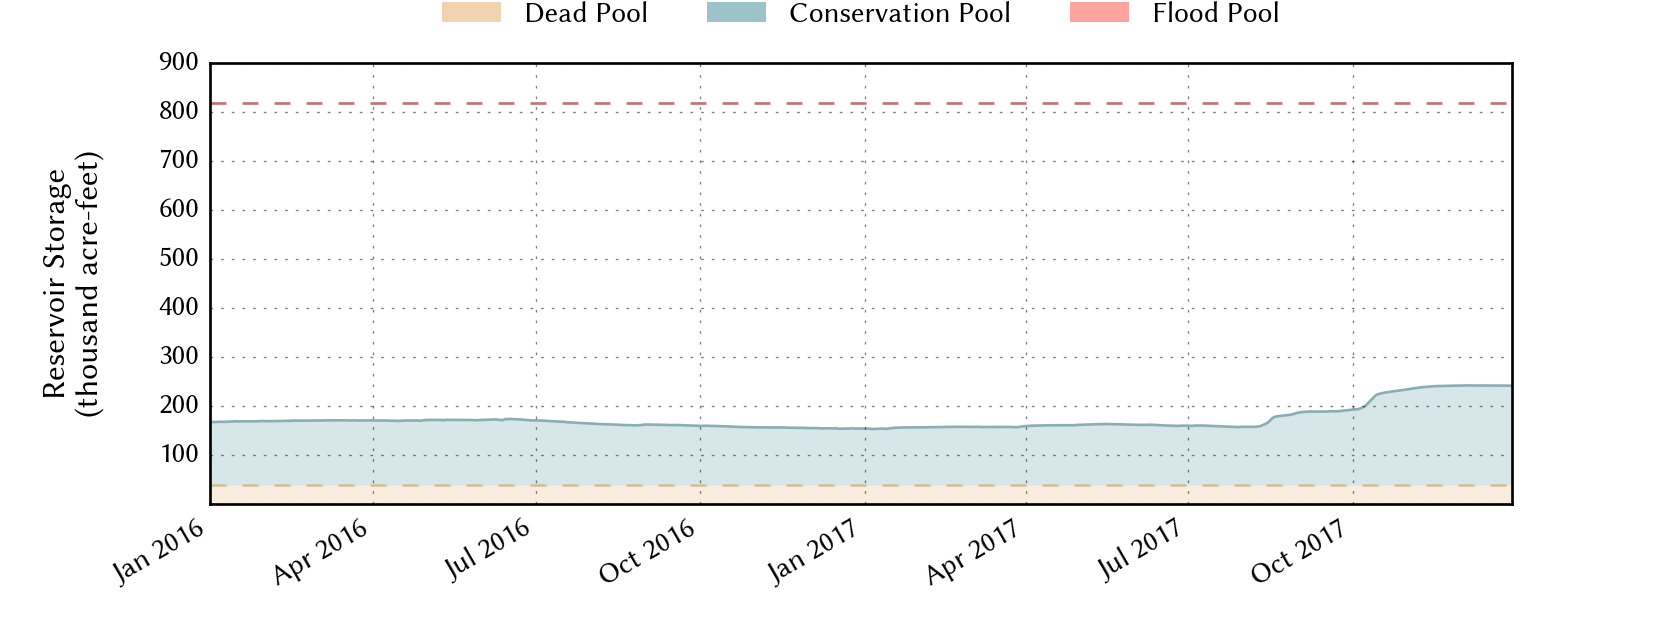
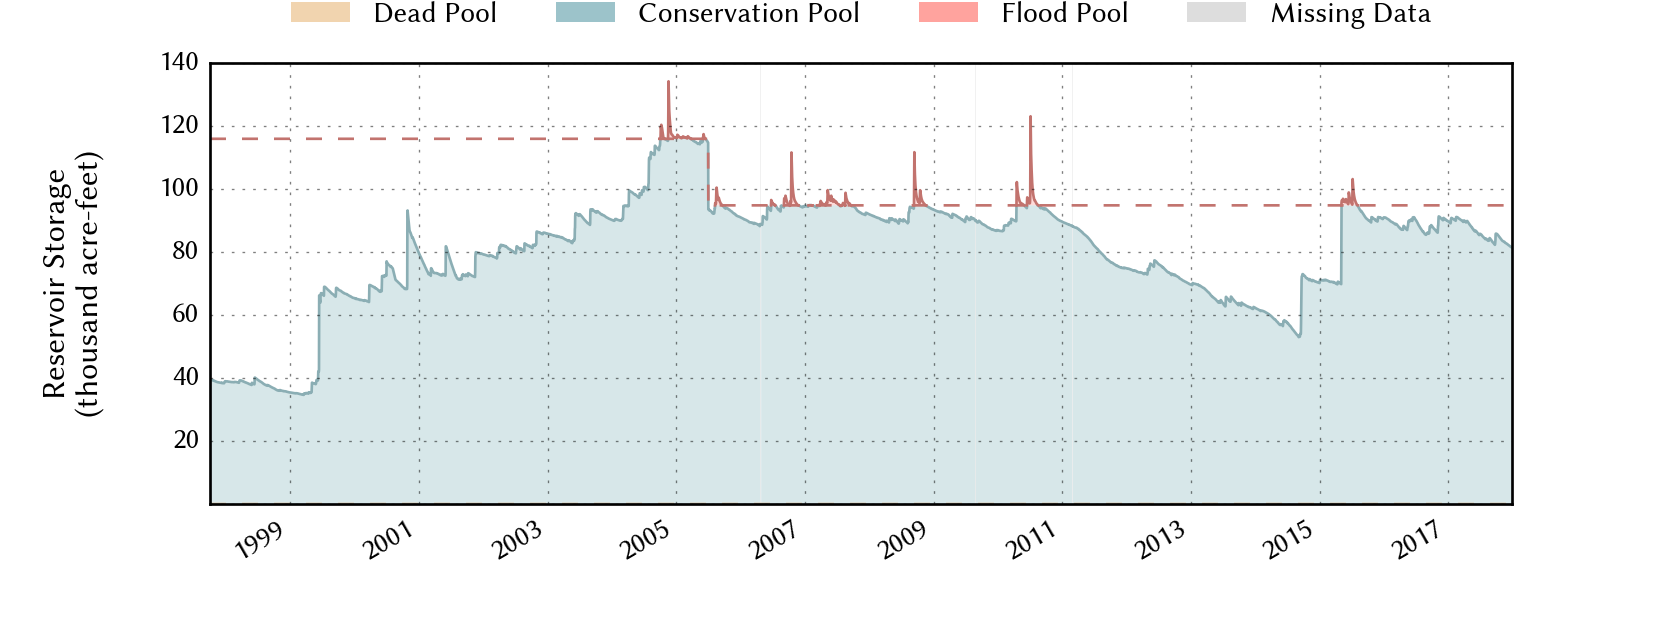
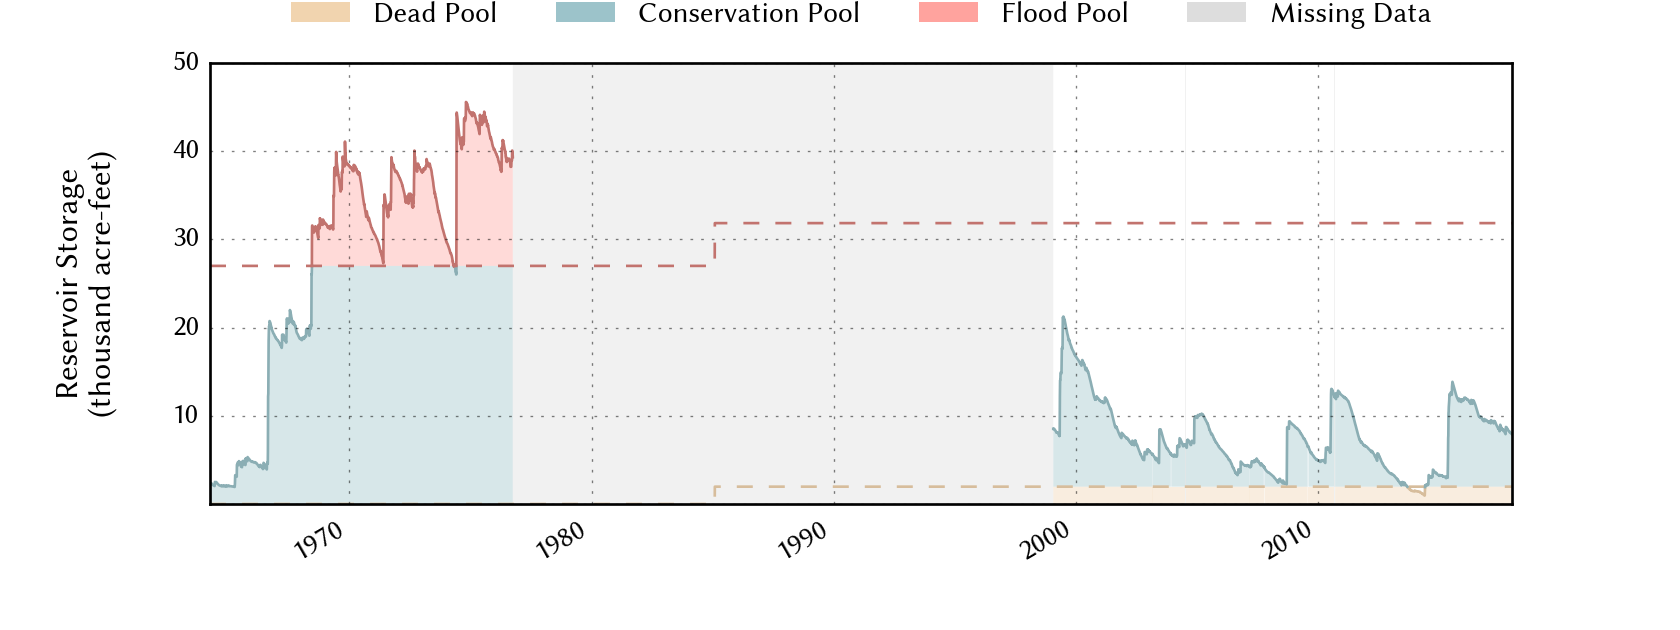
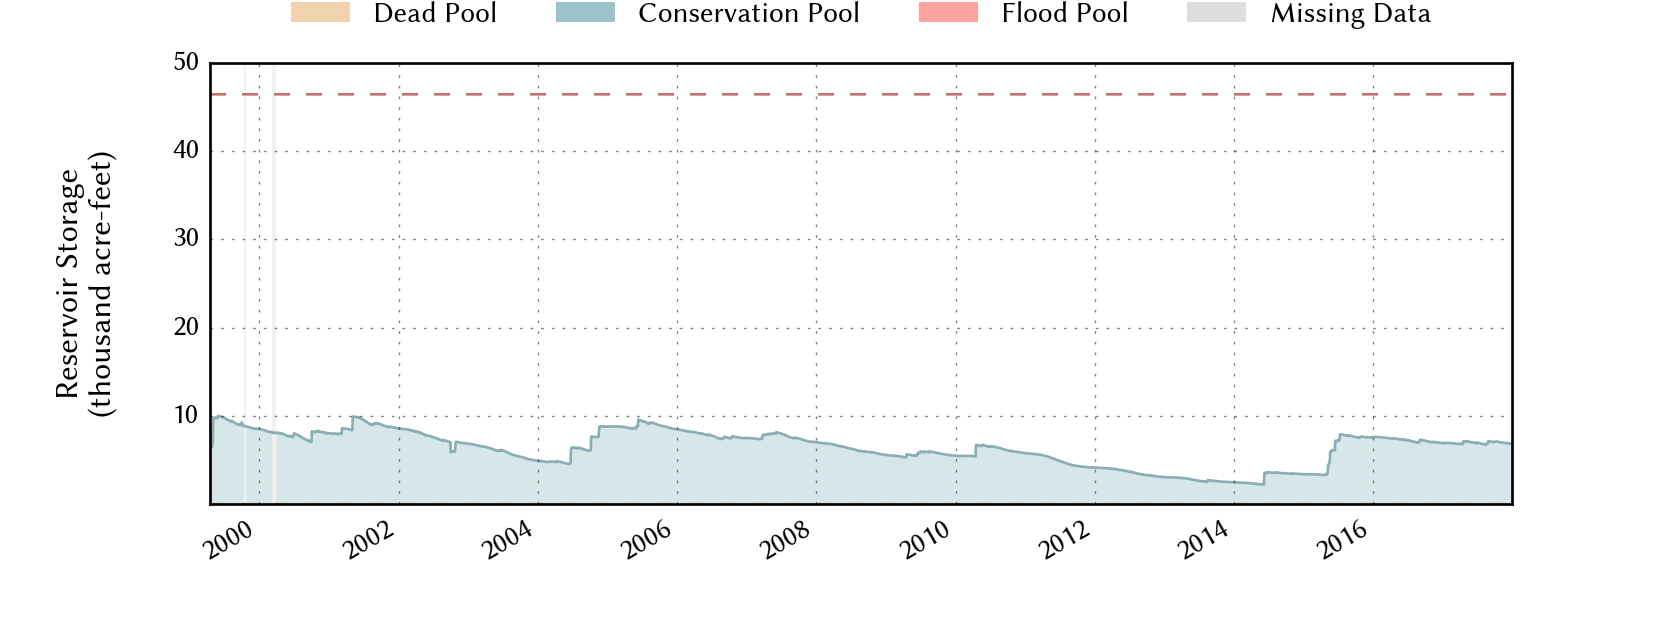
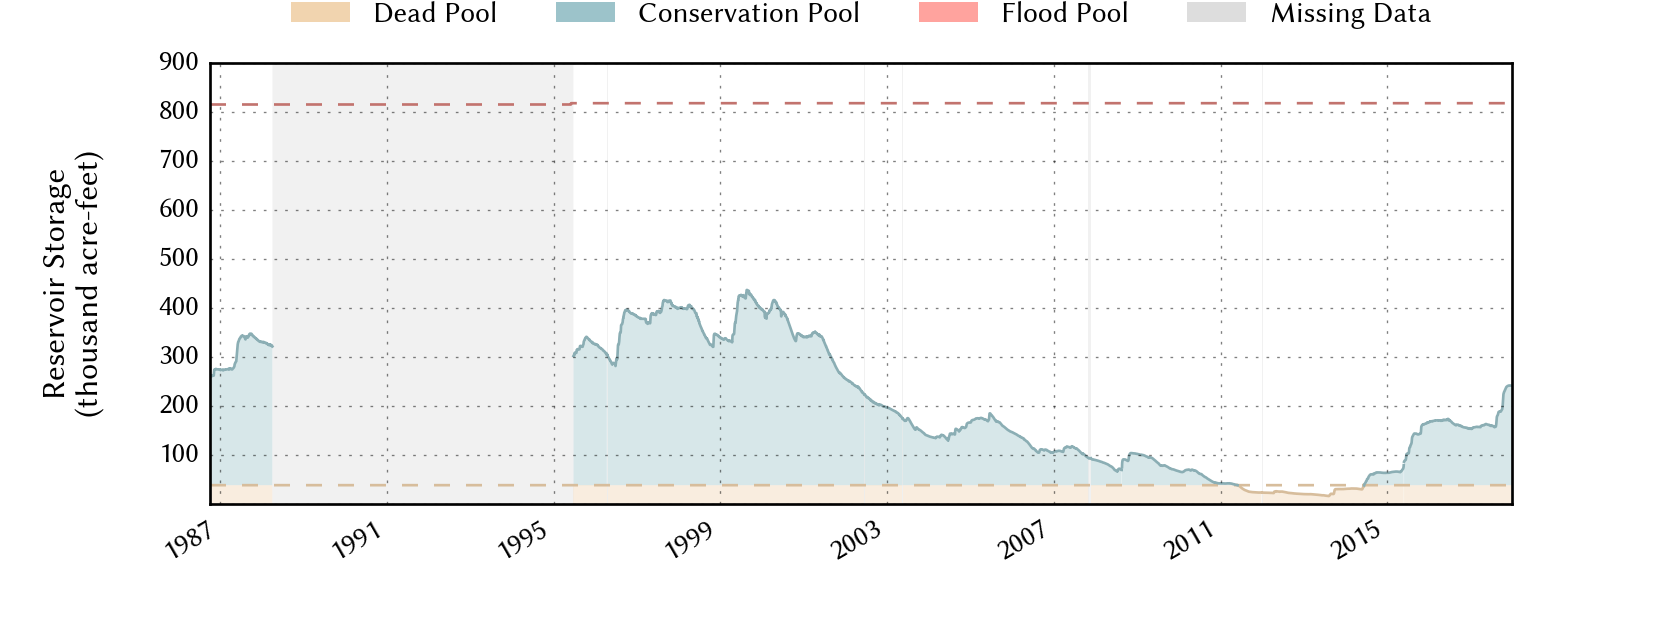
The overall lack of drought and relatively regular precipitation (by West Texas' standards) through the course of 2017 helped maintain fairly steady lake and reservoir levels. Lake Alan Henry's water level held firm into May, but gradually decreased through the summer and fall, aside from a brief rise in September. Over the course of the year Lake Alan Henry's capacity fell from 95% in January to 86% by late December. White River Lake and Lake Mackenzie both experienced a slight decline over the course of the year, dropping from 25% to 20% and 18% to 17%, respectively. In contrast, Lake Meredith's water level held steady through the summer and then rose during the fall as water was released from Ute Lake upstream. As a result, Lake Meredith's levels rose from 23% of capacity to 41% over the course of the year.
Recent plot of the water level for Lake Alan Henry. Click on the image for a full-sized version. A longer record of data for Lake Alan Henry can also be VIEWED HERE. The graphs are courtesy of: www.waterdatafortexas.org
Recent plot of the water level for White River Lake. Click on the image for a full-sized version. A longer record of data for White River Lake can also be VIEWED HERE. The graphs are courtesy of: www.waterdatafortexas.org
Recent plot of the water level for Mackenzie Reservoir. Click on the image for a full-sized version. A longer record of data for Mackenzie Reservoir can also be VIEWED HERE. The graphs are courtesy of: www.waterdatafortexas.org
Recent plot of the water level for Lake Meredith. Click on the image for a full-sized version. A longer record of data for Lake Meredith can also be VIEWED HERE. The graphs are courtesy of: www.waterdatafortexas.org
Lubbock Statistics
2017 will go down in the books as the third warmest and 31st wettest year since records began in 1911 at Lubbock. Warm temperatures prevailed most of the year, with May and August being the only months to finish with below average mean temperatures. The warmest months, with respect to average, were February (+7.5°F), March (+7.3°F) and November (+4.7°F). The coolest months, with respect to average, were August (-2.6°F) and May (-0.2°F).
Precipitation was fairly steady through 2017, aside from two distinct dry stretches, one for much of May and June and a concluding stretch encompassing the final three months of the year. Though the two dry stretches were significant, the first part of the year coupled with several bursts of rainfall from mid-summer through mid-fall overcompensated and allowed the year to finish with above average rainfall. Snowfall was tough to come by in 2017 with the Lubbock Airport only record 0.5 inches total, 0.2 inches falling January 6th and the final 0.3 inches falling on the final day of the year. Trace amounts of snow were also observed in February and April. The Lubbock Airport recorded a total of 21.95 inches of precipitation for 2017, finishing just shy of 3 inches above average. Although the yearly precipitation finished on the high side of average only 5 months recorded above average precipitation (January, February, July, August and September), while December recorded no measurable precipitation. Six daily record rainfalls were set in 2017: 0.97 inches on January 15th; 0.87 inches on February 13th; 0.79 inches on April 12th; 1.25 inches on July 4th; 1.16 inches on July 31st; and 1.76 inches on August 1st. Over an inch of rain was recorded on four days at the Lubbock Airport in 2017: August 1st (1.76"); July 16th (1.76"); July 4th (1.25"); and July 31st (1.16").
The hottest temperature in 2017 was a scorching 112 degrees, reached on June 17th. This tied June 26, 2011 as the 2nd hottest reading on record, and was only 2 degrees shy of the all-time record of 114°F set on June 27, 1994. The high reached or exceed 105 degrees on one other occasion, June 29th, when it made it to 107°F. In all temperatures reached the triple digits on 11 occasions, which was close to the long term average of 10. On the other side of the pendulum, the coldest temperature of the year was 7 degrees, experienced January 7th. Only seven nights fell below 20°F for the entire year, three in early January and four in late December. Fourteen record highs were tied or set in 2017: 81°F on January 9th; 80°F on January 11th; 88°F on February 10th; 91°F on February 11th; 87°F on March 16th; 89°F on March 19th; 93°F on March 20th; 93°F on April 8th; 102°F on May 25th; 112°F on June 17th; 107°F on June 29th; 88°F on November 4th; 88°F on November 17th; and 84°F on November 24th. In addition, 9 record high minimum temperatures were set in 2017. No record low was set in 2017. One record low maximum temperatures was set in 2017; 23°F on January 6th.
LUBBOCK
Average High
Average Low
Precip (inches)
January
56.9
30.6
2.03
February
68.0
36.0
0.89
March
74.7
43.6
0.67
April
76.6
48.9
1.32
May
85.5
53.6
0.58
June
94.4
66.9
1.78
July
92.9
69.2
5.48
August
87.4
65.4
4.85
September
84.7
59.9
3.46
October
75.8
48.6
0.50
November
69.9
39.2
0.03
December
56.9
27.0
T
Annual
77.0
(8th warmest)
49.1
(3rd warmest)
21.95
(31st wettest)
Normal
74.3
47.0
19.12
Departure
+2.7
+2.1
+2.83
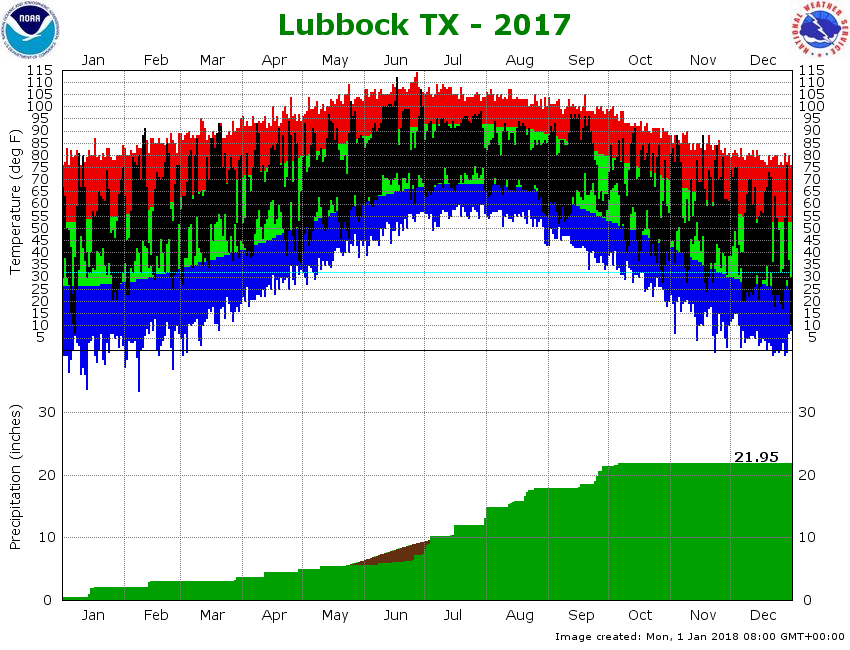
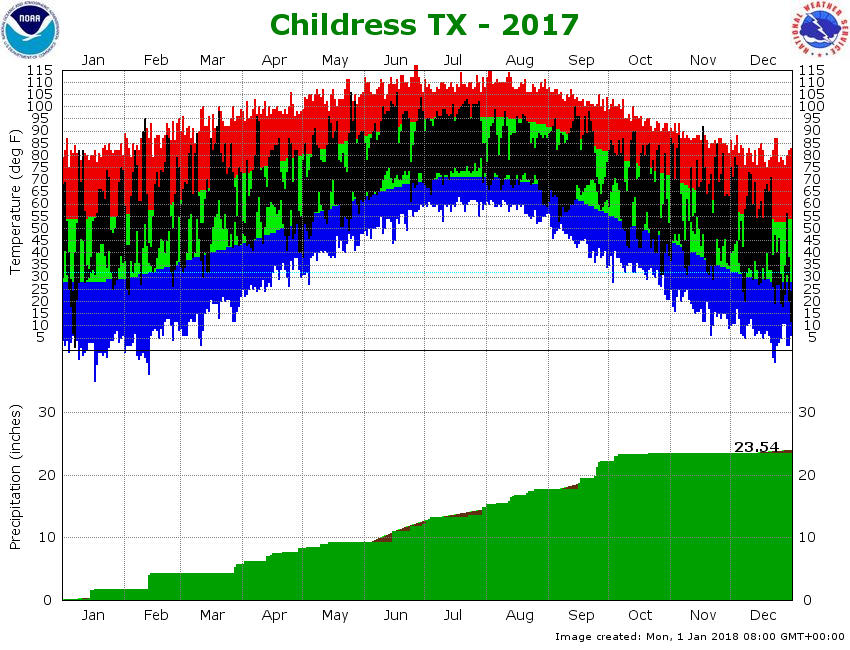
The top portion of the below graph shows the daily high and low temperature distribution for 2017 at Lubbock Preston Smith International Airport. Most of the year we saw temperatures at or above average, with 10 of the 12 months finishing warmer than average. February and March were particularly warm, setting several record highs and both finishing over 7 degrees above average. Fortunately, the two months that finished below average were May and August, which not too many people complained about. Even with the overall warm year, there were a few cool stretches including one short but cold shot of Arctic air in early January which brought us the coldest reading of the year, a low of 7 degrees on January 7th. After the hottest day of the year, a whopping 112 degrees on June 17th, a cold front and then more regular rain through the remainder of the summer helped temper temperatures through July and August. Once things dried out in October temperatures varied more significantly though still generally ran on the warm side of average.
(Top) Plot of the maximum and minimum temperatures (connected by a black line) observed at the Lubbock Preston Smith International Airport in 2017. Also plotted are the respective normals (green - range of average highs and lows) and record highs (red) and record lows (blue) for each date. Units are in degrees Fahrenheit. (Bottom) Plot of the rain accumulation (green), in inches, observed at the Lubbock Preston Smith International Airport in 2017. Also plotted is the distribution of the average rainfall (brown). Click on the graph for a larger view. Click HERE to view the graph for Childress.
The lower portion of the chart above shows how much rain accumulated through 2017. Lubbock finished with a grand total of 21.95 inches, nearly three inches above the 30-year average. The year started on the right note, with a line of thunderstorms bring 0.38 inches of rain on New Year's Day. This surplus, helped by occasional rain through April, lasted into May before falling below average during a relatively dry stretch. Thankfully, after a sluggish late spring and early summer, more regular and occasionally heavy rain fell from July into early October. The relatively moist mid-late summer and early fall ensured a wetter-than-average year, though the year did close out on a dry note, including only 0.03 inches of rain falling in the final two months.
2017 snowfall in Lubbock was a paltry 0.5 inches, the sum of two minor events. This is well below the relatively modest average of 8.2 inches. The 0.5 inches of snow ranks as the fifth lowest yearly total on record and is the lowest annual snowfall recorded since 1953 when only a trace of snow fell.
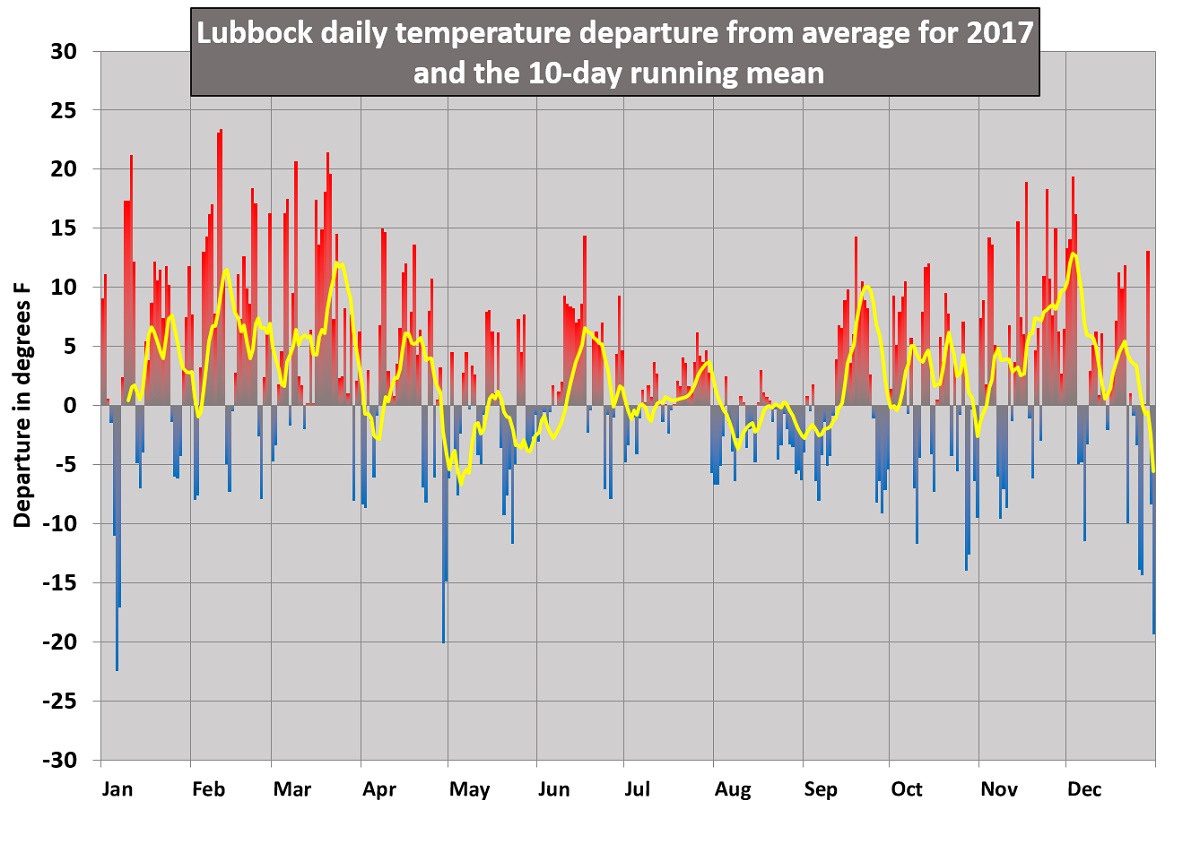
The graph above shows the 2017 daily temperature and a 10-day running mean (yellow line) at Lubbock as a departure from the 1981-2010 normals. Click on the graph for a larger view.
The graph above displays the daily temperature as the departure from the "normal", or 30-year average temperature. The yellow line represents the 10-day running mean of the daily temperature departure and is used to smooth out the day-to-day extremes so that longer trends are easier to see. It is pretty easy to see that above average temperatures dominated much of 2017. Still, there were a few short cold snaps to start and end the year, and cool periods during May and August. Overall, the average temperature of 63.1 degrees at Lubbock for the entire year was 1.5 degrees above the 30-year average, and made for the 3rd warmest year in the historical record for Lubbock.
2017 Monthly Highlights
JANUARY:
1st: The New Year kicked off on a rare wet note. A complex of thunderstorms brought measurable rain for only the 12th time on record on New Year's Day in Lubbock. Read more about this wet start to 2017 HERE. 5th-6th: A couple of cold fronts brought the coldest air of the year into the South Plains region. Additionally, two weak upper level storm system managed to squeeze out a couple of rounds of snow across northwest Texas. Many spots received from a dusting to a few inches of snow. Read more about this cold and wintry stretch HERE. 14th-15th: A powerful upper level storm system brought copious amounts of moisture to West Texas on this mid-January weekend. Most of this moisture fell as a cold rain, though some freezing rain and snow did also fall over locations generally north of Lubbock. A full write up of this relatively rare wet January weekend can be READ HERE.
FEBRUARY:
1-28th: Consistent warm temperatures made February 2017 the warmest on record, eclipsing the previous record, February 1932, but an impressive 0.5 degrees. February 11th saw the temperature soar to 91 degrees in Lubbock, the warmest February temperature on record. To read a more complete summary of this record warm month CLICK HERE. 13th-14th: A strong storm system emerging from the Desert Southwest pulled abundant moisture up and over West Texas. Many locations experienced cool rain and thunderstorms, though portions of the northern South Plains into the Texas Panhandle did also get a taste of winter in the form of freezing rain, sleet and even snow. Many spots off the Caprock recorded rain totals of 1 to 3 inches over the course of a couple of days. To read more about this wet mid-February stretch CLICK HERE. 23rd: Strong winds and blowing dust affected the entire region. Wind gusts as high as 50 to 60 mph were common across the South Plains and a large wildfire scorched 13,000 acres near Channing in Oldham County. More information about this windy and dusty day can be FOUND HERE.
28th: The month closed out on windy, dry and dusty note. These conditions also supported a few wildfires, including one that burned over 9,000 acres near Sundown. For more details on this dusty day CLICK HERE.
MARCH:
7th: Many residents of the South and Rolling Plains woke up to the smell of smoke. This smoke reduced the visibility and caused some respiratory issues, but also created a colorful sunrise. The smoke originated from large fires that started the previous afternoon over the eastern Texas Panhandle, northwest Oklahoma and south-central Kansas. To view images from this smoky day FOLLOW THIS LINK. 23rd-24th: A potent upper level storm system brought two days of wind, blowing dust and a round of thunderstorms. Details on this active couple of days of weather can be FOUND HERE. 28th: This day brought the first widespread severe thunderstorms of the 2017 to the region. Several brief tornadoes were observed including one that caused EF1 damage on Pitchfork Ranch in eastern Dickens County. Hail as large as golf balls also fell southeast of Floydada, and many locations for the Texas Panhandle into the Rolling Plains recorded 1 to 2+ inches of rainfall. Learn more about this severe event HERE.
APRIL:
2nd: The month kicked off on the cool side, with light to moderate rain falling generally along and east of a Tahoka to Childress line. More on this cool start to April can be VIEWED HERE. 4th: A quick moving storm system brought strong winds, dust and isolated thunderstorms to the region. One stronger thunderstorm covered Caprock Canyons State Park in pea sized hail. Learn more about this day HERE. 12th-13th: Widespread rain and a couple of severe thunderstorms affected the South Plains. Denver City was hit hardest where golf ball size hail or larger fell. A summary of this event is AVAILABLE HERE. 14th: Very intense supercell thunderstorms produced giant hail and tornadoes. The most intense storm generated a long-lived tornado that inflicted EF-3 just west and northwest of Dimmitt. Thankfully, no injuries occurred but several homes were badly damaged. More details on these tornadic storms can be FOUND HERE. 16th: Easter Sunday brought scattered late afternoon and evening thunderstorms which dropped large hail and locally flooding rains. Hail as large as tennis balls fell west of Silverton while Brownfield recorded over 3 inches of rain and 2 inch diameter hail. Read more above this active Easter day HERE. 28th-30th: A powerful spring storm system brought thunderstorms, rain, cold temperatures, strong winds and even a little snow to northwest Texas. Widespread wind gusts of 50 to 65 mph were recorded across the Texas Panhandle into the Rolling Plains and northeast South Plains on the 30th. Learn more about the wild weekend HERE.
MAY:
9th-10th: A slow moving storm system brought a couple of rounds of severe thunderstorms to the region. The first round of storms affected the western South Plains on the evening of the 9th, producing three brief tornadoes as well as tennis ball sized hail near Enochs. The second round of severe storms affected the southeast Texas Panhandle and the northern Rolling Plains the afternoon of the 10th. Baseball sized hail fell at Cee Vee and southeast of Brice and a brief tornado was observed west of Swearingen. A summary of these two stormy days can be FOUND HERE. 14th-18th: Isolated to scattered severe storms visited the region through the middle of May. The storms were fairly spotty, but did drop severe hail in a few locations, including golf ball size hail near Justiceburg on the 16th. A more detailed write-up on these active weather days can be FOUND HERE.
JUNE:
30 May - 4 June: An unsettled stretch of weather brought isolated to scattered thunderstorms to the region. Most locations saw a little rain, with localized heavy rain. Impressively, no severe weather was reported during this stretch, though small hail and gusty winds did accompany the stronger storms. For more information, CLICK HERE.
Mid-June: The dryline was the focus for a few days of scattered severe thunderstorms. One intense storm dropped baseball sized hail on Plainview on the 12th. Another severe storm on the 15th produced an 81 mph wind gust near O'Donnell. In addition, very hot temperatures plagued the area in mid-June, with the 17th bringing temperatures from 105 to 112 degrees. Lubbock officially hit 112 degrees, tying the second hottest day on record. Details on this hot and stormy stretch can be READ HERE. 25th-26th: A late night complex of thunderstorms dumped heavy rain across much of the Caprock. Many locations across the southwest Texas Panhandle and western South Plains recorded 1 to 3 inches. Unfortunately, the most intense storms also produced damaging wind gusts measured as high as 82 mph on the south side of Muleshoe. A more detailed account of this late night event can be FOUND HERE.
30th: Scattered slow-moving thunderstorms produced large hail, highs winds and locally heavy over the southeast Texas Panhandle and Rolling Plains. Baseball size hail fell in Childress, 5 inches of rain flooded Spur and Aspermont and violent winds damaged the roof of the Aspermont Gym. Later that night, an intense storm brought destructive wind-driven baseball to softball sized hail to Anton. A more detailed account of these damaging storms can be READ HERE.
JULY:
1st-2nd: A squall line moved out of eastern New Mexico and across much of the South Plains late on the 1st into the early morning of the 2nd. Widespread rain and localized severe wind gusts occurred, including a peak gust of 65 mph near Abernathy. Details on this late night line of storms can be VIEWED HERE.
3rd-4th: A couple rounds of late afternoon and overnight storms affected the region. The line of storms that moved through during the evening of the 4th did interrupt or cancel several fireworks displays, including in Lubbock. Interestingly, the most destructive weather over this 2-day stretch was from a collapsing shower in the middle of the night that produce a heatburst and very strong winds that caused extensive damage across the north part of Levelland. Details on this active Independence Day period can be READ HERE.
30th-1 August: A few rounds of showers and thunderstorms brought widespread rain and cooler temperatures to the region after a few hot and relatively dry weeks. The southwest Texas Panhandle and western South Plains were hardest hit with 2 to 4+ inches of rainfall common. Read more about this welcome wet stretch HERE.
AUGUST:
11th-12th: A slow-moving complex of showers and thunderstorms delivered another round of widespread rainfall. The southwest Texas Panhandle and northern South Plains saw the heaviest rain, with amounts of 1 to 3 inches common. Details on this next round of rain can be FOUND HERE.
13th: An intense supercell thunderstorm raked Turkey, Texas, with destructive winds and torrential rainfall. The winds damaged or destroyed several buildings including flattening the Turkey Compress. The damage was consistent with winds estimated at 100 to 120 mph. A full write-up on this event can be accessed HERE.
14th-15th: A late night round of thunderstorms brought widespread 1 to 2+ inch rain totals to the southern Texas Panhandle. For details on this round of rain CLICK HERE.
21st: The Great American Eclipse crossed the nation, with West Texas seeing a partial eclipse (if you could escape the clouds and scattered rain). Read more about this solar eclipse HERE.
22nd: A cold front sparked thunderstorms across the southern Texas Panhandle. The most intense storms brought flooding rains and a wind gust to 63 mph near Tulia. The thunderstorms developed southward through the evening hours depositing rain on much of the South and Rolling Plains. For details on these storms READ HERE.
1st June - 31st August: Summer 2017 started on the hot side, but trended cooler, especially by August. In addition, regular rain was common, especially from late June through August. Lubbock officially finished with its third wettest summer on record, recording 12.47 inches. A more complete summary of this wet summer can be FOUND HERE.
SEPTEMBER:
17th: Scattered strong to severe thunderstorms tracked across the southern Texas Panhandle and northern South and Rolling Plains during the evening. The most intense storm of the night caused extensive damage in Cone where straight line winds were estimated at 80 to 100 mph. Read more about these damage storms HERE.
23rd-28th: Several rounds of showers and thunderstorms brought widespread rain to the region. One to three inches of rain was common for most spots, with a few locations receiving over 4 inches. Details on this wet fall stretch can be FOUND HERE.
OCTOBER:
4th-5th: Torrential rain fell over parts of eastern Briscoe, northern and central Hall and western Childress Counties during the evening and overnight hours. Flooding occurred in Memphis and Estelline, and the Prairie Dog Town Fork of the Red River jumped above flood stage, peaking at 11.41 feet at the gauge north of Childress. This was the 7th highest peak ever measured at this gauge and the highest since 1995. More about this flooding rain can be FOUND HERE.
NOVEMBER:
1st-30th: The month was relatively dry and mild. Lubbock officially finished the month 4.7 degrees above average. Additionally, most stations around the region recorded less than a tenth of an inch for the 30 day period.
DECEMBER:
22nd: The first taste of winter visited the region. Many locations saw a little sleet and snow while temperatures fell into the 20s and 30s. Although most spots only saw trace amounts of wintry precipitation, a band of snow did setup and persist over the southeast Texas Panhandle into the northern Rolling Plains where 1 to 2.5 inches of snow fell. Read more about this touch of winter HERE.
30th- 2 January 2018: Arctic air poured into much of the nation east of the Rockies, including West Texas. The region saw a little freezing drizzle and light snow, but the main story was the cold. Two consecutive nights of single digit lows occurred just after 2017 came to an end. Lubbock officially stayed at or below freezing from early on the 30th to the morning of the 3rd. Read more on this bone-chilling stretch HERE.


 The main weather story of 2017 was the overall warmth. The year ended as the third warmest on record, overtaking 2016 from this distinction by finishing with an average yearly temperature of 63 degrees. Precipitation was regular and heavy enough to keep drought conditions from developing on more than localized and modest levels. 21.95 inches of precipitation fell at Lubbock during 2017, which was the 31st wettest in the historical record.
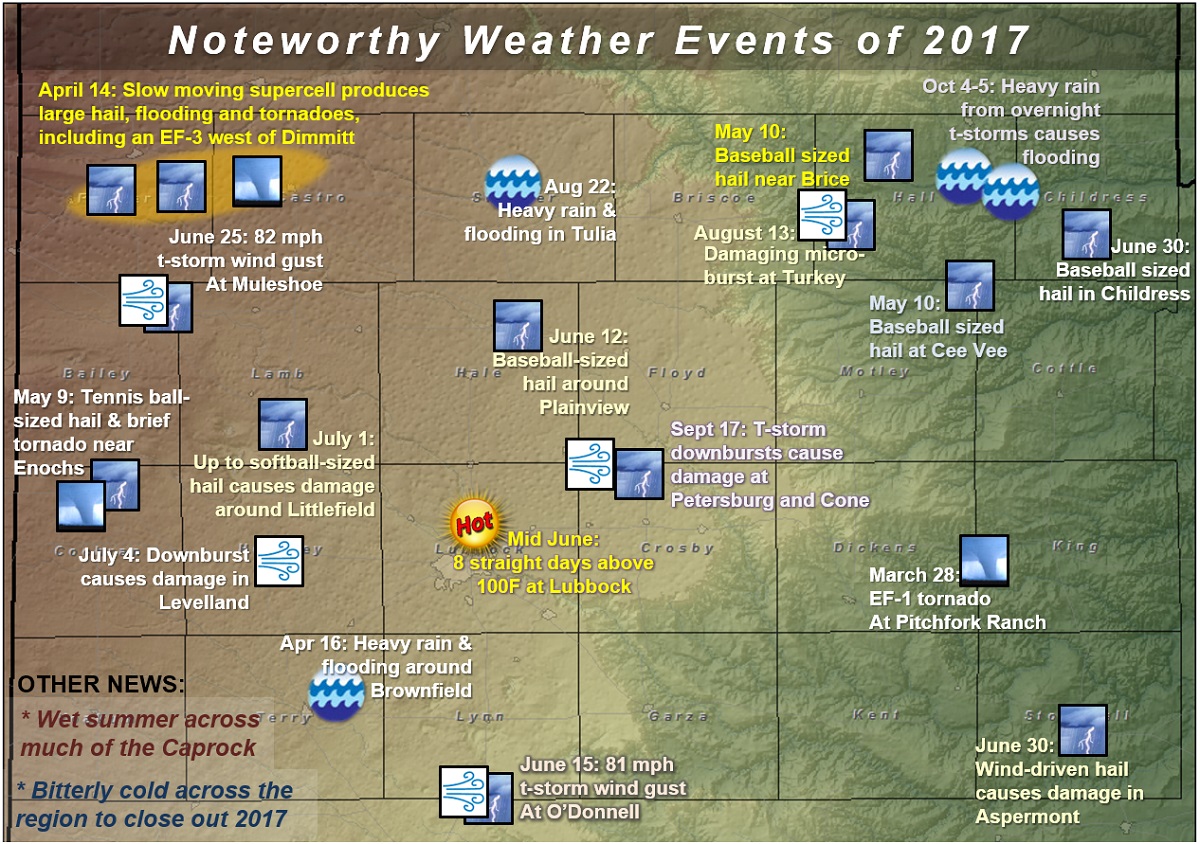

